E-ISSN: 2587-005X http://dergipark.gov.tr/dpusbe Dumlupınar Üniversitesi Sosyal Bilimler Dergisi, 65, 85-106; 2020
85
MEASURING PORT BRAND EQUITY: A SENTIMENT ANALYSIS ON PORT SOCIAL MEDIA MESSAGES
Sedat BAŞTUĞ Vahit ÇALIŞIR Seçil GÜLMEZ Alpaslan ATEŞ Abstract
In the last decades, ports are focusing their branding activities on disseminating the social media messages to the port users. The building of brand equity for seaports is an essential goal in various branding strategies, within which social media has become the marketing tool to create a strong brand. However, researchers struggle to implement successful social media analytics on brand equity. For this reason, this paper investigates how practitioners may measure brand equity of their seaports by performing social media sentiment analysis. Another aim of this study is to find whether the social media statistics are good enough to measure the success of the port brand equity. Sentiment analysis is employed to assess a sample of 63.699 tweets by 45 seaports, selected from Europe, Middle East, Far East Asia, and America. The most important findings are as follows: (a) Although social media analytics is the preferred research technique for marketing in the last decades, it should be supported by more complex research methods such as sentiment analysis. (b) Comparing the green ports, conventional ports have more positive effects on customers in terms of operational activities (c) The social media analytics may help to understand which port services maximize the branding equity.
Keywords: Business-to-Business Marketing, Brand Equity, Sentiment Analysis, Seaports, Social Media JEL Codes: M3, M30, M31
LİMAN MARKA DEĞERİ ÖLÇÜMÜ: LİMAN SOSYAL MEDYA MESAJLARI ÜZERİNE BİR SENTİMENT ANALİZİ
Öz
Son yıllarda limanlar, sosyal medya mesajlarını liman kullanıcılarına yaymaya yönelik markalaşma faaliyetleri üzerinde odaklanmaktadırlar. Limanlar için sosyal medyanın marka oluşturmak maksadıyla güçlü bir pazarlama aracı olarak kullanıldığı markalaşma stratejilerinde marka değerini inşa etmek önemli bir hedeftir. Ancak, araştırmacılar marka değeri üzerinde başarılı bir sosyal medya analizi uygulamakta zorlanmaktadırlar. Bu sebeple, çalışma sentiment analizi ile liman marka değerinin araştırmacılar tarafından nasıl ölçebileceğini araştırmaktadır. Bir diğer amaç ise, sosyal medya istatistiklerinin liman marka değeri başarısını ölçebilecek kadar iyi olup olmadığını ortaya çıkarmaktır. Avrupa, Orta Doğu, Uzak Doğu Asya ve Amerika'da yerleşik 45 limandan toplanan 63.699 tweet’ten oluşan örneklem sentiment analizinde kullanılmak üzere değerlendirilmiştir. En önemli bulgular şunlardır: (a) Sosyal medya analizi, B2B pazarlamasında son yıllarda tercih edilen araştırma tekniği olmasına rağmen, sentiment analizi gibi daha kompleks araştırma yöntemleriyle desteklenmelidir. (b) Bazı operasyonel dezavantajlar yüzünden müşteriler gözünde konvansiyonel limanların marka değeri yeşil limanlara oranla daha olumludur. (c) Sosyal medya analizi hangi liman hizmetinin marka değerinin maksimize ettiğinin görülmesi açısından da yardımcı olabilmektedir.
Anahtar Kelimeler: İşletmeden İşletmeye Pazarlama, Marka Değerli, Sentiment Analizi, Limanlar, Sosyal Medya JEL Kodları: M3, M30, M31
Dr. Öğr. Üyesi, Iskenderun Technical University, ORCID 0000-0002-7121-2882 Sorumlu Yazar (Corresponding Author): [email protected]
Dr. Öğr. Üyesi, Iskenderun Technical University, ORCID 0000-0001-6575-8988. Dr. Öğr. Üyesi, Iskenderun Technical University, ORCID 0000-0002-4342-4386. Doç. Dr., Iskenderun Technical University, ORCID 0000-0002-0933-2664.
Introduction
Although social media is a powerful marketing tool for creating brand equity, research into its effectiveness mainly focuses on Business to Consumer (B2C) contexts (Kumar and Mirchandani, 2012: 55; Rapp et al., 2013: 548; Taylor, Lewing and Strutton, 2011: 259; Wiersema, 2013: 470). Recently, however, practice and research have emerged from a business-to-business (B2B) perspective (Karjaluoto et al., 2015: 762; Kietzman et al., 2011: 242). Although there are many studies on measuring the usage of social media on branding for B2B companies, most do not offer academic intelligence because they have been slow to follow research into the social media phenomena (Wiersema, 2013: 470). Social media analytics tools are gaining importance to data mining, but it may difficult to follow the latest developments about what type of analytical data tool needs to be used to overcome big data challenges. These tools generally provide a snapshot of the social media content through statistical indicators (e.g., the number of Facebook likes, tweets, retweets, comments, engagement rates, monthly visitor traffic, search visits, and global ranks), but it remains incapable for a deeper analysis.
In the maritime industry and relevant sciences, the same research perspective continues, although the field of branding requires more compelling and stronger data mining techniques such as sentiment analysis. The sentiment analysis is to continue to dig deeper, far past the surface of the number of likes, comments, and shares, and aims to reach and truly understand the significance of social media interactions and what they tell researchers about the customers behind the screens. Besides, many practitioners in the port industry still evaluate the brand equity of seaports by focusing on their throughput volumes. Although the highest volumes may maintain a high level of brand equity, the quality of their services might be poor. Social media analytics helps to recognize the quality of seaport services by collecting user opinions and they aid researchers in finding what type of services are the best or worst given by the seaports.
Hence, this study aims to explore how practitioners may measure brand equity of their seaports by performing social media sentiment analysis. Another aim is to find if the simple social media statistics (the number of followers or engagement rates etc.) is good enough to measure the success of the port brand equity. In order to reach the aims, the study asks the following questions to reveal this phenomenon;
1) Which port brand is becoming far more aware of the social media “Tweeter” users? 2) What type of port service does provide customer satisfaction in order to maximize
brand equity?
3) Is the simple social media statistics really good enough to measure the brand equity of the seaports?
This paper is organized as follows. It begins with general information about social media and the importance of Twitter in the business world and the port industry. Then it explains relevant theories within a social media context in order to find out the phenomena. The following section explains how sentiment analysis is performed. Finally, the findings are well documented along with implications and future research directions.
1. Literature Review
The section of literature review contains several parts, including background of Twitter, function of Twitter in the port industry, social media communication theory, brand equity theory and branding equity of seaports.
87 1.1. Background of Twitter
Launched back in March 2006, Twitter has grown into one of the most popular social networking platforms in the world, with more than 330 million monthly active users and 500 million tweets sent per day. According to the Content Marketing Institute (CMI) and MarketingProfs’ 2017 B2B Content Marketing Trends North America report, Twitter is one of the most popular social networks for B2Bs, with 77% of B2B marketers using it to distribute social media content.
Twitter users may pursue specific business pages or brand communities and continuously retweet corporate tweets to their friends. Once they become a follower, all subsequent tweets appear in their timelines. Marketers may also pursue their users to investigate their conversations, sharings, and retweets. Twitter is a highly reliable tool for marketers to connect with customers interested in their offerings (Swani et al., 2014: 874) as it offers services to collect online market data, insights, and feedback.
1.2. The Place of Twitter in the Port Industry
Businesses are progressively maintaining social networking tools, such as Facebook, Youtube, LinkedIn, Pinterest, and Twitter (Jansen, Zhang, Sobel and Chowdury, 2009: 2170; Michaelidou et al., 2011: 1154). According to Barnes et al. (2012:15), Twitter is one of the most preferred social media platform in B2B contexts whereas less accomplished stories include B2B companies, especially in the service business. According to Spire’s 2015 Social Media report (see Table 1), many seaports are actively using Twitter, but confining their tweets to notices, facts, and events.
Table 1: Twitter Followers of Seaports by Year
Port Authorities Followers (2015) Followers (2018 Q2)
New York 31,456 61,949 Long Beach 13,354 19,947 Los Angeles 11,074 20,162 Rotterdam 8,872 20,618 Metro Vancouver 8,211 29,245 Miami 6,431 12,357 Tacoma 578 9,047 Seattle 568 10,719 Antwerp 5,406 12,283 Norfolk 4,785 9,160
Source: Spire Inc, (2018)
In contrast, the Port Authority of New York and New Jersey, which have the world’s biggest Twitter following among port authorities and daily tweets, choose Twitter to give information about on-going construction, port activities, and congestions, alongside with the latest port-related news and success stories.
1.3. Social Media Communication Theory
Communication is a human activity that links people together and creates relationships (Duncan and Moriarty, 1998: 5). Traditionally, communication models suggest that a sender creates a message, gets transmitted and the receiver fetches the sender's message. In communication processes, such as social media which the sender and fetcher switch the roles invariably while answering to each other's messages (Dennis, Fuller, and Valacich, 2008: 575; Labrecque, Zanjani, & Milne, 2012: 134; Mueller, Garg, Nam, Berg, and McDonnell, 2011: 18). This a comment loop in which the receiver feeds back to the sender.
In the social media context, B2B marketers fetch and send contents through social media platforms, and their customers fetch the messages. Marketers should decide which content elements consist of communications to drive their audiences to attach with their brands. Upon their successful motivation, they also continue the dialog, share the messages with their network, follow these actions, reply to comments and continue the dialogs again.
The utility of Twitter, or any social media site, hinges on massive numbers of people sharing content; for marketers that content aids in developing the brand's image (Berger and Milkman, 2012: 193). Marketers search for understanding which content is most likely to be tweeted among users. Hence, tweets are communication blocks; the content of tweets has particular importance as engagement element, customer relationships, and other financial outcomes (Kumar and Mirchandani, 2012: 60; Rapp et al., 2013: 554).
1.4. Brand Equity Theory
According to Keller (1993: 3), brand equity includes two elements of brand awareness and brand image. Brand awareness defines the understanding to find a brand separately from other brands under various situations. However, regarding Aaker, (1992: 28) brand equity includes four elements of brand awareness, perceived quality, brand associations, and brand loyalty. Leone et al. (2006: 127) classified three critical components of brand equity as brand awareness, customer brand attitudes and customer perceptions of brand ethics.
1) Brand awareness defines the customers’ ability to admit or evoke that a brand is an element of the particular product category (Aaker, 1992: 30).
2) Brand association refers to everything connected with a memory about the brand. It turns into a stronger thing when it happens on customer experience or exposure (Aaker, 1992: 31).
3) Perceived quality is the extent to which customers’ comprehensive effect on the products or services comes under a particular brand name. It can be seen as another core aspect of brand equity (Aaker, 1992: 30).
4) Brand loyalty is described as behavioral feedback of customers (Godey, Manthioua, Pederzoli, Rokka, & Aiello, 2016: 5834).
In addition to Keller (1993: 10) and Aaker (1992: 30), Mahajan et al. (1994: 222) evaluated the brand equity as the level of customer understanding while Farquhar (1989: 26) described brand equity can be changed by consumers’ thoughts Brand equity is an essential element and a key component in branding, and it is a decisive factor for the customer when selecting among brands. Marketing communications activities contribute to brand equity and drive sales in many ways: by building brand awareness, connecting the right associations with the brand image on the consumers’ mind, revealing positive brand judgments and/or simplifying a solid consumer-brand connection (Keller, 2009: 146).
In the B2B literature, as far is known, the studies on brand equity measurement are limited and current studies mostly combines mathematical methods or related techniques rather than using social media metrics (see Table 2). Social media metrics can provide opinions, feelings, satisfaction ratings, quality of sharing?, comments, re-tweets, replies, ratings or conversations along with the comprehensive quality of engagement over time. The measurement is that it can aid bringing to light and motivate the learnings from the key aspects of the brand; awareness, appeal, service, and content and let to uncover the positive, negative or neutral dimensions of a brand shared online and importantly behave to it. Brand equity is the intangible asset that it cannot be touched or held. Its value is calculated regarding the amount of recognition attributed by the consumers or potential consumers of the product or service. Sentiment analysis is based on bespoke algorithms that recognize certain words as ‘positive’ or ‘negative’, let to know if the
89
brand is being cherished or floored. If a Twitter user tweets posting included 'awful', 'disappointing' contents, sentiment analysis will accredit that post as ‘negative’.
Table 2: Literature for Measuring Brand Equity in the B2B context
Author, Year
Title of the Study Sample Data
Collection
Research Method Lai et al.,
2010
The Effects of Corporate Social Responsibility on Brand Performance: The Mediating Effect of Industrial Brand Equity and Corporate Reputation Taiwan Manufacturing and Service Companies Questionnaire Structural Equation Modeling Michaelidou et al. 2011
Usage, Barriers, and
Measurement of Social Media Marketing: An Exploratory Investigation of Small And Medium B2B Brands
1000 UK SME Questionnaire Frequency Analysis
Cawsey and Rowley, 2016
Social media brand building strategies in B2B companies 14 B2B Companies in the telecommunications, financial services, and IT industries across the UK, USA, Ireland and France In-depth semi-structured interviews Thematic Analysis Kalampokis et al., 2016
Applying Brand Equity Theory to Understand Consumer Opinion in Social Media
Tweets of IKEA and Gatorade
Twitter Sentiment Analysis
1.5. Branding Equity of Seaports
Many ports live and die by their numbers: container throughput, the volume of the container, the value of container, tax revenue generated, etc. However, these numbers do not tell the whole story of a port. They are cold, hard to understand, and impersonal; they are not a narrative and do not what a port is in the eyes of its stakeholders, community, or customers. Ports throughout the hemisphere are recognizing that they need to create strong brands for themselves in order to succeed. Moreover, they are increasingly embracing sophisticated concepts of the brand that go far beyond old ideas of merely giving more valuable marketing information. To promote their port brands, they share their rankings by which some prestigious journals annually prepare the top container seaports about their container throughput. However, they implement better marketing strategies supporting the mediators (e.g. opinion leaders, consumers) to spread product or service content. Both commercial and non-commercial content can be broadcasted through ports’ social media pages. Non-commercial messages, for example, social responsibility projects, design to develop public relations and indirectly generate revenue through targeting the conscience of customers and increasing positive perceptions about the company.
2. Methodology
Sentiment analysis or opinion mining is the process of determining the emotion behind a series of words, generally for use in social media, opinions, and emotions expressed over an online platform (Liu, 2012: 7). Some of the analysis in sentiment analysis is on customer markets and movie critics (Hu and Liu, 2004: 169; Popescu and Etzioni, 2007: 9). Although the sentiment analysis has been used in different research fields, to the best of authors’ knowledge, there is no further study to examine the B2B and maritime transportation literature by this methodology.
From this point, it offers scholars to compare the results of sentiment analysis between port industry and other B2B sectors.
Sentiment analysis encompasses three different approaches: subjective lexicon, n-gram modelling and rule-based machine learning. This study uses the subjective lexicon approach which is based on Opinion Observer (OO). The lexicon-based approach does not need to be any prior training in order to fetch the data. According to Alessia et al. (2015: 27), it is a word list that is nominated to a score that shows its nature in terms of positive, negative or objective. It uses opinion words and special words with a context-dependent, phrases and language constructs which effect opinions through their linguistic figures. OO utilizes a word bank that is facilitating work expansion (WordNet) on a small set of annotated words. Regarding the WordNet, the polarity score is afloat within the range [-1.0, 1.0]. The subjectivity is afloat within the range [0.0, 1.0] where 0.0 is very objective and 1.0 is very subjective. In this study, the “Tweepy” python library is used to perform the sentiment analysis and it has a feature to collect, clean and interpret the words from WordNet. However, accuracy level of WordNet based sentiment analysis may be lowest than other sentiment techniques. Thus, SentiWordNet 3.0 has been assigned to WordNet to improve the accuracy of the study. By this lexical resource, Baccianella et al. (2010: 2200) ensured accuracy improvements of about 20% with respect to classical WordNet techniques.
The sentiment analysis is a complex process that involves five different steps to analyse sentiment data: data collection, text preparation, sentiment detection, sentiment classification, and presentation of output (Alessia et al., 2015: 26).
2.1. Data Collection
The sampling of this study is a single year for the port list supplied from Lloyd’s (2017) regarding their annual container throughput in Appendix 1. The sample (see Table 3) consists of 45 seaports that have official Twitter accounts. Whilst some of the Twitter accounts associated with port authorities, others were handled by port operators. These operators not only used a Twitter account for marketing activities in the seaport but they are also in use in other industries. However, sentiment analysis only assesses those tweets and retweets about the marketing activities at port or terminal.
In order to collect data, authors have firstly created customer key and access token in order to grant fetching of data by Tweeter developer credentials. The next step is to fetch tweets into the console program which is programmed by Python language. Python is one of the most widely-used high-level programming languages for the researchers. In this study, the researchers have used customized code to collect tweets from the 45 seaports. The search string for the first research question is identified as the port brand names. When the best port brand name is identified, the following code is successfully executed. The search string is the combination of the best port brand name and keywords of seaport services.
91 Table 3: The Sample of Seaports and Services
Port Brand Name with Hashtags Port Services with Hashtags
ABP Southampton (#ABPSouthampton) Bunkering (#Bunkering)
Abu Dhabi Ports (#AbuDhabiPorts) Container Handling (#Containerhandling) Adani Group (#AdaniOnline) Container rail shuttle service
(#Containerrailshuttleservice) Alexandria Port (#AlexandriaPort) Dredging (#Dredging) Autoridad Portuaria de Guayaquil
(#PuertoGye) Enviromental services (#Environmentalservices) Chennai Port (#PortofChennai) Internet-based information services
(#internetinformation)
DP World (#DP_World) Marine shuttle service (#shuttleservice) Georgia Ports (#GaPorts) Mooring (#Mooring)
Hafen Hamburg (#PortofHamburg) Passenger services (#passengerservices) Hutchison Ports PPC (#HutchisonPPC) Pilotage (#pilotage)
IPC Tanjung Priok (#IPCTanjungPriok) Towage (#towage) JNPT (#JNPort)
LondonPortAuthority (#LondonPortAuth) MPA Singapore (#MPA_Singapore) Nigerian Ports (#nigerianports) Philippine Ports Authority (#phports) Port Authority NY&NJ (#PANYNJ) Port Authority of Ja (#PortAuthorityJa) Port de Barcelona (#portdebarcelona) Port de Montréal (#PortMTL) Port Houston (#Port_Houston) Port Klang Authority (#pkamalaysia) Port of Antwerp (#PortofAntwerp) Port of Felixstowe (#felixstowe_port) Port of Long Beach (#portoflongbeach) Port of Los Angeles (#PortofLA) Port of Melbourne (#PortofMelbourne) Port of Oakland (#PortofOakland) Port of Rotterdam (#PortOfRotterdam) Port Of Salalah (#port_salalah) Port of Seattle (#PortofSeattle) Port of Vancouver (#PortVancouver) Port of Zeebrugge (#Port_Zeebrugge) Port Tanjung Pelepas (#PTPMalaysia) Porto di Genova (#portodigenova) Puerto Buenos Aires (#PuertoBsAs) Puerto de Algeciras (#PuertoAlgeciras) Puerto de Cartagena (#PuertodeCtg) South Carolina Ports (#SCPorts) The Port of Virginia (#PortofVirginia) Transnet NPA (#TransnetNPA) Valenciaport (#AutPortValencia)
MAWANI (#MawaniKSA)
Jeddah Port (#jeddahport) Yokohama (#yokohamaportypc)
As a result of the data collection stage, 63.699 tweets were collected on 17.04.2019 and the social media statistics of the ports sample are illustrated regarding below tweeter parameters in Table 4. Scholars practice on Twitter for a huge array of subjects by keywords and particularly
parameters: Screen name, followers, friends, favourites, retweets and engagement rates etc. In this section, they should be well explained how they make it easier to analyse their research
questions. Mostly preferred parameters are;
a) Screen name: The screen name of the user for whom to return results. It refers to the nickname that the user chooses to use when communicating with others online. It can be a person’s real name, a variation of a person’s real name, or it can be made-up pseudonym.
b) Followers: They are the number of people who receive other people's Twitter updates. Twitter’s model allows one-way following. It adds depth and segmentation to the user’s friend list without doing any configuration beyond hitting the follow button.
c) Friends: They are the number of every user the specific user is following.
d) Median Fav: It is defined as the median total of favorites, which is generally used in daily conversation as regards something someone likes. They can also reference social-media activity.
e) Median Retweets: It is the median total repost of the messages to the Twitter online messaging center. Twitter retweets feature helps the user and others quickly share that Tweet with all of the user’s followers.
f) Engagement Rates: Engagement rate defines the total number of times and focuses to explain how actively an audience pays attention to the content. For calculating the engagement rate, its ranges are listed below;
- An engagement rate between 0% and 0.02% is recognized as low. A mediator with a low engagement rate on Twitter could predict between 0 - 0.2 reactions for every 1000 followers.
- Engagement rates between 0.02% and 0.09% are recognized to be good. A mediator with a are engagement rate on Twitter could predict between 0.2 - 0.9 reactions for every 1000 followers.
- An engagement rate between 0.09% and 0.33% is recognized to be high, where a mediator would expect 0.9 - 3.3 reactions for every 1000 followers on Twitter.
- Lastly, an engagement rate between 0.33% and 1% is recognized to be very high, with expected reactions to be between 3.3 - 10 for every 1000 Twitter followers.
93 Table 4: Social Media Statistics (Seaports)
No Seaport Followers Friends
Median Engagement
Rates (%)
Fav Retweets
1 ABP Southampton 6345 1137 14.0 3.0 1.0
2 Abu Dhabi Ports 8456 575 5.0 1.0 1.0
3 Adani Group 69314 92 50.0 12.5 1.0 4 Alexandria Port 6 1 0.0 0.0 0.25 5 Autoridad Portuaria de Guayaquil 1367 133 7.5 5.0 1.0 6 Chennai Port 2720 0 4.0 0.0 1.0 7 DP World 92585 237 19.0 6.0 1.0 8 Georgia Ports 4488 2488 10.5 3.0 1.0 9 Hafen Hamburg 3895 161 17.0 1.0 1.0 10 Hutchison Ports PPC 3149 23 3.0 1.0 1.0
11 IPC Tanjung Priok 281 42 3.0 3.0 0.65
12 JNPT 4801 96 18.5 4.0 1.0
13 LondonPortAuthority 17486 1056 1.0 1.0 1.0
14 MPA Singapore 2641 162 2.0 1.0 1.0
15 Nigerian Ports 31266 34 33.0 24.0 1.0
16 Philippine Ports Auth. 147 44 1.0 1.0 0.42
17 Port Authority NY&NJ 66386 310 7.0 0.0 1.0
18 Port Authority of Ja 180 103 1.0 1.0 0.38
19 Port de Barcelona 10805 1120 3.0 1.0 1.0
20 Port de Montréal 2578 429 6.0 3.0 1.0
21 Port Houston 6783 375 2.0 0.0 1.0
22 Port Klang Authority 1378 62 0.0 0.0 0.15
23 Port of Antwerp 13787 2564 11.0 1.0 1.0
24 Port of Felixstowe 1770 2 0.0 0.0 0.90
25 Port of Long Beach 20633 3645 1.0 0.0 1.0
26 Port of Los Angeles 21350 2389 6.0 2.0 1.0
27 Port of Melbourne 834 2 4.5 0.0 0.81 28 Port of Oakland 6687 259 3.0 1.0 1.0 29 Port of Rotterdam 22647 303 7.0 3.0 1.0 30 Port Of Salalah 7285 84 10.0 2.0 1.0 31 Port of Seattle 11625 551 5.0 1.0 1.0 32 Port of Vancouver 12397 1781 4.0 1.0 1.0 33 Port of Zeebrugge 4173 222 4.0 2.0 1.0
34 Port Tanjung Pelepas 589 147 3.0 1.0 0.87
35 Puerto Buenos Aires 6659 105 34.0 16.0 1.0
36 Puerto de Algeciras 5937 603 10.0 3.0 1.0
37 Puerto de Cartagena 6171 950 8.0 4.0 1.0
38 South Carolina Ports 8675 1795 10.0 2.0 1.0
39 The Port of Virginia 8860 1135 1.0 0.0 1.0
40 Transnet NPA 5450 251 3.5 1.0 1.0 41 Valenciaport 5460 401 2.0 0.0 1.0 42 MAWANI 678 52 0.0 0.0 0.31 43 Jeddah Port 956 456 2.0 1.0 0.75 44 Yokohama 823 2 0.0 0.0 0.12 45 Porto di Genova 689 102 1.0 0.0 0.54
In Table 4, DP World has a significant number of followers, but fewer friendships with other users. It means that they treat the information flowing in and out of these pages specially, so that
they know not vast amounts of information from random people, and they can segment those interactions out. On the other hand, most of the ports are excellent content creators regarding their engagement rates. With the amount of content competition on Twitter, accounts in this tier are the most likely to be able to build long-term highly valuable businesses.
2.2. Text Preparation
Text preparation includes cleaning and extracting data before performing analysis. The content of tweets is converted from upper case to lower. Non-textual (such as URLs) and irrelevant content is identified and eliminated. After that, to determine the languages of tweets, a language detection web service, named “Language Detection API” was used. Language detection API is a free API that allows up to 5000 requests per day and detects 160 different languages. After detection operation with Python, 103 foreign languages were detected, such as Thai, English, Korean. For the second phase of pre-processing, all tweets, which were not including some Non-English words, were removed permanently, while the inclusion and exclusion criteria (see Table 5) are strictly observed.
Table 5: Inclusion and Exclusion Criteria
Inclusion Criteria Exclusion Criteria
Port Authority and Port Terminal Operator Twitter Pages
Irrelevant Twitter Pages (such as seafarers’ fan pages)
Tweets, Retweets Non-English text
English Language Non-Textual (URL’s, Unicode Characters) Spam Tweets (such as advertisements) Other Social Media Platforms
At the end of this phase, the number of tweets was reduced from 63.699 to 4.652 tweets. Given the decrease in data count, the importance of data cleaning has arisen, as shown in the data pre-processing Figure 1.
Figure 1: Data Pre-processing of Twitter Content
Raw Data Converting to lower/
upper case Remove URL s
Remove Unicode Characters and
Non-English Characters
Remove Newline
Characters Text Preparation
2.3. Sentiment Detection
Some studies (Hatzivassiloglou and Wiebe, 2000: 303; Wiebe et al., 2004: 280, Benamara et al., 2007: 3) mention that sentiment or opinion detection is the first task, which may be considered as analysis of text as objective or subjective. Essentially opinion disclosure is strictly connected with the diagnosis of adjectives in sentences. A recent study (Hatzivassiloglou and Wiebe, 2000: 304) found out that the adjectives contain subjectivity in a text. More studies (Benamara et al., 2007: 4) examined that adverbs may be adopted for similar purposes. In this step, the sentences of the tweet contents are observed. Sentences with subjective expressions (opinions, beliefs and views) are saved and sentences with objective communication are removed.
2.4. Sentiment Classification
The sentiment classification is an assignment of allocating a target object in a document to positive, negative or neutral. The classification levels of sentiment analysis consist of document level, sentence level and aspect-level. In this study, sentence-level is preferred to examine the tweets because other levels are inadequate to perform sentiment analysis. When a text with a different opinion has been given, the objective is to arrange the opinion as falling under one of
95
two conflicting sentiment polarities or locate its position on the continuum between these two polarities (Pang and Lee, 2004: 271).
The subjective sentences should be classified in positive, negative, and neutral, but classification can be generated by multiple points. Polarity classification utilizes a multi-point scale to categorize between different mixtures of the three opposites. This is where the task becomes a multi-class text categorization problem. In this study, the sentiment classification is performed by Python library “textblob” which has a sentiment feature to carry out subjective lexicon-based dictionary (SentiWordNet 3.0) analysis. It is a free, open-source and community-driven project. The lexicon-based analysis includes two types of classification techniques: dictionary-based and corpus-based. The dictionary-based approach is based on the construction of a dictionary that indicates a positive or negative polarity of a word, also called opinion word. This set of seed words built manually symbolizes the main keywords of the dictionary, then it can be combined with synonyms and antonyms using databases of opinion words made for sentiment analysis. There are many of them on the internet, the most typical ones are Sentiwordnet (Esuli et al., 2006: 420; Baccianella et al., 2010:2201), Q-wordnet (Agerri et al., 2010: 2300), WordNet-Affect (Strapparava et al., 2004: 1084; Hu and Liu, 2004: 169; Kim et al., 2004: 2; Strapparava et al., 2006: 424; Mohammad et al., 2009: 601). Kamps et al. (2004: 1116) used seed words and linked them with synonyms from WordNet dictionary giving them a polarity. Of course, there are different performance measures among the classification techniques: machine learning, lexicon-based approaches, crossdomain and cross-lingual approaches. Especially machine learning techniques offer very high accuracy compared to lexicon-based techniques. However, recent studies (see Table 6) shows that lexicon-based dictionary techniques may reach the high accuracy thanks to the dictionary performance of SentiWordNet 3.0. In Table 6, lexicon-based dictionary technique seems very accurate in the Social Media research field.
Table 6: Performance Comparison of Sentiment Classification Methods
Method Dataset
Max.
Accuracy Author
Machine learning
SVM (*) Movie reviews 86.40% Pang and Lee (2004) CoTraining SVM Twitter 82.52% Liu et al. (2013) Deep learning Stanford Sentiment Treebank 80.70% Socher et al. (2013)
Lexicon Based
Corpus Product reviews 74.00% Moilanen et al. (2010) Dictionary Twitter 86.00% Nakov et al. (2016)
Cross-lingual
Ensemble Amazon 81.00% Wan (2012)
Co-Train Amazon,IT168 81.30% Wan (2009)
EWGA IMDb movie review >90% Abbasi et al. (2008)
CLMM MPQA,NTCIR,ISI 83.02% Meng (2012) Cross domain Active Learning Book, DVD, Electronics, Kitchen 80% Li et al. (2013)
Thesaurus Bollegala et al. (2013)
SFA Pan (2010)
*
Support Vector MachineIn order to measure the accuracy of the results, confusion matrix is a typical way for classification tasks (i.e. classifying dataset) by using evaluation metrics: precision, recall, error rate or accuracy. Table 7 shows confusion matrix to define the terms as follows:
Table 7: Definition of Confusion Matrix Predicted class P N Actual Class P
TP (True positives): The number of
tweets that both the human and computer agree to belong to the current class.
FN (False negatives): The number of tweets
that the human says they belong to the current class but the computer says they do not belong to that class.
N
FP (False positives): The number of
tweets that the computer program classifies them to belong to the current class while the human says they do not belong to that class.
TN (True negatives): The number of tweets
that both the human and computer agree that they do not belong to the current class.
Source: Adapted from Erşahin et al. (2019)
Accuracy (Acc) refers to the ratio of the number of tweets that correctly classified to the total number of tweets. The calculation of this ratio is given in Eq (1);
Acc = (TP + TN) / (TP + TN + FP + FN) (1)
Precision (Pr) defines as the probability that a randomly selected tweets is retrieved as relevant.
This probability is calculated as the ratio of the total number of positive tweets that are correctly classified to the total number of positive classified tweets, as in Eq(2);
Pr = TP / (TP + FP) (2)
Recall (Re) refers to the probability that a randomly selected relevant tweet is retrieved in a
search. It is calculated as the ratio of total number of positive tweets that are correctly classified to the number of positive tweets that are in the dataset, as in Eq. (3):
Re = TP / (TP + FN) (3)
The F-measure (Fm) is the harmonic mean of precision and recall and it is calculated as in Eq.
(4):
Fm = 2 * Pr * Re / (Pr + Re) (4)
This study have performed experiment (see Table 8) on sentiment classification which is based lexicon-based integrated approach for multi-class classification (positive versus negative versus neutral). The experiment shown that the metrics indicates good prediction.
Table 8: Multi-class Classification Performance
Measures Positive Negative Neutral
Accuracy 0,89 0,83 0,72
Precision 0,79 0,74 0,81
Recall 0,89 0,95 0,77
F-Score 0,93 0,65 0,77
In the process, the evaluations were compared in the contents of tweets were the baseline, yet they had distinctive notions on the sentiments. For avoiding misunderstanding and misinterpretations, α should have a somewhat high value. Social scientists commonly rely on data with reliabilities α ≥ ,800, consider data with,800 > α ≥ ,667 only to draw tentative conclusions, and discard data whose agreement measures α < ,667 (Krippendorff, 2004: 219).
97 3. Presentation of Output
Sentiment analysis is the research methodology “computationally” determining if a piece of writing positive, negative, or neutral. It is also known as opinion mining, deriving the opinion or attitude of Twitter users. In marketing discipline, practitioners use this methodology to improve their marketing strategies, to know customer’s opinions towards seaport’s services, how industrial users or twitter users respond to their seaport brand names and why users like twitter or not like to seaport brands.
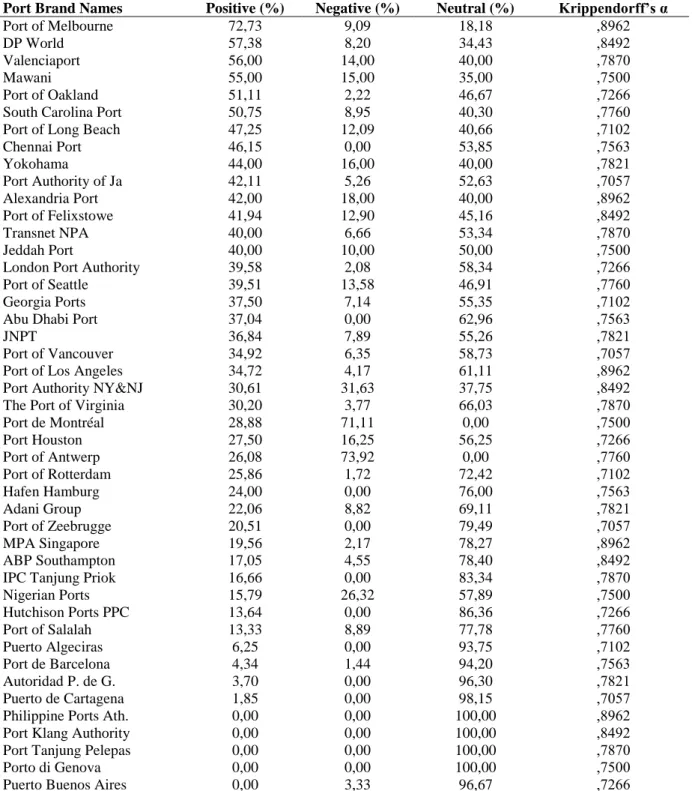
Table 9: Sentiment Analysis about Port Branding Opinions of Seaports’ Customers
Port Brand Names Positive (%) Negative (%) Neutral (%) Krippendorff’s α
Port of Melbourne 72,73 9,09 18,18 ,8962
DP World 57,38 8,20 34,43 ,8492
Valenciaport 56,00 14,00 40,00 ,7870
Mawani 55,00 15,00 35,00 ,7500
Port of Oakland 51,11 2,22 46,67 ,7266
South Carolina Port 50,75 8,95 40,30 ,7760
Port of Long Beach 47,25 12,09 40,66 ,7102
Chennai Port 46,15 0,00 53,85 ,7563 Yokohama 44,00 16,00 40,00 ,7821 Port Authority of Ja 42,11 5,26 52,63 ,7057 Alexandria Port 42,00 18,00 40,00 ,8962 Port of Felixstowe 41,94 12,90 45,16 ,8492 Transnet NPA 40,00 6,66 53,34 ,7870 Jeddah Port 40,00 10,00 50,00 ,7500
London Port Authority 39,58 2,08 58,34 ,7266
Port of Seattle 39,51 13,58 46,91 ,7760
Georgia Ports 37,50 7,14 55,35 ,7102
Abu Dhabi Port 37,04 0,00 62,96 ,7563
JNPT 36,84 7,89 55,26 ,7821
Port of Vancouver 34,92 6,35 58,73 ,7057
Port of Los Angeles 34,72 4,17 61,11 ,8962
Port Authority NY&NJ 30,61 31,63 37,75 ,8492
The Port of Virginia 30,20 3,77 66,03 ,7870
Port de Montréal 28,88 71,11 0,00 ,7500 Port Houston 27,50 16,25 56,25 ,7266 Port of Antwerp 26,08 73,92 0,00 ,7760 Port of Rotterdam 25,86 1,72 72,42 ,7102 Hafen Hamburg 24,00 0,00 76,00 ,7563 Adani Group 22,06 8,82 69,11 ,7821 Port of Zeebrugge 20,51 0,00 79,49 ,7057 MPA Singapore 19,56 2,17 78,27 ,8962 ABP Southampton 17,05 4,55 78,40 ,8492
IPC Tanjung Priok 16,66 0,00 83,34 ,7870
Nigerian Ports 15,79 26,32 57,89 ,7500 Hutchison Ports PPC 13,64 0,00 86,36 ,7266 Port of Salalah 13,33 8,89 77,78 ,7760 Puerto Algeciras 6,25 0,00 93,75 ,7102 Port de Barcelona 4,34 1,44 94,20 ,7563 Autoridad P. de G. 3,70 0,00 96,30 ,7821 Puerto de Cartagena 1,85 0,00 98,15 ,7057
Philippine Ports Ath. 0,00 0,00 100,00 ,8962
Port Klang Authority 0,00 0,00 100,00 ,8492
Port Tanjung Pelepas 0,00 0,00 100,00 ,7870
Porto di Genova 0,00 0,00 100,00 ,7500
Puerto Buenos Aires 0,00 3,33 96,67 ,7266
In this study, the research question “Which port brand is becoming far more aware for the social media users?” has answered that the port brand name of Melbourne (see Table 9) has the highest
positive opinions of tweet users. Interestingly, the port of Melbourne is not listed in the top 100 seaports regarding throughput volumes.
That is why the second research question, “Which port service does provide customer satisfaction in order to maximize brand equity?” is asked and separately sentiment analysis is performed for the seaport’s services in Melbourne. When the tweets linked with seaport’s services are examined, it should be clear evidence to show which services in Melbourne provide positive attitudes in customer satisfaction.
When the study examines the opinions of Twitter users for the port of Melbourne, container handling services (see Table 10) maximize customer satisfaction. The port of Melbourne has better facilities in container handling such as several decentralized workshops with machinery and other facilities and a port education centre for the training of employees. However, pilotage is the less positively tweeted port services. It may be caused by the independent organization “Victorian Port Melbourne” for all vessels over 35 meters Length Over All (LOA) transiting port of Melbourne waters, except for vessels whose master holds a current Pilot Exemption or Local Knowledge Certificate for port waters.
However, it is crucial to see that the port of Melbourne is 47th ranked seaport in the top container port list of Lloyd list (2017). This interesting finding shows that annual cargo throughput is not only a success indicator of the seaport. For example, the port of Singapore is the second-largest port in the world and has a great social media account, which is not significant positive impact on container handling services compared to the conventional port.
Table 10: Sentiment Analysis about Port Services Opinions of Melbourne Seaport Customers
Port Services Positive
(%) Negative (%) Neutral (%) Krippendorff’s α Container Handling 61,90 4,76 33,34 ,7266 Enviromental services 39,77 18,18 42,05 ,7760 Mooring 37,50 5,68 56,82 ,7102 Internet-based information srvc. 34,04 19,15 46,81 ,7563 Towage 31,25 6,25 62,50 ,7821 Passenger services 29,73 18,92 51,35 ,7057
Marine shuttle service 26,58 13,92 59,49 ,8962
Container rail shuttle service 26,25 18,75 55,00 ,8492
Bunkering 17,39 21,74 60,87 ,7870
Dredging 17,19 12,50 7,31 ,7500
Pilotage 6,09 3,65 90,24 ,7266
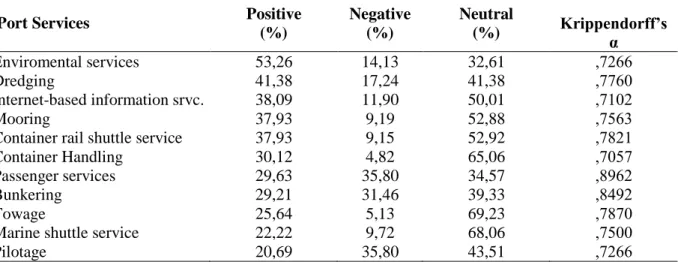
In contrast to the port of Melbourne, the environmental services in the port of Singapore has the highest positive opinions regarding twitter users. Also, second-ranked service is dredging that the port authority gives more importance to the expansion of the Tuas terminal. On the other hand, pilotage also has the lowest positive impact on users because of the services owned by the state organization.
99
Table 11: Sentiment Analysis about Port Services Opinions of Singapore Seaport Customers
Port Services Positive
(%) Negative (%) Neutral (%) Krippendorff’s α Enviromental services 53,26 14,13 32,61 ,7266 Dredging 41,38 17,24 41,38 ,7760 Internet-based information srvc. 38,09 11,90 50,01 ,7102 Mooring 37,93 9,19 52,88 ,7563
Container rail shuttle service 37,93 9,15 52,92 ,7821
Container Handling 30,12 4,82 65,06 ,7057
Passenger services 29,63 35,80 34,57 ,8962
Bunkering 29,21 31,46 39,33 ,8492
Towage 25,64 5,13 69,23 ,7870
Marine shuttle service 22,22 9,72 68,06 ,7500
Pilotage 20,69 35,80 43,51 ,7266
4. Discussion and Managerial Implications
This study explores how practitioners measure brand equity of their seaports by fetching the content of social media “Tweeter”. The phenomenon is discussed by asking three questions. It would be beneficial to find which seaport brand is being aware by tweeter users and what type of port services ensure the customer satisfaction by maximizing brand equity. Lastly, there would be good enough to know if the simple social media statistics really works to measure the brand equity of the seaports.
Sentiment analysis can gather positive and negative discussions to give researchers online notifications so that the ports can response instantly. If the stakeholders disagree about something (higher tariff rates, misimplementations in green port applications, etc.) related to the port brand, the faster port management can answer, the more likely stakeholders will disremember being annoyed basically, and be delighted with excellent customer service.
To measure top performing port brands, ports may choose social media tools with the aim of calculating engagement rate, analysing competitors, following campaign, checking brand, improving competitive intelligence, developing customer care, launching services, ranking mediators. However, most of the studies focus on the container throughput alongside their social media engagement rates and follower numbers as the success indicators. Many seaport brands are generating and sending the content up to three times per day, but they never connect with other users. They only send tweet after tweet and never attract to interact with the port brand. The actual phenomenon is that they do not enlist with users as a person or as a business and hence their contents are lost on users. It is crucial to observe at other ways in which port brands can tackle the power of Twitter and use it to create a quality audience, doubled followers and linked with port customers. Social media statistics are an excellent beginning to measure the port brand equity but it is not enough. For example, in relevant studies volume is measured with the number of blog posts (Chen et al., 2011:86), the number of product ratings (Moe and Trusov, 2011: 448), the number of Facebook likes (De Vries et al., 2012:84), the number of threads (Netzer et al., 2014:621) or the difference in number of reviews (Tirunillai and Tellins, 2012:203). It shows that there is no study to measure a relationship analysis quantitatively between the opinions of tweeter users and port brands and literature uses different social media metrics to quantify the opinions of consumers so far. As a result, the achievement of port marketing strategy is not calculated only by the increase in the number of followers, likes or comments. Customer satisfaction is also based on how much positive opinions the port can help increase port brand equity amongst the customers.
By doing sentiment analysis in this study, the port can evaluate how much positive or negative opinions have arisen and complete market research by getting to know what port customers’ opinions are about port services and how the port can align the service quality and features with their demands. The port services are not judged only by how well they perform functionally but also by how nicely they are presented in the forms of, for example, reasonable pricing at services, new technological services, automated container handling and accommodation opportunities for seafarers in transit etc. Ideas to develop the port service quality and how they are performed can only be derived from port target customers’ opinions. It may be a favourite way to do that is by conducting a structured and planned survey. Another method is that provided information from the daily discussions about the port brand in social platforms.
In this study, the port of Melbourne is the highest ranking in the positive opinions while the port of Singapore has the highest container throughput, but it has very low positive opinions. When the study examines the breakdown of the quality of services for both seaports by sentiment analysis. It shows that cargo handling in the port of Melbourne has very high positive opinions whereas the port of Singapore is very low. Also, the port of Singapore committed USD 100 million to the Maritime Singapore Green Initiative (MSGI) since 2011. The Green Ship Programme of Singapore encourages Singapore-flagged ships to reduce carbon dioxide (CO2) and sulphur dioxide (SOX) emissions. Ship management companies that operate Singapore-flagged vessels can ensure a reduction in port dues. However, the program does not cover the flag of convenience vessels. So, the managers may think that the green port is a good concept at first sight but it does not provide cost differentiation for their other flagged vessels. Hence, the branding message of the green port does not have a good marketing strategy regarding the customer’s feelings compared to the conventional port. Interestingly, the pilotage has the lowest positive tweeter users’ opinions for the port of Melbourne, whereas the port of Singapore has an excellent positive impact on twitter users because the port of Singapore invested USD 1,82 billion for the construction of a new terminal with 20 deep-water berths having a total capacity of 20 million twenty-foot equivalent units (TEU) per annum.
As a result of a deeper and better understanding of the feelings, emotions and sentiments of a port brand, high value of audiences, members of these audiences will increasingly receive experiences and messages that are personalized and directly related to their demands. Rather than segment port market based on container throughput, hinterland connectivity, competitors and entry to barriers etc. can further segment based on how their audience members feel about the brand or how they use social media.
5. Limitations and Further Research
The study has several limitations that must be considered. First, the sampling frame was limited to only one social media platform, “Twitter” so the observations may be limited due to the wide variety of social media platforms (Facebook, LinkedIn or Instagram) of seaports. Second, the content analysis or other qualitative methods may be carried out in order to explore the interrelationships of services between the competing ports.
A future threat in employing sentiment analysis and tools for sentiment analysis of tweets in social media is to reduce the uncertainty that illustrates a specific problem since it is not efficiently pick up the information. Naturally, the analysed tweets include paradox and contempt, which are not easy to detect. Therefore, an assessment of the analysis and tools is needed to solve this limitation.
Regarding future branding strategy research, this study would advocate collaborative investigations across several research streams identified in the literature review. Many pragmatic approaches could study the general or specific subtopics of the phenomenon. An interconnection of research streams would make a valuable contribution to future research. Future studies could
101
explore whom to address, with which kind of branding messages are chosen, how different branding messages should be placed in their buying behaviours among other industries.
References
Aaker, D.A. (1992). The value of brand equity. Journal of Business Strategy, 4(13), 27-32. Abbasi, A., Chen, H., & Salem, A. (2008). Sentiment analysis in multiple languages: Feature
selection for opinion classification in web forums. ACM Transactions on Information
Systems (TOIS), 26(3), 1-34.
Alessia, D., Ferri, F., Grifoni, P., & Guzzo, T. (2015). Approaches, tools and applications for sentiment analysis implementation. International Journal of Computer Applications,
125(3).
Agerri, R., & García-Serrano, A. (2010). Q-WordNet: Extracting Polarity from WordNet Senses.
Proceedings of the LREC, 2300-2305.
Baccianella, S., Esuli, A., & Sebastiani, F. (2010). Sentiwordnet 3.0: An enhanced lexical resource for sentiment analysis and opinion mining. Proceedings of the LREC, 10, 2200-2204.
Barnes, N. G., Leschault, A. M., & Andonian, J. (2012). Social media surge by the 2012 Fortune
500: Increase use of blogs, Facebook, Twitter and more. Retrieved from
http://www.umassd.edu/cmr/socialmedia/2012fortune500/
Benamara, F., Cesarano, C., Picariello, A., Recupero, D. R., & Subrahmanian, V. S. (2007). Sentiment analysis: Adjectives and adverbs are better than adjectives alone. Proceedings
of the ICWSM, 3, 1-7.
Berger, J., & Milkman, K. L. (2012). What makes online content viral?. Journal of Marketing
Research, 49(2), 192-205.
Bollegala, D., Weir, D., & Carroll, J. (2012). Cross-domain sentiment classification using a sentiment sensitive thesaurus. IEEE Transactions on Knowledge and Data Engineering,
25(8), 1719-1731.
Cawsey, T., & Rowley, J. (2016). Social media brand building strategies in B2B companies.
Marketing Intelligence & Planning, 34(6), 754-776.
Chen, Y., Fay, S., & Wang, Q. (2011). The role of marketing in social media: How online consumer reviews evolve. Journal of interactive marketing, 25(2), 85-94.
Dennis, A. R., Fuller, R. M., & Valacich, J. S. (2008). Media, tasks, and communication processes: A theory of media synchronicity. MIS Quarterly, 32(3), 575–600.
De Vries, L., Gensler, S., & Leeflang, P. S. (2012). Popularity of brand posts on brand fan pages: An investigation of the effects of social media marketing. Journal of Interactive
Marketing, 26(2), 83-91.
Duncan, T., & Moriarty, S. (1998). A communication based marketing model for managing relationships. Journal of Marketing, 62(2), 1–13.
Emarketer. (2010). Complimentary eMarketer Report: Seven guidelines for achieving ROI from
social media. Retrieved from
http://www.emarketer.com/blog/index.php/complimentary-emarketer-report-guidelines-achieving-roi-social-media/#qLcSBtK2HzEdrxHA.99
Erşahin, B., Aktaş, Ö., Kilinc, D., & Erşahin, M. (2019). A hybrid sentiment analysis method for Turkish. Turkish Journal of Electrical Engineering & Computer Sciences, 27(3), 1780-1793.
Esuli, A., & Sebastiani, F. (2006). Sentiwordnet: A publicly available lexical resource for opinion mining. Proceedings of the LREC, 6, 417-422.
Jansen, B. J., Zhang, M., Sobel, K., & Chowdury, A. (2009). Twitter power: Tweets as electronic word of mouth. Journal of the American Society for Information Science and Technology,
60(11), 2169–2188.
Godey, B., Manthiou, A., Pederzoli, D., Rokka, J., Aiello, G., Donvito, R., & Singh, R. (2016). Social media marketing efforts of luxury brands: Influence on brand equity and consumer behavior. Journal of Business Research, 69(12), 5833-5841.
Hatzivassiloglou, V., & Wiebe, J. M. (2000). Effects of adjective orientation and gradability on sentence subjectivity. Proceedings of the 18th Conference on Computational linguistics, 1, 299-305.
Hu, M., & Liu, B. (2004). Mining and summarizing customer reviews. Proceedings of the Tenth
ACM SIGKDD International Conference on Knowledge Discovery and Data Mining,
168-177.
Farquhar, P. H. (1989). Managing brand equity. Marketing Research, 1, 24-33.
Kalampokis, E., Karamanou, A., Tambouris, E., & Tarabanis, K. A. (2016). Applying brand equity theory to understand consumer opinion in social media. J. UCS, 22(5), 709-734. Kamps, J., Marx, M., Mokken, R. J., & De Rijke, M. (2004). Using WordNet to measure
semantic orientations of adjectives. Proceedings of the LREC, 4, 1115-1118.
Karjaluoto, H., Ulkuniemi, P., Huotari, L., Saraniemi, S., & Mäläskä, M. (2015). Analysis of content creation in social media by B2B companies. Journal of Business & Industrial
Marketing, 6(30), 761–770
Keller, K. L. (1993). Conceptualizing, measuring, and managing customer-based brand equity.
Journal of Marketing, 57(1), 1-22.
Keller, K. L. (2009). Building strong brands in a modern marketing communications environment. Journal of Marketing Communications, 15(2–3), 139–155.
Kim, S. M., & Hovy, E. (2004). Determining the sentiment of opinions. Proceedings of the 20th
international conference on Computational Linguistics, 1 – 8.
Kietzmann, J. H., Hermkens, K., McCarthy, I. P., & Silvestre, B. S. (2011). Social media? Get serious! Understanding the functional building blocks of social media. Business
Horizons, 54(3), 241-251.
Krippendorff, K. (2004). Content analysis: An introduction to its methodology (2nd ed.) Thousand Oaks, CA: Sage Publications.
Kumar, V., & Mirchandani, R. (2012). Winning with data: Increasing the ROI of social media marketing. MIT Sloan Management Review, 54(1), 55–61.
Lai, C. S., Chiu, C. J., Yang, C. F., & Pai, D. C. (2010). The effects of corporate social responsibility on brand performance: The mediating effect of industrial brand equity and corporate reputation. Journal of Business Ethics, 95(3), 457-469.
Labrecque, L. I., Zanjani, S. H., & Milne, G. R. (2012). Authenticity in online Communications. In Online consumer behavior: Theory and research in social media, advertising, and
e-tail (pp. 133-155). Cham: Springer.
Leone, R. P., Rao, V. R., Keller, K. L., Luo, A. M., McAlister, L., & Srivastava, R. (2006). Linking brand equity to customer equity. Journal of Service Research, 9(2), 125-138.
103
Li, S., Xue, Y., Wang, Z., & Zhou, G. (2013). Active learning for cross-domain sentiment classification. Proceedings of the Twenty-Third International Joint Conference on
Artificial Intelligence. Beijing, 2127-2133
Liu, B. (2012). Sentiment analysis and opinion mining. Synthesis Lectures on Human Language
Technologies, 5(1), 1-167.
Liu, S., Li, F., Li, F., Cheng, X., & Shen, H. (2013). Adaptive co-training SVM for sentiment classification on tweets. Proceedings of the 22nd ACM International Conference on
Information & Knowledge Management, 10, 2079-2088.
Mahajan, V., Rao, V. R., & Srivastava, R. K. (1994). An approach to assess the importance of brand equity in acquisition decisions. Journal of Product Innovation Management, 11(3), 221-235.
Meng, X., Wei, F., Liu, X., Zhou, M., Xu, G., & Wang, H. (2012). Cross-lingual mixture model for sentiment classification. Proceedings of the 50th Annual Meeting of the Association
for Computational Linguistics, 7, 572-581.
Michaelidou, N., Siamagka, N. T., & Christodoulides, G. (2011). Usage, barriers and measurement of social media marketing: An exploratory investigation of small and medium B2B brands. Industrial Marketing Management, 40, 1153–1159.
Moe, W. W., & Trusov, M. (2011). The value of social dynamics in online product ratings forums. Journal of Marketing Research, 48(3), 444-456.
Moilanen, K., Pulman, S., & Zhang, Y. (2010). Packed feelings and ordered sentiments: Sentiment parsing with quasi-compositional polarity sequencing and compression.
Proceedings of the WASSA Workshop at ECAI, 8, 36-43.
Mohammad, S., Dunne, C., & Dorr, B. (2009). Generating high-coverage semantic orientation lexicons from overtly marked words and a thesaurus. Proceedings of the 2009
Conference on Empirical Methods in Natural Language Processing, 2, 599-608.
Mueller, K., Garg, S., Nam, J. E., Berg, T., & McDonnell, K. T. (2011). Can computers master the art of communication?: A focus on visual analytics. IEEE Computer Graphics and
Applications, 31(3), 14-21.
Nakov, P., Ritter, A., Rosenthal, S., Sebastiani, F., & Stoyanov, V. (2016). SemEval-2016 task 4: Sentiment analysis in Twitter. Proceedings of the 10th International Workshop on
Semantic Evaluation (SemEval-2016), 5, 1-18.
Netzer, Y., Tenenboim-Weinblatt, K., & Shifman, L. (2014). The construction of participation in news websites: A five-dimensional model. Journalism Studies, 15(5), 619-631.
Pan, S. J., Ni, X., Sun, J. T., Yang, Q., & Chen, Z. (2010). Cross-domain sentiment classification via spectral feature alignment. Proceedings of the 19th international conference on World
Wide Web, 4, 751-760.
Pang, B., & Lee, L. (2004). A sentimental education: Sentiment analysis using subjectivity summarization based on minimum cuts. Proceedings of the 42nd Annual Meeting on
Association for Computational Linguistics, 7, 271.
Popescu, A. M., & Etzioni, O. (2007). Extracting product features and opinions from reviews. In
Natural language processing and text mining (pp. 9-28). London: Springer.
Rapp, A., Beitelspacher, L. S., Grewal, D., & Hughes, D. E. (2013). Understanding social media effects across seller, retailer, and consumer interactions. Journal of the Academy of
Spire Inc. (2018). Spire Reports 2018. Prnewswire web sitesinden erişildi: https://www.prnewswire.com/news-releases/spire-reports-2018-results-300750871.html Socher, R., Perelygin, A., Wu, J., Chuang, J., Manning, C. D., Ng, A. Y., & Potts, C. (2013).
Recursive deep models for semantic compositionality over a sentiment treebank.
Proceedings of the 2013 Conference on Empirical Methods in Natural Language Processing, 1631-1642.
Strapparava, C., & Valitutti, A. (2004). Wordnet affect: an affective extension of wordnet.
Proceedings of the LREC, 4, 1083-1086.
Strapparava, C., Valitutti, A., & Stock, O. (2006). The affective weight of lexicon. Proceedings
of the LREC, 5, 423-426.
Swani, K., Brown, B. P., & Milne, G. R. (2014). Should tweets differ for B2B and B2C? An analysis of Fortune 500 companies' Twitter communications. Industrial Marketing
Management, 43(5), 873-881.
Taylor, D. G., Lewin, J. E., & Strutton, D. (2011). Friends, fans, and followers: Do ads work on social networks? How gender and age shape receptivity. Journal of Advertising Research,
51(1), 258–275.
Tirunillai, S., & Tellis, G. J. (2012). Does chatter really matter? Dynamics of user-generated content and stock performance. Marketing Science, 31(2), 198-215.
Wan, X. (2012). A comparative study of cross-lingual sentiment classification. Proceedings of
the 2012 International Conferences on Web Intelligence and Intelligent Agent Technology, 1, 24-31.
Wan, X. (2009). Co-training for cross-lingual sentiment classification. Proceedings of the Joint
Conference of the 47th Annual Meeting of the ACL and the 4th International Joint Conference on Natural Language Processing of the AFNLP, 1, 235-243.
Wiebe, J., Wilson, T., Bruce, R., Bell, M., & Martin, M. (2004). Learning subjective language.
Computational Linguistics, 30(3), 277-308.
Wiersema, F. (2013). The B2B agenda: The current state of B2B marketing and a look ahead.
105
APPENDIX 1: Top Container Ports (Container Throughput per year)
No Port Name Country Tweeter Accounts
1 Shanghai China Not Available
2 Singapore Singapore MPA_Singapore
3 Shenzen China Not Available
4 Ningbo-Zhoushan China Not Available
5 Hong Kong China Not Available
6 Busan South Korea PortOfBusan
7 Guangzhou China Not Available
8 Qingdao China QDPort
9 Dubai UAE DP_World
10 Tianjin China Not Available
11 Rotterdam Netherlands PortOfRotterdam
12 Port Klang Malaysia pkamalaysia
13 Kaohsiung China Not Available
14 Antwerp Belgium PortofAntwerp
15 Dalian China Not Available
16 Xiamen China Not Available
17 Tanjung Pelepas Malaysia PTPMalaysia
18 Hamburg Germany PortofHamburg
19 Los Angeles USA PortofLA
20 Long Beach USA portoflongbeach
21 Laem Chabang Thailand Not Available
22 New York/New Jersey USA PANYNJ
23 Yingkou China Not Available
24 Ho Chi Minh City Vietnam Not Available 25 Bremen/Bremerhaven Germany Not Available 26 Tanjung Priok Malaysia IPCTanjungPriok
27 Colombo Sri Lanka Not Available
28 Lianyungang China Not Available
29 Tokyo Japan tocho_kouwan_en
30 Valencia Spain AutPortValencia
31 Algeciras Spain PuertoAlgeciras
32 Jawarharlal Nehru India JNPort
33 Jeddah Saudi Arabia jeddahport
34 Sharjah UAE Not Available
35 Felixstowe United Kingdom felixstowe_port
36 Manila Philippines phports
37 Port Said Egypt Not Available
38 Santos Brazil Not Available
39 Taicang China Not Available
40 Savannah USA GaPorts
41 Colon Panama Not Available
42 Seattle/Tacoma USA PortofSeattle
43 Dongguan/Humen China Not Available
44 Piraeus Greece Not Available
45 Ambarlı Turkey Not Available
46 Tanjung Perak Indonesia Not Available
47 Balboa Panama HutchisonPPC
48 Marsaxlokk Malta Not Available
49 Vancouver Canada PortVancouver
50 Tanger Med Morocco tangermed.ma
51 Nanjing China Not Available
53 Rizhao China Not Available
54 Yokohama Japan yokohamaportypc
55 Keelung Taiwan Not Available
56 Durban South Africa TransnetNPA
57 Kobe Japan Not Available
58 Nagoya Japan Not Available
59 Melbourne Australi PortofMelbourne
60 Cartagena Colombia PuertodeCtg
61 Salalah Oman port_salalah
62 Le Havre France Not Available
63 Virginia USA PortofVirginia
64 Gioia Tauro Italy Not Available
65 Yantai China Not Available
66 Manzanillo Mexico Not Available
67 Yeosu Gwangyang South Korea Not Available
68 Incheon South Korea Not Available
69 Sydney Autsralia Not Available
70 Oakland USA PortofOakland
71 Genoa Italy portodigenova
72 Osaka Japan Not Available
73 London United Kingdom LondonPortAuth
74 Houston USA Port_Houston
75 Fuzhou China Not Available
76 Chittagong Bangladesh Not Available
77 Qanzhou China Not Available
78 Charleston USA SCPorts
79 Barcelona Spain portdebarcelona
80 Karachi Pakistan kpt1887
81 Dammam Saudi Arabia MawaniKSA
82 Callao Peru Not Available
83 Southampton United Kingdom ABPSouthampton
84 Dandong China Not Available
85 Guayaquail Equador PuertoGye
86 St Peterburg Russia Not Available
87 Shahid Rajaee Iran Not Available
88 Alexandria Egypt AlexandriaPort
89 Kingston Jamaica PortAuthorityJ
90 Zeebrugge Belgium Port_Zeebrugge
91 Chennai India PortofChennai
92 Bangkok Thailand Not Available
93 Lagos Nigeria nigerianports
94 Tangshan China Not Available
95 Abu Dhabi UAE AbuDhabiPorts
96 Mersin Turkey Not Available
97 Taichung Taiwan Not Available
98 Montreal Canada PortMTL
99 Freeport Bahamas Not Available
100 Buenos Aires Argentina PuertoBsAs