YAŞAR UNIVERSITY
GRADUATE SCHOOL OF NATURAL AND APPLIED SCIENCES
MASTER THESIS
POWER QUALITY ANALYSIS ON ISLANDING MODE AT COGENERATION SYSTEMS
IRMAK ÖNAL KORKUT
Thesis Advisor: Asst. Prof. Dr. Hacer ŞEKERCİ
Department of Electric and Electronics Engineering
Presentation Date: 09.06.2016
ABSTRACT
POWER QUALITY ANALYSIS ON ISLANDING MODE AT COGENERATION SYSTEMS
Önal Korkut, Irmak
MSc, in Electrical and Electronics Engineering Supervisor: Asst. Prof. Dr. Hacer ŞEKERCİ ÖZTURA
May 2016, 54 pages
The rate of population growth and industrialization in developing countries bring the energy requirements. Limited and finite resources provide search of new energy sources. Because the amount of required energy is high, the foundation of new sources also necessiate the usage of these in an efficient and sustainable way.
Unlike other energy sources, cogeneration systems are efficient systems in terms of thermodynamics. The plant on which measurement data is taken is a cogeneration plant at islanding mode. The cogeneration systems convert energy to another energy form, and it is realized without any loss in the system. Besides, in case of any problems, the system with its feeding loads works independently form interconnected system by employing a protection scheme called as islanding which is a kind of self protection. The system is mostly affected by voltage /current failures when running in parallel or island mode.
In the first part of this study, the investigations are made on the cogeneration system running at both islanding mode and grid-parallel operation. Resulting fault data are investigated in terms of several parameters such as harmonic, voltage drop and voltage rise. Harmonic analysis is made by using both Fourier Transform and Short Time Fourier Transform in both islanding and grid condition cases. As voltage sag and swells of the power quality parameters are analyzed with Wavelet Analysis, the analysis outputs are used to form feature vectors.
In the second part of the study, the classification of power quality parameters is done. The feature vector which will be used for classification is extracted for each energy level of Discrete Wavelet Transform by using the statistical methods such as entropy, mean and standard deviation. An Artificial Neural Network model is used for the classification of power quality in order to make diagnosis of failure in power quality. Classification results are obtained as the result of the pattern recognition process.
Keywords: Power quality, Wavelet analysis, Feature extraction, Classification, Artificial neural networks, Pattern recognition
ÖZET
KOJENERASYON SİSTEMİNDE ADA MODUNDA ÇALIŞAN SİSTEMİN GÜÇ KALİTESİ ANALİZİ
Önal Korkut, Irmak
Yüksek Lisans, Elektrik Elektronik Mühendisliği Bölümü Tez Danışmanı: Yard. Doç. Dr. Hacer ŞEKERCİ ÖZTURA
Mayıs 2016, 54 sayfa
Gelişmekte olan ülkelerdeki nüfus artışı ve sanayileşme oranı, enerji gereksinimlerini de beraberinde getirmektedir. Kaynakların kısıtlı ve sonlu olması, yeni enerji kaynakları arayışı gerekmektedir. Gerekli olan enerji miktarı yüksek olduğundan, yeni kaynakların bulunması, ayrıca bu kaynakların verimli ve sürdürülebilir olacak şekilde kullanılmasını da zorunlu kılmıştır.
Kojenerasyon sistemleri diğer enerji kaynaklardan farklı olarak termodinamik açıdan verimli bir sistemlerdir. Ölçüm alınan tesis, ada modunda çalışan bir kojenerasyon sistemidir. Kojenerasyon sistemleri, enerjiyi başka bir enerji formuna dönüştürür ve bunun sistemde herhangi bir enerji kaybı olmadan verimli bir şekilde gerçekleştirir.
Ayrıca, herhangi bir problem durumunda, sistem kendi beslediği yüklerle birlikte kendini bir çeşit koruma modunu da olan ada modu kullanarak enterkonnekte sistemden bağımsız çalışır. Sistem ada modunda ya da şebekeye paralel çalıştığında çoğu zaman akım / gerilim değişimlerinden etkilenir.
Bu çalışmanın ilk kısmında kojenerasyon sisteminde ada modu ve şebekeye paralel çalışma durumunda iken incelemeler yapılmıştır. Oluşan arıza verileri harmonik, gerilim düşümü ve gerilim yükselmesi parametreleri açısından incelenmiştir. Harmonik analizi, hem ada durumunda hem de şebekeye paralel çalışma durumunda Fourier ve Kısa
yükselmeleri, Dalgacık Metoduyla analiz edilmiş olup, analiz çıktıları öznitelik vektörlerini oluşturmak için kullanılmıştır.
Çalışmanın ikinci kısımda ise güç kalitesi parametrelerinin sınıflandırması yapılmıştır. Sınıflandırma yapabilmek için gerekli olan öznitelik vektörü, Kesikli Dalgacık Dönüşümünün her bir enerji seviyesi için entropi, ortalama ve standart sapma gibi istatiksel veriler kullanılarak oluşturulmuştur. Güç kalitesi arızalarının teşhisi için sınıflandırmada Yapay Sinir Ağı modeli kullanılmıştır. Örüntü tanıma işlemi sonucunda doğru sınıflandırma sonuçları çıkmıştır.
Anahtar Sözcükler: Güç Kalitesi, Dalgacık Analizi, Öznitelik Çıkarımı, Sınıflandırma, Yapay Sinir Ağları, Örüntü tanıma
ACKNOWLEDGEMENTS
At the end of my thesis I would like to thank all those people who made this thesis possible and an unforgettable experience for me.
First of all, I would like to express that the preparation of this thesis owes several debts of gratitude to my supervisor Asst. Prof. Dr. Hacer Sekerci Oztura, who help me with much concerned, offered her continuous advice, patience and encouragement throughout the course of this thesis.
I am heartly thank to Asst. Prof. Dr. Nalan Ozkurt and Assoc. Prof. Dr. Mustafa Secmen for their concerned of me and encouragement. While they are very busy with their daily tasks, they have always been available to answer my questions. It would not be possible to finish this work without them.
I am thankful to my colleagues who encouraged me and always boosted me to do and finish the work.
Also, I am thankful to Ahmet Ozenir and Okan Tunc. They were shared their precious time and knowledge with me.
Finally, I take this opportunity to express the profound gratitude from my deep heart to my beloved parents and my family who stood by me for their love, continuous support and extended belief in me both spiritually and materially.
Irmak Onal Korkut
TEXT OF OATH
I declare and honestly confirm that my study, titled “Power Quality Analysis on Islanding Mode at Cogeneration Systems” and presented as a Master’s Thesis, has been written without applying to any assistance inconsistent with scientific ethics and traditions, that all sources from which I have benefited are listed in the bibliography, and that I have benefited from these sources by means of making references.
TABLE OF CONTENTS
Page
ABSTRACT iii
ÖZET v
ACKNOWLEDGEMENTS vii
TEXT OF OATH viii
TABLE OF CONTENTS ix
INDEX OF FIGURES xii
INDEX OF TABLES xiii
INDEX OF SYMBOLS AND ABBREVIATIONS xiv
1INTRODUCTION 1
1.1 Subject of the Thesis 1
1.2 Context of the Thesis 3
2COGENERATION SYSTEMS AND POWER QUALITY 5
2.1 Cogeneration Systems 5
Types of Cogeneration 7
Islanding of Cogeneration 7
Events and Variations 8 3POWER QUALITY DETECTION AND CLASSIFICATION BASED ON
WAVELET ANALYSIS 10
3.1 Power Quality Detection Methods 10
Fourier Transfrom 10
Short Time Fourier Transform 11
Wavelet Transform 12
3.2 Classification Methods for Power Quality Disturbances 16
Feature Extraction Based Wavelet Transform 16
4METHODOLOGY 20
4.1 Overview of the Plant 20
4.2 Harmonic Analysis 21
4.3 Detection of Sag and Swell 26
4.4 Feature Extraction Based on Wavelet Transform 28
4.5 Classification of Parameters 30
5CONCLUSION AND FUTURE WORK 32
5.1 FUTURE WORK 32
INDEX OF FIGURES
Page
Figure 2.1 Comparison of Conventional and CHP Plant (Cogen,2016) 6 Figure 2.2 Islanding of the Cogeneration Plant (Mozina,2008) 8
Figure 3.1 Various Time-Frequency Representation of any signal (a) The signal in time domain, (b) The signal in frequency domain with Fourier Transform, (c) The signal in time – frequency representation with Short Time Fourier Transform (d) Wavelet analysis
the signal (Matworks) 12
Figure 3.2 Daubechies Wavelet Family (Matworks) 15
Figure 4.1 Single Line Diagram of Cogeneration Plant 20
Figure 4.2 Islanding Raw data at PCC (a) Current Signal (b) Voltage Signal 22 Figure 4.3 Fourier Spectrum and Spectogram of Grid Voltage (a) Fourier Transform, (b)
Spectogram 23
Figure 4.4 On Grid Raw data at PCC (a) Current Signal (b) Voltage signal 24 Figure 4.5 Fourier Spectrum and Spectogram of grid voltage (a) Fourier Transform (b)
Spectogram 25
Figure 4.6 Scalogram Demonstration of Wavelet Transform on Islanding Mode 27
I N D E X O F T A B L E S P a g e Table 4.1 Raw Data of
Disturbanced Voltage Data at PCC by Year
2 1 Table 4.2 Energy Levels of Each
Decomposition Level For Different Operating Mode 29
Table 4.3 Mean and Variance of Each Decomposition Level For Islanding Mode 30 T a b l e 4 . 4 C o n f u s i o n M a t r i x 3 1
INDEX OF SYMBOLS AND ABBREVIATIONS Symbols Explanations w(t) Window function x(t) Signal to be analyzed a Dilation coefficient b Translation coefficient
, ( ) Dilated and translated mother wavelet
µ Mean
EA Energy of approximation coefficient
ED Energy of detailed coefficient
² Standard deviation
Abbreviations
ANN Artificial Neural Network
CHP Combined Heat Power
CWT Continuos Wavelet Transform
Db Daubechies Family
DG Distributed Generation
DWT Discrete Wavelet Transform
FL Fuzzy Logic G1 Generator 1 G2 Generator 2 L1 Load 1 L2 Load 2 L3 Load 3 L4 Load 4
PCC Point of Common Coupling
PNN Probabilistic Neural Network
PQ Power Quality
RBFNN Radial Basis Function Neural Network
RVM Relevance Vector Machine
STFT Short Time Fourier Transform
SVM Support Vector Machine
1 INTRODUCTION
1.1 Subject of the Thesis
At the last years, the structure of industry and demands of electricity have increased rapidly. According to International Energy Agency report, energy efficiency plays a critical role in limiting world energy demand growth to one-third by 2040, while the global economy grows by 150%. In order to meet the challenges of the future, to continue to maintain stable, reliable and efficient systems, new technologies have developed. Firstly, the electric utility industry reconstructs their structure. Today’s outlook demonstrates to emerge of number of new generation techniques. It is also supported by government public policies (Glover et al. 2008).
One of the new generation technologies is the distributed generation (DG) which can be described simply as a small scale generator. DG is used to provide power for demanding customers (El-Khattam.and Salama, 2004). Generally, we can categorize DG technologies as renewable and nonrenewable. Renewable technologies usage is wind, solar, biomass, biogas, geothermal and ocean. Nonrenewable technologies are internal combustion engine, combined cycle, combustion turbine, micro turbines and fuel cell (Glover et al. 2008). DGs are classified by their constructional and technological parts. DG type is chosen by making decision which is more suitable in the system (El-Khattam and Salama, 2004). DGs can also be classified according to their different types and operating technologies. Capacity of DGs change between kW to MW.
In distribution system, distributed generation has many benefits. These can be examined by economical and by operational point of view. In terms of economy, distributed generations can reduce the wholesale power price by suppling power to the grid, which leads to reduction of the demand required. Also, DGs have proper sizes to be installed in small increments to provide the exact required customer load demand. Besides DGs can be installed easily anywhere as modules which can be set up in a very short time and the total capacity can be increased or decreased by adding or removing
more modules, respectively. In addition, DGs increase the system equipment, transformers, and provide fuel savings. From the point of view of operational impact DGs have a positive effect on the distribution system voltage profile and power quality problems. Since DGs can reduce the distribution network power losses, distribution loads requirements by supplying some of the distribution load demand (El-Khattam and Salama, 2004).
The subject of this thesis is the disturbance signal detection and classification of power quality parameters in DGs. Harmonics in the system and disturbance signal type have an important role in power quality analysis. PQ disturbances might effect economically customers/users of modern power industry. New power electronics based devices can be used to mitigate these PQ disturbances. Therefore, disturbances in power systems should be detected, classified and analyzed with certain accuracy. The number of studies related with the applications of Wavelet Transform in these devices has been increasing.
In this part of the study, publications which use the wavelet analysis and power quality detected signa classification are examined. This study focusses on wavelet-based analysis of power quality disturbances.
Assesing power quality events is the basic issue for recognition of the event problems. In order to make detection and classification, many studies are done. Defining the problem and understanding the causes and effects of power disturbances have high impact on customers and individual users (Douglas, 1993). After problem definition, many different approaches used with using WT in PQ events. PQ disturbance data compression using Wavelet Transform methods are mentioned by Santoso et al (1997). Also, Karimi et al (2000) studied the detection of the voltage disturbances based on WT.
In this thesis, Db4 mother wavelet is used. In literature, mother wavelet Db4 is observed for detection of PQ events (Lachman et al, 2010). Sushama et al (2010) are
also used Db4 wavelet for detection of PQ disturbances. Because of the flexibility of its order, db4 is most largely applied in power quality applications.
A new method of under voltage detection is applied by Gencer et al., (2010). The algorithm based on WT is used to detect the duration and the magnitude of the voltage sag. For classification of disturbance signals, many features are used. In literature using with entropy of signal in WT for disrupted signal is improved by Uyar et al. (2008) with using Db4 for 12 levels. It performs feature extraction and classification algorithm. DWT is the Discrete Wavelet Transform which divided the signal into detail and approximation coefficients is used to detect instanteneous changes in the voltage signals. WT is used to reformulate the recommended PQ and analyzing accurately nonstationary waveforms (Morsi et al., 2010). Also S. Chen, (2005) studied feature selection for identification and classification of power quality disturbances. Besides, Zwe-Lee Gaing et al., (2003) are worked on wavelet-based probabilistic neural network for power disturbance recognition and classification. S. Santoso et al. (2000) worked on power quality disturbance waveform recognition using wavelet-based methods.
The aim of this thesis is to accurately detect the power quality parameters by using some signal processing methods and classify them. All raw data has collected from 2007 to 2015. Harmonic analysis is done by using Fast Fourier Transform and Short Time Fourier Transform. Sag and swell detection is done by Wavelet Transform. After this analysis, feature extraction is done by statistical methods. For classification, feature vectors are used in a Neural Network-based classifer.
1.2 Context of the Thesis
A detailed literature search will be given that includes the recent studies. The details of the materials and methods used in the thesis will be explained. For example, to find harmonics, we used some signal processing thecniques such as Fast Fourier Transform and Short Time Transform, and to do feature extraction statisctical techniques are used such as energy levels, mean and variance of detailed coefficents of wavelet transform. Applications and results are also demonstrated with graphs and
tables for time frequency representations with details and also necessary formulations, analytical/simulation data and measurement results will be also given. All results and graphical data are presented and the work planned for the future will be discussed briefly.
This thesis is composed of 5 chapters. Chapter 2 explains the cogeneration systems and power quality and their relationship between power systems. Chapter 3 presents the classification of power quality, based on Wavelet Analysis of disturbance signal. Also, this chapter explains the detection of the parameters, obtain feature vectors and then classification. Chapter 4 explains the methodology which includes signal processing methods and classification of the signals. Chapter 5 presents conclusion and future work of the thesis.
2 COGENERATION SYSTEMS AND POWER QUALITY
2.1 Cogeneration Systems
The structure of industry and increasing of consumption electrical energy have increased day by day. Because of expanding, power generation covered large-scale areas and they could supply electricity to large industrial consumers at affordable prices. For this reason, new systems are found a way to solve problems. The system must be solved the efficiency problems and losses. Industrial plants import cogeneration systems in their systems. But distributed generation systems are affected by voltage quality problems. As a result of voltage quality problems, some issues such as equipment failure or malfunctioning, equipment lifetime reduction, damage sensitive equipment, etc. are occurred. According to the official gazette of Electricity Market Customer Services Requlations published in 8 may 2014, the provide for the faults emerging from abrupt voltage decreasing and increasing occurring in the places such as plant, house is done by distribution companies. Reducing the quality problems, is the significant issue for the system operation. Power quality features will describe in Chapter 3.
Cogeneration which is a type of distributed energy source is the simultaneously generation of two types of energies which are thermal energy in the form of steam and electrical energy. Cogeneration, also known as Combined Heat and Power (CHP) extends from 25 MW up to 500 MW.
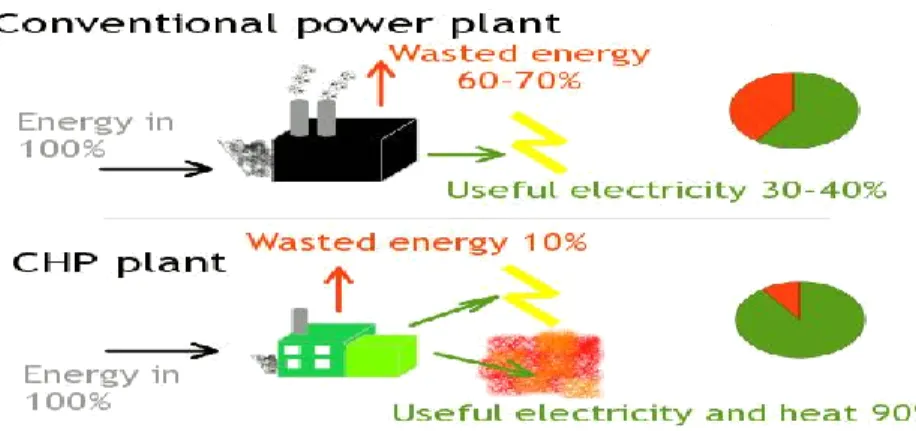
A cogeneration installation at an industrial plant will reduce transmission losses, and make heat available that would otherwise be lost. Because of this reason, plants prefer cogeneration systems. The comparison of conventional plant and CHP plant is represented in Figure 2.1. The system’s overall efficiency can reach 90% which is useful electricity and heat operating. Basic purpose of the cogeneration system is the energy production and achieving lower operating costs.
Figure 2.1 Comparison of Conventional and CHP Plant (Cogen,2016)
Cogeneration optimizes the energy supply to consumer who need steam. Since power generation form of cogeneration is the most effective and efficient, efficiency of energy conversion and usage are increased. Cogeneration has the important role of lower emissions to the environment. Because of cost savings, providing competitiveness between industrial and commercial users and offering affordable heat for domestic users. Decentralized forms of electricity generation where plants are installed to meet needs of customers is provided both avoiding transmission losses and increasing flexibility of system use. Local generation, cogeneration system, can minimize the risk of consumers has out of energy both electricity and/or heating. In addition, the decreased necessity for fuel is concluded cogeneration reduces import dependency (Cogen, 2016).
On the other hand, cogeneration systems have some disadvantages. Because the technology is more expensive, first investment requires more money. Maintenance have also been costly for CHP.
A cogeneration plant has four major elements. These are a prime mover (engine), an electricity generator, a heat recovery system, and a control system. Generally, in the process of the cogeneration, the fuel is used to generate electricity and this electricity produced heat. Heat is used to boil water to produce steam simultaneously which means that boiler turned it into thermal energy.
Types of Cogeneration
Cogeneration systems are classified according to the use of energy. Firstly, it is classified as a topping or bottoming cycle. In topping cycle, electric power is generated by the prime mover as a first function and the thermal energy emitted by prime mover is then used for the plant. Topping cycle cogeneration is widely used in cogeneration systems. According to working principle of combined cycle topping system, prime mover emmited the fuel energy then it produced some of electrical energy by used generator and some of produced thermal energy by done heat recovery unit. In difference topping cycle, bottoming cycle where the electric power is generated from by product steam. In bottoming cycle, the primary fules produces high temperature thermal energy. Bottoming cycles are suitable for manufacturing processes as furnaces because high temperature heat is necessary.
Islanding of Cogeneration
A mode of operation is determined by the selection on which the adjustment of the electrical and useful thermal output of a cogeneration system. Generally, in terms of what for used is the criteria. In simple terms, operation mode is divided into two options. First is parallel grid mode. In parallel grid mode, distributed generation operates but at the same time the system is fed by utility. Second mode is islanding. In islanding mode, there is no connection with grid.
If the system mode change from parallel to island mode occurs suddenly, it can be possible for the system to continue to supply to the load without any failure. It can automatically/manually disconnect selected parts of the site load. If this cannot be achieved, then the cogeneration plant will usually shut down when there is a failure where it is in parallel mode (Tagare, 2011).
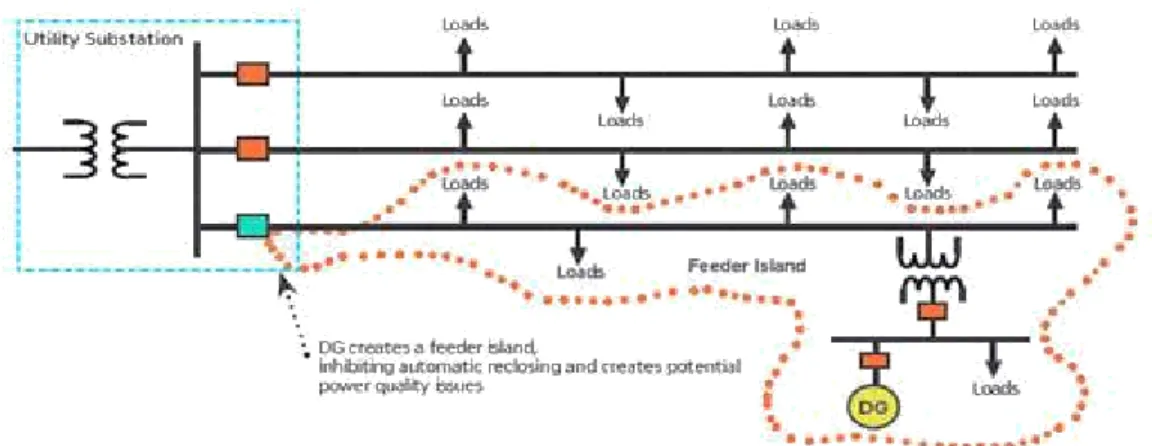
If there is a fault on the utility side, the tie line protection system separates the cogeneration system into island mode manually / automatically. As shown in Figure 2.2, DG can create its own island and synchronize to the utility.
Figure 2.2 Islanding of the Cogeneration Plant (Mozina,2008)
2.2 Description of Power Quality
Use of power electronic components and new technology systems are increased within distribution system. The disadvantage of this isthat each component on the system can be sensitive and can give failure that can cause some interruptions for end users. Even though several developments could be in power system, the protection of end-user’s system fall short of failures. Power quality is related to the performance of the power system (Bollen and Gu, 2006).
Events and Variations
An important portion of power quality disturbances is between variations and events. Variations are obtained in steady-state disturbances. Events are sudden disturbances with a beginning and an ending (Bollen and Gu, 2006).
Power frequency disturbances are caused voltage sags or swell. Source or load generated bring about faults or switching operations in a power system (Sankaran, 2002). In this thesis, sag, swell and harmonic research are done. When looked at sag event characterstics that are short-duration reductions in the rms voltage between 0.1 and 0.9 pu and it is usually between 0.5 cycles and 1 minute. Voltage sags are usually caused by energization of heavy loads (e.g., arc furnace), starting of large induction motors, single line-to-ground faults, and load transferring from one power source to
The increase of voltage magnitude between 1.1 and 1.8 pu is called swell. The most accepted duration of a swell is from 0.5 cycles to 1 minute. Swells are not as common as sags and their main causes are switching off of a large load, energizing a capacitor bank, or voltage increase of the unfaulted phases during a single line-to-ground fault (Funchs and Mosoum, 2008).
Power system harmonics are desciribed as waveform distortion, which introduces
harmonic frequency components. Voltage and current harmonics have undesirable effects on power system operation and power system components DG and PQ.
PQ was defined as quantifying the performance of equipment between the electricity grid and its customers. The interaction was further divided into voltage quality and current quality, referring to the way where the network impacts the customer and the way the customer impacts the network. When considering systems with large amounts of distributed generation, power quality becomes an important issue that requires a closer look.
DG is affected by the voltage quality in the same way as all other equipments are affected. An important difference between distributed generation and most industrial installations is that the incorrect tripping of the generator may pose a safety risk like damage electronic equipment. This should be taken into consideration when setting immunity requirements for the installations (Baggini, 2008).
PQ disturbances can affect the electrical signals which can damage equipment. Because of this reason, detecting disturbance signal is crucial for the improvement of power quality. Detecting signal methods can give an idea for classification of disturbance signal (Bollen and Gu, 2006).
3 POWER QUALITY DETECTION AND CLASSIFICATION BASED ON WAVELET ANALYSIS
3.1 Power Quality Detection Methods
It is well known that poor power quality lead to damage to the equipment. Signal processing which is a discipline is related to analyze signals using some techniques in order to extract useful information about signals. These methods can be used to comprehend poor power quality signals. Fourier Transform is the one of the techniques for detecting harmonics in signal processing. Also, STFT is the other harmonic analysis method both time and frequency domains simultaneously. Sag and swell representation is done by Wavelet Transform in this thesis.
Fourier Transfrom
Fourier’s theorem states that any periodic function x(t) may be decomposed into an infinite series of sine and cosine functions which are used for determining coefficients (Leis, 2011).
The transform is a way of a signal from time to frequency by decomposing the signal into several frequency components. Equation (3.1) represents the Fourier Transform equation.
+∞
(3.1)
( ) = ∫ ( ) − 2
−∞
where x(t) is the signal to be transformed in time t, complex exponential has real and imaginary of sinusoidal components.
Fourier analysis converts signal from time domain to frequency domain. However, Fast Fourier Transform (FFT) is used so as to rapidly compute to Fourier Transform (Leis, 2011). FFT is a faster version of Discrete Fourier Transform which
Short Time Fourier Transform
Fourier Transform gives information about the existence of a certain frequency component solely and does not say when a time event occurs. As a solution to this problem, the Short Time Fourier Transform (STFT) was proposed at 1946 by Denis Gabor.
STFT assumes that the signal is stationary (frequency spectrum does not change) in a narrow time window. Then STFT is obtained by applying the Fourier transform to the windowed signal using a fixed-sized, sliding window. Therefore, the signal is divided into several blocks of data and frequency spectrum of each portion are calculated individually. It is the sliding window which has time step and length, at every sliding window points, FFT analysis is applied (Polikar, 2001). STFT provides information about both when and where frequencies present with starting and ending position.
Mathematical expression is defined in Equation 3.2. In this formula ⍵(t) is the window function, commonly used Gaussian Window and x(t) is the signal to be transformed. X(τ, ⍵) is the Fourier Transform of x(t).⍵(t-τ).
+∞
( , ⍵) = ∫ ( ) ⍵( − ) − 2⍵ (3.2) −∞
The energy spectrum which is calculated by squaring the magnitude of STFT coeffcicients is called as spectrogram.
Window size selection is crucial issue for STFT. Wide window gives better frequency resolution but poor time resolution. Narrow window is exact opposite situation of wide window.
Wavelet Transform
Wavelet Transform appears to solve the fixed window size problem. It is a time-frequency analysis technique, which is quite suitable for nonstationary signals as in the electrical power network. It has wide range of application in power quality area.
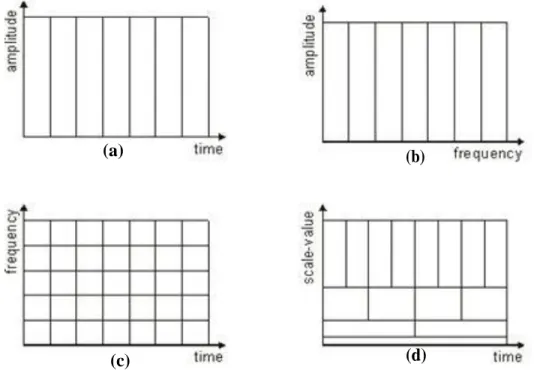
In contrast to those Fourier Transform-based approaches where a window is used uniformly for spread frequencies, a short window is used at high frequency and a long window at low frequency, and this results in an excellent monitoring of transient behavior and discontinuities in the signal. When there exists an instantaneous impulse disturbance occurring on the signal at a certain time interval, using wavelets, both time and frequency information of the disturbance can be obtained with high resolution as shown in Figure 3.1. These features make wavelet transform effective in signal analysis. (Ruijuan Jia and Chunxia, 2008).
(a) (b)
(c) (d)
Figure 3.1 Various Time-Frequency Representation of any signal (a) The signal in time domain, (b) The signal in frequency domain with Fourier Transform, (c) The signal in time – frequency representation with Short Time Fourier Transform (d) Wavelet analysis the signal (Matworks)
The common characteristic of STFT and WT is that both provide time-frequency analysis. The advantage of WT over STFT is that it uses a size adjustable window than the fixed window used by STFT.
Mathematically, wavelet is a function of zero average; having the energy concentrated in time defined in Equation 3.3.
+∞ (3.3)
∫ ( ) = 0
−∞
In order to have suitable resolution in time and frequency information, a family of wavelets are used as a function of (t), also known as the Mother Wavelet. Stretched and translated versions of the mother wavelet is defined in Equation 3.4. Extension is referred by the scale parameter a while translation is adjusted via b. Scaling is either expands or compresses a signal.
( ) = 1 ( − ) (3.4)
,
√
The Continuous Wavelet Transform (CWT) was developed as an alternative approach to the STFT to overcome the resolution problem (Polikar, 2001). But the difference is width of the window is changed. The CWT of a signal is expressed in Equation 3.5.
The output of the CWT is the CWT coefficients, which reflect the similarity between the analyzed signal and the wavelets. Also squares of the CWT coefficients can be computed and form a scalogram in MATLAB, which is analogous to the spectrogram in time-frequency analysis. In signal processing, scalograms are useful in pattern-matching applications and discontinuity detections. If a signal contains different scale characteristics over time, the scalogram can present a time-scale view of the signal, which is more useful than the time-frequency view of that signal.
∞
1 = √ ∫ ( ) ∗ , (3.5)
In practical application, DWT is used instead of CWT. DWT provides adequate information both analysis and synthesis of the original signal. Also, DWT has a significant role of reduction in the computation time. DWT and its implemention on a signal are given in Equation 3.6 and 3.7.
1 −
∗ ( ) = ( 0 0
) (3.6)
0
, √ 0
Where a0 and b0 are scaling and translation coefficients, respectively; m and n
shows the location of the wavelet coefficient in time scale plane. For this, set a=a0m
and b=nb0a0m. Tm,n is obtained as the detailed coefficients of DWT.
∞
= , = ∫ ( ) , ( ) (3.7)
−∞
The time and localization are the important features of wavelets. It makes it suitable for analysis of abrupt changes in the signal. The disturbance signal when subjected to DWT will generate a state which shows starting and ending points of the disturbance. Every filter takes half of sample with coefficients in each decomposition.
Mother Wavelet Selection
Having the limitations of the Fourier Transform and Short Time Fourier Transform,
Morlet gave in late 1970’s the formulation of Wavelet Transform. Later, numerous researchers have developed significant step of the wavelet transform theory such as Morlet, Mallat, Meyer, Haar, and Daubechies. Daubechies construct the orthogonal multi-resolution analysis, Mallat and Meyer’s concept are multi-resolution. The key points are selection of mother wavelet, scaling and shifting functions. In Wavelet analysis, different scaled versions of the mother wavelet are moved and correlation between the signal and that wavelet is calculated. In this way, wavelet coefficients are obtained. Scaling and shifting functions are the main point of WT (Daubechies, 1996).
The major decision for application of wavelet transform is to select mother wavelet. There are many mother wavelets such as Haar, Daubechies, Coiflets, Haar.
The differences between different mother wavelet functions depend on how these scaling signals. The choice of wavelet determines the final waveform shape.
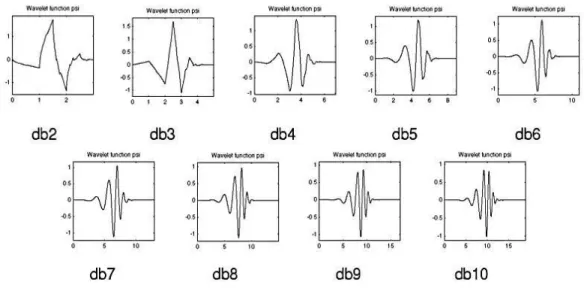
The choice of mother wavelet is different for each problem and can have a significant effect on the results obtained. Orthogonal wavelets ensure that the signal can be reconstructed from its transform coefficients. Unique pattern for each event is more important for capturing the disturbances. Daubechies covers the field of orthonormal wavelets. This family is very popular and includes many members. For short and fast transient disturbances, Daub4 and Daub6 wavelets are the best choice, while for slow transient disturbances, Daub8 and Daub10 are particularly good (Arrillaga and Watson, 2003). In Figure 3.2 some members of Daubechies family are shown. It is flexible as its order and db4 is most widely adopted in power quality applications.
Figure 3.2 Daubechies Wavelet Family (Matworks)
The choise of mother wavelet is significant for wavelet analysis of PQ events. It can effect the results which is used for PQ recognition system. In this thesis, the mother wavelet is selected as db4 because proper frequency response on disturbances and good capability to capture time of disturbances.
3.2 Classification Methods for Power Quality Disturbances
The existing techniques for identifying the power quality disturbance are based on the finding disturbances. Hence, findings are not enough to make a decision about signal type. Pattern recognition techniques are used for classification of disturbance signals. Pattern recognition is a process of classifying input data. It is reported in the literature that for the classification of PQ disturbance signals, pattern recognition uses various artificial intelligence techniques, such as artificial neural networks (ANN), Radial Basis Function Neural Network (RBFNN), Probabilistic Neural Network (PNN), Fuzzy logic (FL), Support Vector Machine (SVM) and Relevance Vector Machine (RVM).
Feature extraction of a disturbed signal provides information that helps to detect the fault for power quality disturbance. Features extracted from the signals are used as the input of a classification system instead of the raw data. Selecting a proper feature set is an important step for successful classification.
Feature Extraction Based Wavelet Transform
An Artificial Neural Network is an information processing method that originate by the way of biological nervous systems, such as the brain. The significant point is that can proceess the information. It is composed of a great number of interconnected processing elements, which is called as neurons, working in association to answer to the specific problems. An ANN is configured for a specific application, such as pattern recognition or data classification, through a learning process.
Field of machine learning and specifically the problem of statistical classification, a confusion matrix, is a specific table design that allows the visualization of the performance of an algorithm.
An important application of neural networks is pattern recognition. Pattern recognition can be implemented by using a feed-forward neural network that has been
trained accordingly. All the neurons in one layer are connected with neurons in the next layer. The hidden layer plays an important structure in a feed-forward network because of logical parameters. During training, the network is trained to correlate outputs with input patterns. When the network is used, it identifies the input pattern and tries to output the associated output pattern. The power of neural networks comes to life when a pattern that has no output associated with it, is given as an input. In this case, the network gives the output that corresponds to a taught input pattern that is least different from the given pattern.
Principal component analysis (PCA) is a popular technique for pattern recognition application. PCA is a statistical procedure for achieving correct prediction. The method generates a new set of variables. All the principal components are ortogonal to each other and each PCA is a linear combination of the original variables. PCA is mostly used as a tool for making predictive models. PCA carry out feature selection and can select a number of important feature vectors from all the feature components. PCA has been widely used in a variety of fields such as image processing, pattern recognition, data compression, data mining, machine learning and computer vision. PCA are focused on its applications in the field of feature extractions (Song et al, 2010).
Confusion matrix is used to evaluate the classification results in multi class problems. Each column of the matrix represents a predicted class while each row represents an actual class or vice versa.
Feature selection has been widely applied in computer vision, pattern recognition and machine learning. It is known that feature selection is used to reduce the high dimensional patterns to proper dimensionality. Firstly, feature is generated in reference to applied application. For feature generation, statistical methods are applied such as mean, standard deviation, skewness, contrast, correlation and energy. Secondly, generated feature is selected for good performance of classification and shorter training
times. It is a method that comb out relevant and irrelevant features. Selected features create feature vectors.
First statictical method for feature selection is signal energy. Finding energy concentration is based on the Parseval’s Theorem. This theorem states that the energy of a signal v(t) remains the same whether it is computed in time domain or in frequency domain that states in Equation 3.8.
1 1 ∞ = ∫ | ( )2| = ∫ | ( )|2 (3.8) 2 0 −∞
where T is the time period and N is the length of the signal.
According to Parseval’s Theorem, the energy of a signal can be obtained by adding the squares of its Fourier series coefficients and scaling them. A similar derivation can be obtained for the wavelet transform. These wavelet coefficients provide information and lead to the estimation of local energies at the different scales. The energy at each decomposition level is used to identify the number of levels required for decomposition. The energy at each decomposition level is calculated using the following Equation 3.9 and 3.10
1 = ∑| |2 ,= 1, … , (3.9) =1 1 = ∑| |2 (3.10) =1
Where l is the decomposition level, N is the number of approximations and detail coefficients. EAi, is the energy of the approximation at level l and EDi are the
energy of the detail at decomposition level l. The resolution level from 1 to 4 defined by scales of the probability density of the energy that its value changes between 0 to 1. The algorithm based on the energies of the decomposed signals from wavelet multi resolution analysis was proposed to distinguish different classes of power quality events by Gaing Z L (2004), Gaouda A M et al (2002) and Gaouda A M et al (2000).
The energy of the details at four levels are computed using Equation 3.2 and 3.3. Db4 wavelet is used in decomposition of the power signal disturbances.
Last statictical methods for feature selection are mean and variance which are obtained for sag and swell events. The sample mean takes the whole signal in detailed coefficients at each levels as a combination of time samples and the divided by the number of samples in each energy level. Mathematical expression is in Equation 3.11.
= 1
−1
∑[ ], = 1, … (3.11)
=0
Where Di is the detailed coefficients of transformed data and l is the decomposition level.
The average of the squared differences from the mean gives the variance. In case two data are close to each other, variance is the distinctive feature. Mathematical expression is in Equation 3.12.
4 METHODOLOGY
4.1 Overview of the Plant
In this thesis, used raw data is taken from a cogeneration plant in Aegean region. The plant produces electric energy and superheated water to sell their customer. Single line diagram of the plant is demonstrated in Figure 4.1. As can be seen in the figure, at first, Point of Common Coupling (PCC) voltage is measured for each phase. Installed capacity of the system is 9.8 MW which has 2 distributed generator each one 6,5 MVA are shown in Figure 4.1. G1 and G2. Load 1 plant which has an installed power of 9 MVA. Load 2 indicates the facility that domestic need in cogeneration plant. Load 3 is an animal feed plant. Load 4 is a food plant that has an installed power of 8 MVA.
Load 4
Load 1 Load 2 Load 3
Grid
G 1 G 2
Figure 4.1 Single Line Diagram of Cogeneration Plant
Recorded raw data is from year 2007 to 2015. Table 4.1 demonstrates both islanding and grid mode data at PCC by year. All data in islanding mode by using phases for detection and classification.
Table 4.1 Raw Data of Disturbanced Voltage Data at PCC by Year
Year Grid Mode Islanding
Mode 2007 4 7 2011 - 2 2012 - 1 2014 3 1 2015 - 2 Total 7 13 4.2 Harmonic Analysis
Power system harmonics is an important research field. This primarly deals with nonlinear loads that indicates nonsinusoidal waveforms. Electric arc furnaces, motors, static VAR compensator, invertors, converters, motor devices are examples of source of harmonic. In this thesis, there are many nonlinear loads such as motors, converters which used data in the plant.
Fourier Transform and Short Time Fourier Transform are used for finding harmonics in the system. Recorded data has voltage disturbances both on islanding mode and on grid mode operation. The signals have 675 data points in 1 second. But this data points are not enough for investigating high frequency components. For this reason, interpolation method is used in Matlab. It is a method which estimates new point between known two points for constructing a new data points without breaking signal type. While implementing the interpolation methods, it can be seen in 675 Hz level. In STFT analysis, Gaussian Window is used because of its shape and it decreases to zero, when leaved the center of window.
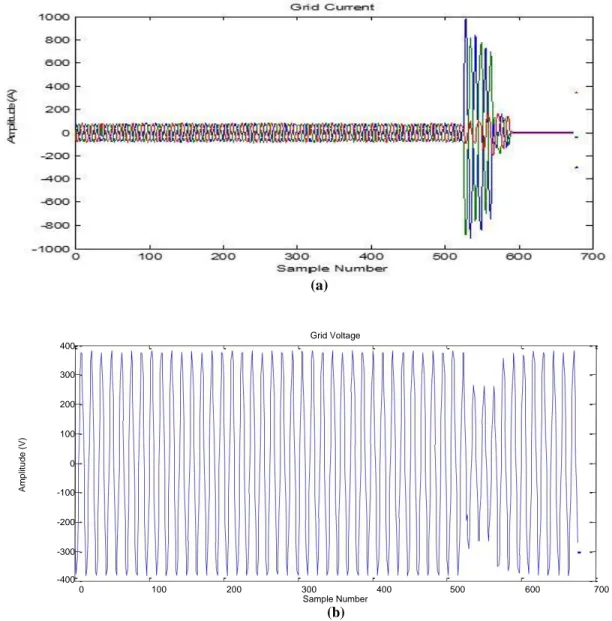
One of the detection method is to look current signals at PCC. If the grid current is nonexistent that means the sytem operates on islanding mode. According to September 2014 year current and voltage data which are shown in Figure 4.2 (a) the current does not exist for a long time. That means the system is operating on islanding mode. At that time,
is nearly normal until operating mode changes to grid mode. There is a current fluctuations and voltage sag exists.
A m pl it ud e ( A ) Grid Current 2000 1500 1000 500 0 -500 -1000 -1500 -2000 100 200 300 400 500 600 700 0 Sample Number (a) A m pl it ud e ( V ) Grid Voltage 400 300 200 100 0 -100 -200 -300 -400 100 200 300 400 500 600 700 0 Sample Number (b)
Figure 4.2 Islanding Raw data at PCC (a) Current Signal (b) Voltage Signal
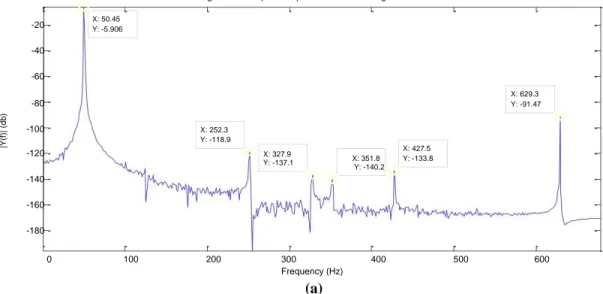
In this thesis, voltage harmonic research is done by two different algorithms which are FFT and STFT. As explained in Chapter 3.1, Fourier Transform merely produces information about the existence of a certain frequency component, but it does not tell where in time event occur. On the other hand, STFT provides information about both when and where frequencies occur with starting and ending position. Figure 4.3
(a) indicates Fourier specturum of Figure 4.2 (b) data at PCC. As seen, there exists at 5th and 7th harmonics. Also there are interharmonics at 327.9 Hz and 427.5 Hz. Figure 4.3 (b) introduces spectrogram of the same data. While analyzing STFT, we can see the starting and ending points of disturbance and their frequencies.
|Y
(f
)|
(db
)
Single-Sided Amplitude Spectrum of Grid Voltage
-20 X: 50.45 Y: -5.906 -40 -60 -80 X: 629.3 Y: -91.47 -100 X: 252.3 Y: -118.9 -120 X: 327.9 X: 351.8 X: 427.5 Y: -133.8 Y: -137.1 Y: -140.2 -140 -160 -180 0 100 200 300 400 500 600 Frequency (Hz) (a) Frequen ce (Hz )
Short-Time Fourier Transform Spectrum of Grid Voltage
600 500 400 300 200 100 0 0.1 0.2 0.3 0.4 0.5 0.6 0.7 0.8 0.9 Time (s) (b)
Figure 4.3 Fourier Spectrum and Spectogram of Grid Voltage (a) Fourier Transform, (b) Spectogram
If the grid current exists, that means the sytem operates on grid mode. March 2007 year current and voltage data are shown in Figure 4.4 (a) demonstrates that the
operating on grid mode. Hence, the time after there is a fault, later the system operating mode is changed to islanding. At that time, when looked at the phase voltage is nearly normal. Figure 4.5 (a) indicates Fourier specturum of 2007-year voltage data at PCC. As seen, 5th and 7th harmonics exist as in Figure 4.3 operating in islanding mode. Also there are interharmonics at 352 Hz and at 426.1 Hz. Figure 4.5 (b) introduces the spectrogram of the same data.
(a) A m p litu d e (V) Grid Voltage 400 300 200 100 0 -100 -200 -300 -400 100 200 300 400 500 600 700 0 Sample Number (b)
Figure 4.4 On Grid Raw data at PCC (a) Current Signal (b) Voltage signal
Figure 4.5 (a) gives Fourier specturum of 2007-year voltage data at PCC. As seen, there are 5th and 7th harmonics. Also there are interharmonics at 352 Hz and at 426.1 Hz. Figure 4.5(b) introduces spectrogram of the same data. We can see the
starting and ending points of disturbance and their frequencies. Harmonics are the same
both on operating mode islanding and on grid mode.
|Y
(f
)|
(db
)
Single-Sided Amplitude Spectrum of Grid Voltage
-20 X: 50.28 Y: -6.484 -40 -60 -80 X: 627.2 Y: -92.08 X: 251.4 -100 Y: -108.8 -120 X: 426.1 X: 352 Y: -130.7 Y: -140.8 -140 -160 -180 0 100 200 300 400 500 600 Frequency (Hz) (a) Fr e q u e n ce (H z)
Short-Time Fourier Transform Spectrum of Grid Voltage
600 500 400 300 200 100 0 0.1 0.2 0.3 0.4 0.5 0.6 0.7 0.8 0.9 Time (s) (b)
Figure 4.5 Fourier Spectrum and Spectogram of grid voltage (a) Fourier Transform (b) Spectogram
4.3 Detection of Sag and Swell
Detecting the sag and swell in voltage waveform is one of the important parameters of power quality event. In previous analysis, FFT and STFT is used for harmonic detection, but for sag and swell detection, wavelet analysis will be used in this chapter. As its explained in Chapter 3.1 and 3.4, wavelet analysis is a form of time
– frequency representation to utilise signal in both time and frequency domain. Due to having the limitations of the FT and STFT, wavelet transform is used. The first step WT analysis is the selection of mother wavelet. Db4 is applied to the disturbance voltage signal that is examined previously Chapter 3.4. Daubechies family is convenient for analyzing power quality disturbances. Detailed coefficients for every decomposed level, which in our cases 4 level, for two different operating modes are shown in Figure 4.6 and 4.7.
In Figure 4.6, WT shows the results of applied to the raw voltage data on islanding mode that is shown in Figure 4.2 (b). Figure 4.6 shows the scalogram of wavelet transform for each decomposition levels. There are two peaks which are detailed coefficients of WT indicates starting and ending of the disturbance. The signal undergoes a sagged voltage at level 3 between 1050th sample and 1080th sample by using Daubechies 4.
Decomposition of the Grid Voltage Coeffic ie nts of Wave le t Sample Number
Figure 4.6 Scalogram Demonstration of Wavelet Transform on Islanding Mode
In Figure 4.7 scalogram of wavelet transform for each decomposition level by using random raw data in islanding mode is represented. Random arbitrary raw voltage data on grid mode is used as shown in Figure 4.4 (b). There are two peaks which are detailed coefficients of WT indicating the starting and ending disturbance. The signal undergoes a sagged voltage between 1050th sample and 1080th sample which is clearly
Decomposition of the Grid Voltage Coeffic ie nts of Wave le t Sample Number
Figure 4.7 Scalogram Demonstration of Wavelet Transform on Grid Mode
4.4 Feature Extraction Based on Wavelet Transform
Detecting sudden changes of waveforms in electrical signals is one of the significant tasks in disturbance signal analysis. Signal processing is the first stage of to get specific information from the raw data. Wavelet Transform is the best technique which is used in this thesis for analyzing signal. In this chapter, power quality events classified by a Neural Network, by using Wavelet Transformed data.
Feature extraction of a disturbed signal provides information that helps to detect the fault for power quality disturbance. Features extracted from the signals are used as the input of a classification system instead of the raw data, since it leads to a much lower dimension for system input. Selecting a proper feature is an important step for successful classification. In this thesis, 1st feature contains energy levels of the detailed
coefficients of wavelet transform. 2nd feature involves mean of the coefficients and last feature comprises variance of the signal by using equations (3.3), (3.10), (3.11), (3.12).
Power signal with disturbance at various time instants is analyzed and subjected to WT transform. The detailed coefficients of the wavelet transform are further processed by finding the energy levels, mean and variance of the signal. Two types of signals with disturbances like sag, swell events at various intervals of time is clearly identified by the statistical analysis.
Table 4.2 is energy levels of each decomposition level for islanding mode both sag and swell parameters by using randomly selected raw data. For each energy level is divided by total energy to find entropy in probability. As it is shown in table, sag energies are lower than swell means for both operating mode in level 2 and 3.
Table 4.2 Energy Levels of Each Decomposition Level For Different Operating Mode
Level 1 Level 2 Level 3
Islanding
Sag 0.0002 0.0.008 0.0346
Mode
Swell 0.0002 0.0009 0.0369
The statistical behavior of the feature vectors which consist of mean and variance is obtained for sag and swell events in Table 4.3. The sample mean takes the whole signal in detailed coefficients at each levels as a combination of time samples and the divided by number of samples in each energy level. Table 4.3 lists mean and variance of the decompotion level, for both sag and swell parameters on island mode. As it is expected, sag means are lower than swell means while energy levels are increasing.
The average of the squared differences from the mean gives the variance. In case two data are close to each other, variance is the distinctive feature. Similarly, variance of sag is lower than swell. Like energy levels, mean and variance analyze on randomly selected raw data.
Table 4.3 Mean and Variance of Each Decomposition Level For Islanding Mode
Level 1 Level 2 Level 3
Mean -0.007x10⁻³ -0.0718x10⁻⁵ -0.2167x10⁻⁵ Sag Variance 0.0001 0.0002 0.0141 Mean 0.0058x10⁻³ -0.0386x10⁻³ -0.3103x10--5 Swell Variance 0.0001 0.0004 0.0200 4.5 Classification of Parameters
All islanding mode raw voltage data for each phase are used in Table 4.1 for classification. For classifying the patterns, firstly the features are extracted from the wavelet transform. The features used as inputs of the Neural Network are extracted from the detailed coefficients of wavelet transform. The obtained coefficients corresponding to the various frequency bands are used for feature extraction. Three features are used for the classification. The disturbance features reside in the two classes which are sag and swell. The features are energy levels of decomposed signals, mean of detail coefficients and variance of detail coefficients.
In Table 4.4, we present the confusion matrix for classification of sag and swell parameters. The first two diagonal cells show the number and percentage of correct classifications by the trained network. Data set includes 90 sag and 9 swell data. According to confusion matrix, 90 sample are correctly classifed as sag. This corresponds to 90.9% of all 99 data. Similarly, 2 data are correctly classified as swell. This corresponds to 2.0 % of all data. Overall, 92.9% of the predictions are correct and 7.1% are wrong classifications.
In related works, correct classificication rates are between 94.37% and 98.17% but in this thesis correct classification rate is 92.9%. Because number of sampled and training data are limited.
Table 4.4 Confusion Matrix
=90/97 =7/97 =2/2 =0/2 =90/90 =2/9 =0/90 =7/2
5 CONCLUSION AND FUTURE WORK
The work carried out on power quality disturbance analysis with using some signal processing techniques and classify the analyzed signal with Neural Network by use of MATLAB. The findings of research are listed.
Firstly, using Fourier transform, the time information is completely lost and frequency axis is divided uniformly. Secondly, STFT is used for finding which frequency components are present and where they are located in time. STFT add a window to take the time domain information into consideration. The frequency resolution depends on the time resolution, or the size of the window. We cannot zoom in a particular frequency range because the window is uniformly placed. Because of this reason, Wavelet transform is used thirdly. Wavelet transform is the best signal processing technique which is applied in this thesis, since wavelets with different scales measure the corresponding frequency components in the signal and the time - frequency resolutions of wavelets are adaptive.
Second important part of the thesis is classification of the analyzed signal using Neural Network. Some features are used to classify the signal type as sag or swell. These features are statistical values of Wavelet Transform detailed coefficients. Simulation results show that overall accuracy rate of classification is 92.9%.
5.1 FUTURE WORK
The future work will be about usage of different signal processing techniques such as Stockwell Transform and diversified classification methods. Results of wavelet applications will be examined and comparisons with other methods in the literature will be obtained. Lastly, detected and classified signals will be filtered.
REFERENCES
Arrillaga Jos, Watson Neville R., 2003, “Efficiency of FFT Algorithm”, Power System Harmonics, Wiley 2nd Edition, page 55-56
Baggini Angelo, 2008, “Distributed Generation and Power Quality”, Handbook of Power Quality”, Published by John Wiley & Sons, 1st Edition, page 524-526.
Bollen Math H. J., Gu Irene Y. H., 2006, “Power Quality”, Signal Processing of Power Quality Disturbances, Published by John Wiley & Sons, Inc, page 4- 33
Center of Sustainable Energy, “Combined Hear and Power”, https://energycenter.org/self-generation-incentive program/business/technologies/chp, (Date Accessed: 5 March 2016)
Chen S., 2005, "Feature selection for identification and classification of power quality disturbances," IEEE Power Engineering Society General Meeting, 2005, pp. 2301-2306 Vol. 3
Cogen Europe, “What is Cogeneration”, http://www.cogeneurope.eu/what-is-cogeneration_19.html, (Date Accessed: 5 March 2016)
Daubechies I., 1996, “Where do wavelets come from? A personal point of view”, Proceedings of the IEEE, Vol. 84, No.4, pp 510-513
Douglas J., 1994, "Power quality solutions," in IEEE Power Engineering Review, vol. 14, no. 3, pp. 3-7, March 1994.
El-Khattam W., Salama M.M.A., 2004, “Distributed generation technologies, definitions and benefits”, Elsevier Electric Power Systems Research 71, 119–128
Funchs F. Ewald, Masoum A.S., 2008, “Introduction to Power Quality”, Power Quality in Power Systems and Electrical Machines, Elsevier Academic Press, Second Edition, page 1-9
Gaing Zwe-Lee, Huang Hou-Sheng, 2003, "Wavelet-based neural network for power disturbance classification," Power Engineering Society General Meeting, 2003, IEEE, Vol. 3, pp. 1628.
Gaing Zwe-Lee, 2004, "Wavelet-based neural network for power disturbance classification," Power Engineering Society General Meeting, 2003, IEEE, Vol. 19, No.4 pp. 1560-1568.
Gaouda A. M., Salama M. M. A., Sultan M. R., Chikhani A. Y., 2000, "Application of multiresolution signal decomposition for monitoring short-duration variations in distribution systems," in IEEE Transactions on Power Delivery, vol. 15, no. 2, pp. 478-485, Apr 2000.
Gaouda A. M., Kanoun S. H., Salama M. M. A., Chikhani A. Y., 2002"Pattern recognition applications for power system disturbance classification," in IEEE Transactions on Power Delivery, vol. 17, no. 3, pp. 677-683, Jul 2002.
Gargoom A. M., Ertugrul N., Soong W. L., 2005, "A comparative study on effective signal processing tools for optimum feature selection in automatic power quality events clustering," Fourtieth IAS Annual Meeting. Conference Record of the 2005 Industry Applications Conference, 2005., pp. 52-58 Vol. 1.
Gencer Ö, Öztürk S, Erfidan T, 2010, A new approach to voltage sag detection based on wavelet transform. Int. J. Elect. Power Energy Syst. 32(2):133-140.
Glover Duncan J., Sarma S. Mulukutla., Overbye J. Thomas., 2008, “Introduction”, Power System Analysis and Design, Thomas Learning, 4th Edition, page 1-23.
Goswami J C., Chan A K., 1999, “Time Frequency Analysis”, Fundamental of Wavelets, wiley Publication, page 57-88
Karimi M., H. Mokhtari and M. R. Iravani, 2000, "Wavelet based on-line disturbance detection for power quality applications," in IEEE Transactions on Power Delivery, vol. 15, no. 4, pp. 1212-1220, Oct 2000.
Lachman T., Memon A.P., Mohamad T.R., Memon Z.A., 2010, Detection of Power Quality Disturbances Using Wavelet Transform Technique, International Journal for the Advancement of Science & Arts, Vol.1, No.1.
Leis John W., 2011, “Frequency Analysis of Signals”, Digital Signal Processing Using Matlab for Students and Researchers, Published by John Wiley & Sons, Inc., page 203-266
Matworks., “Continuous Wavelet Transform and Scale-Based Analysis “, http://www.mathworks.com/help/wavelet/gs/continuous-wavelet-transform-and-scale-based-analysis.html, (Date Accessed: 18 March 2016)
Matworks., “Introduction to Wavelet Families”,
http://www.mathworks.com/help/wavelet/gs/introduction-to-the-wavelet families.html?searchHighlight=daubechies%20wavelet%20families”, (Date Accessed: 18 March 2016)
Morsi WG, El-Hawary ME, 2010, “Novel power quality indices based on wavelet packet transform for non-stationary sinusoidal and nonsinusoidal disturbances”, Electric Power Syst. Res. 80(7):753-759
Mozina Charles J., 2008, “Impact of Distributed Generation”, https://www.pacw.org/issue/summer_2008_issue/cover_story/impact_of_distributed_ generation/article/5.html, (Date Accessed: 21 March 2016)
National Instruments, 2008, LabVIEW 8.6 Help, http://zone.ni.com/reference/en-XX/help/371361E-01/, (Date Accessed: 4 April 2016 )
National Certificate Examination for Energy Managers and Energy Auditors, Energy Efficiency in Thermal Utilities, Chapter 7 Cogeneration, http://www.em-ea.org/guide%20books/book-2/2.7%20cogeneration%20.pdf, (Date Accessed: 5 March 2016)
Polikar, R., 2001, “The Wavelet Tutorial”, URL:
Ruijuan Jia, Chunxia Xu, 2008, “Power Quality Event Detection and Recognition Using Wavelet Analysis and Intelligent Neural Network”, Proceedings of the 27th Chinese Control Conference July 16-18, 2008, Kunming, Yunnan, China
Sankaran C., 2002, “Introduction to Power Quality”, Power Quality, page 20-30
S. Santoso, E. J. Powers and W. M. Grady, 1997, "Power quality disturbance data compression using wavelet transform methods," in IEEE Transactions on Power Delivery, vol. 12, no. 3, pp. 1250-1257.
Santoso S., Powers E.J., Grady W.M., Parsons A.C., 2000, “Power quality disturbance waveform recognition using wavelet based neural classifer- part2: application”. IEEE Trans. Power Deliv., 15, (1), pp. 229-235
Saribulut Lütfü, Teke Ahmet, Barghi Latran Mohammad, Tümay Mehmet, 2013, Fundamentals and literature review of wavelet transform in power quality issues, Journal of Electrical and Electronics Engineering Research, Vol. 5(1), pp. 1-8
Sushama M., Tulasi Ram G., Laxmi Jaya A., 2010, Detection of Power Quality Disturbances Using Wavelet Transforms, International Journal of the Computer, the Internet and Management Vol.18 No.1 (January-April, 2010), page 61-66
Song Fengxi, Guo Zhongwei, Mei Dayong, 2010, “Feature Selection Using Principal Component Analysis”, International Conference on System Science, Engineering Design and Manufacturing Informatization
Tagare M. Digambar, 2011, “Combined Generation, Cogeneration”, Electric Power Generation the Changing Dimensions, John Wiley & Sons, Inc., Hoboken, New Jersey, page 247-264
Uyar, Murat, Yildirim Selcuk, Gencoglu Muhsin Tunay, 2008, “An effective
wavelet-based feature extraction method for classification of power quality disturbance signals”, Elsevier, Electric Power Systems Research, vol.78, no.10, pp 1747-1755
World Energy Outlook 2015, “And Efficiency Measures are Gathering Strength” URL: https://www.iea.org/Textbase/npsum/WEO2015SUM.pdf (Date Accessed: 29 April 2016)
CURRICULUM VITEA
Irmak ÖNAL KORKUT
May 2016
EDUCATION _______________________________________________________
2013 –cont. Yaşar University at İzmir, Turkey, M.A. Major: Electrical and Electronics Engineering Advisor: Hacer Şekerci, Asst. Prof
2008 - 2013 Yaşar University, B.Sc.
Major: Electrical and Electronics Engineering
ACADEMIC EMPLOYMENT _________________________________________
September 2014 - Research Assistant, Yaşar University Present
CERTIFICATES _____________________________________________________
February 2016 – Solar Power System Installation Training (Certificate No: 21217)
Februrary 2020 from the Chamber of Electrical Engineers
PUBLICATIONS _____________________________________________________
Peer-reviewed journal articles and invited book chapters
Önal Korkut, I., Öztura, H., (2015) Ada Modunda Çalışan bir Kojenerasyon Sisteminin Hata Analizi, IV. Elektrik Tesisat Ulusal Kongre ve Sergisi, Güç ve Enerji Sistemleri Kongresi, İzmir, 174-180
CONFERENCE PRESENTATIONS _____________________________________
Talks
Önal Korkut, I., Öztura, H., (2015) Ada Modunda Çalışan bir Kojenerasyon
Sisteminin Hata Analizi, IV. Elektrik Tesisat Ulusal Kongre ve Sergisi, Güç ve Enerji Sistemleri Kongresi, 21-24 Ekim 2015 İzmir.
THESIS _____________________________________________________________
Önal, I. (2013), Power Analysis in Matlab, Unpublished Undergraduate thesis, Yaşar University