KADİR HAS UNIVERSITY
GRADUATE SCHOOL OF SCIENCE AND ENGINEERING PROGRAM OF INDUSTRIAL ENGINEERING
MULTI-OBJECTIVE DISASTER RELIEF LOGISTICS
MAHDI M. SAMARAH
MASTER’S THESIS
M ah d i M . S am ar ah M .S . T he si s 2018
3
MULTI-OBJECTIVE DISASTER RELIEF LOGISTICS
MAHDI M. SAMARAH
MASTER’S THESIS
Submitted to the Graduate School of Science and Engineering of Kadir Has University in partial fulfillment of the requirements for the degree of Master’s in the Program of
Industrial Engineering
DECLARATION OF RESEARCH ETHICS / METHODS OF DISSEMINATION
I, MAHDI M. SAMARAH, hereby declare that;
• this Master’s Thesis is my own original work and that due references have been appropriately provided on all supporting literature and resources;
• this Master’s Thesis contains no material that has been submitted or accepted for a degree or diploma in any other educational institution;
• I have followed “Kadir Has University Academic Ethics Principles” prepared in accordance with the “The Council of Higher Education’s Ethical Conduct Principles” In addition, I understand that any false claim in respect of this work will result in disciplinary action in accordance with University regulations.
Furthermore, both printed and electronic copies of my work will be kept in Kadir Has Information Center under the following condition as indicated below:
� the full content of my thesis/project will be accessible from everywhere by all means.
MAHDI M. SAMARAH
__________________________
6
TABLE OF CONTENTS
ABSTRACT ... i ÖZET ... ii ACKNOWLEDGMENTS ... iii LIST OF TABLES ... vLIST OF FIGURES ... vii
LIST OF ABBREVIATIONS ... viii
1. INTRODUCTION ... 1
2. REVIEW OF RELATED LITERATURE ... 6
2.1 Review Articles on OR/MS in DOM ... 11
2.2 Relief Routing Literature ... 13
2.3 Articles Related to DOM Stages ... 17
2.3.1 Mitigation Stage ... 18
2.3.2 Preparedness Stage ... 20
2.3.3 Response Stage ... 22
2.3.4 Recovery Stage ... 24
2.4 Articles Reviewed for Different Aspects of Disaster Management ... 24
3. MATHEMATICAL MODEL DEVELOPMENT ... 27
4. MULTI-OBJECTIVE OPTIMIZATION METHODOLOGY ... 34
5. COMPUTATIONAL RESULTS ... 38
5.1 Case Study Parameters ... 38
5.2 Computational Results for Demand-Distance Scenarios ... 44
5.2.1 Results for Scenario 1 ... 45
5.2.2 Results for Scenario 2 ... 48
5.2.3 Results of Scenario 3 ... 49
5.2.4 Results of Scenario 4 ... 50
5.2.5 Results of Scenario 5 ... 52
7
5.2.7 Results of Scenario 7 ... 54
5.2.8 Results of Scenario 8 ... 56
5.2.9 Results of Scenario 9 ... 57
5.3 Comparison of Scenario Results ... 58
5.4 Computational Results for Stochastic Outcomes ... 63
6. CONCLUSIONS ... 64
REFERENCES ... 66
APPENDIX A ... 70
A.1 GAMS file for Model 1 ... 70
A.2 GAMS file for Model 2 ... 72
A.3 GAMS file for Model 3 ... 74
A.4 GAMS file for Model 4 ... 76
APPENDIX B ... 79
i
MULTI-OBJECTIVE DISASTER RELIEF LOGISTICS
ABSTRACT
Disaster relief logistics is one of the major fields of operations research. Deciding the locations of depots before the disaster by minimizing total costs and total distances between nodes of demands and these depots is the main purpose of this study. The efficiency of disaster relief logistics is expressed in terms of the total transportation cost. The other objective function is considering minimizing total accumulated time to represent efficacy to supply different number of pallets which include basic materials and necessary types of foods. Equity is represented by minimizing the percentage of unsatisfied demand achieved by balancing the capability to serve demand nodes and the ability to diminish number of pallets that would not reach the nodes. Dealing with uncertainty in both demands and distances create different scenarios for our study, and the results explain how each objective function affects the logistics decisions for each scenario.
Keywords: Disaster Management, Humanitarian Relief Logistics, Location Selection, Multi-Objective Programming, Efficacy, Equity, Demand and Distance Uncertainty.
ii
ÇOK AMAÇLI AFET YARDIMI LOJİSTİĞİ
ÖZET
Afet yardım lojistiği, yöneylem araştırmasının başlıca alanlarından biridir. Bu çalışmanın temel amacı, toplam maliyetlerin en aza indirilmesi ve talep noktaları ile depolar arasındaki toplam mesafelerin en aza indirilmesi yoluyla, felaket öncesinde depoların bulunduğu yerlere karar verilmesidir. Afet yardım lojistik planının verimliliği, toplam ulaşım maliyeti şeklinde ifade edilmiştir. Diğer amaç fonksiyonu, çözümün verimliliğini temsil etmek için, temel malzeme ve gerekli gıda türlerini içeren farklı sayıda paletleri tedarik etmek için gereken toplam sürenin en aza indirilmesidir. Eşitlik, talep düğümlerine hizmet verebilme kapasitesinin dengelenmesi ve düğümlere ulaşmayacak palet sayısının azaltılması ile elde edilen tatminsiz talebin yüzdesinin en aza indirilmesiyle temsil edilmektedir. Hem talepler hem de mesafelerdeki belirsizliği ifade etmek için farklı senaryolar oluşturulmuş ve sonuçlara göre her bir hedefin her bir senaryo için lojistik kararları nasıl etkilediği açıklanmıştır.
Anahtar Sözcükler: Afet Yönetimi, İnsani Yardım Lojistiği, Lokasyon Seçimi, Çok Amaçlı Programlama, Verimlilik, Eşitlik, Talep ve Mesafe Belirsizliği.
iii
ACKNOWLEDGMENTS
I would like to express my deepest gratitude to my thesis advisor Asst. Prof. Dr. Esra Ağca Aktunç. Her guidance helped me in all the time of research and writing of this thesis. Besides my thesis advisor, I would like to thank my academic advisor Assoc. Prof. Dr. Ahmet Yucekaya for his encouragement and enthusiasm.
Last but not the least, there is no word can express my feelings toward my mother, my father and my family who offered everything for me to reach this level.
iv
v
LIST OF TABLES
Table 1.1 Top 5 disasters within 1980-2010 (Torre et al. 2016)... 2
Table 2.1 Comparing different characteristics of disaster relief articles ... 8
Table 2.2 Percent of research articles in 4 DOM stages (Galindo and Batta, 2013) ... 11
Table 4.1 Advantages and disadvantages of GCM ... 35
Table 4.2 Advantages and disadvantages of using linear combinations technique ... 35
Table 4.3 Advantages and disadvantages of epsilon-constraint method... 36
Table 5.1 Pallet contents ... 39
Table 5.2 Distribution and worker costs ... 40
Table 5.3 Scenario probabilities ... 40
Table 5.4 Randomly generated demands (in pallets) according to 𝑈𝑈𝑈𝑈𝑈𝑈𝑈𝑈𝑈𝑈𝑈𝑈𝑈𝑈[100, 150] distribution ... 41
Table 5.5 Distance matrix for scenarios S1, S2, S3 (in km) ... 41
Table 5.6 Total transportation cost matrix for scenarios S1, S2, S3 (in $) ... 42
Table 5.7 Total accumulated waiting time matrix for scenarios S1, S2, S3 (in minutes) ... 42
Table 5.8 Distance matrix for scenarios S4, S5, S6 (in km) ... 42
Table 5.9 Total transportation cost matrix for scenarios S4, S5, S6 (in $) ... 43
Table 5.10 Total accumulated waiting time matrix for scenarios S4, S5, S6 (in minutes) ... 43
Table 5.11 Distance matrix for scenarios S7, S8, S9 (in km) ... 43
Table 5.12 Total transportation cost matrix for scenarios S7, S8, S9 (in $) ... 44
Table 5.13 Total accumulated waiting time matrix for scenarios S7, S8 and S9 (in minutes) ... 44
Table 5.14 Optimal solutions (𝑥𝑥𝑖𝑖𝑖𝑖∗) of four models separately for Scenario 1 ... 46
Table 5.15 Optimal solutions (𝑥𝑥𝑖𝑖𝑖𝑖∗) of 𝑍𝑍𝑤𝑤𝑤𝑤𝑖𝑖𝑤𝑤ℎ𝑡𝑡𝑤𝑤𝑡𝑡 for Scenario 1 ... 47
Table 5.16 Comparison of Model 1 and Model 2 results for Scenario 1 ... 47
Table 5.17 Scenario 1 summary ... 47
Table 5.18 Optimal solutions (𝑥𝑥𝑖𝑖𝑖𝑖∗) of four models separately for Scenario 2 ... 48
Table 5.19 Optimal solutions (𝑥𝑥𝑖𝑖𝑖𝑖∗) of 𝑍𝑍𝑤𝑤𝑤𝑤𝑖𝑖𝑤𝑤ℎ𝑡𝑡𝑤𝑤𝑡𝑡 for Scenario 2 ... 48
vi
Table 5.21 Optimal solutions (𝑥𝑥𝑖𝑖𝑖𝑖∗) of four models separately for Scenario 3 ... 49
Table 5.22 Optimal solutions (𝑥𝑥𝑖𝑖𝑖𝑖∗) of 𝑍𝑍𝑤𝑤𝑤𝑤𝑖𝑖𝑤𝑤ℎ𝑡𝑡𝑤𝑤𝑡𝑡 for Scenario 3 ... 50
Table 5.23 Scenario 3 summary ... 50
Table 5.24 Optimal solutions (𝑥𝑥𝑖𝑖𝑖𝑖∗) of four models separately for Scenario 4 ... 51
Table 5.25 Optimal solutions (𝑥𝑥𝑖𝑖𝑖𝑖∗) of 𝑍𝑍𝑤𝑤𝑤𝑤𝑖𝑖𝑤𝑤ℎ𝑡𝑡𝑤𝑤𝑡𝑡 for Scenario 4 ... 51
Table 5.26 Scenario 4 summary ... 51
Table 5.27 Optimal solutions (𝑥𝑥𝑖𝑖𝑖𝑖∗) of four models separately for Scenario 5 ... 52
Table 5.28 Optimal solutions (𝑥𝑥𝑖𝑖𝑖𝑖∗) of 𝑍𝑍𝑤𝑤𝑤𝑤𝑖𝑖𝑤𝑤ℎ𝑡𝑡𝑤𝑤𝑡𝑡 for Scenario 5 ... 52
Table 5.29 Scenario 5 summary ... 53
Table 5.30 Optimal solutions (𝑥𝑥𝑖𝑖𝑖𝑖∗) of four models separately for Scenario 6 ... 53
Table 5.31 Optimal solutions (𝑥𝑥𝑖𝑖𝑖𝑖∗) of 𝑍𝑍𝑤𝑤𝑤𝑤𝑖𝑖𝑤𝑤ℎ𝑡𝑡𝑤𝑤𝑡𝑡 for Scenario 6 ... 54
Table 5.32 Scenario 6 summary ... 54
Table 5.33 Optimal solutions (𝑥𝑥𝑖𝑖𝑖𝑖∗) of four models separately for Scenario 7 ... 55
Table 5.34 Optimal solutions (𝑥𝑥𝑖𝑖𝑖𝑖∗) of 𝑍𝑍𝑤𝑤𝑤𝑤𝑖𝑖𝑤𝑤ℎ𝑡𝑡𝑤𝑤𝑡𝑡 for Scenario 7 ... 55
Table 5.35 Scenario 7 summary ... 55
Table 5.36 Optimal solutions (𝑥𝑥𝑖𝑖𝑖𝑖∗) of four models separately for Scenario 8 ... 56
Table 5.37 Optimal solutions (𝑥𝑥𝑖𝑖𝑖𝑖∗) of 𝑍𝑍𝑤𝑤𝑤𝑤𝑖𝑖𝑤𝑤ℎ𝑡𝑡𝑤𝑤𝑡𝑡 for Scenario 8 ... 56
Table 5.38 Scenario 5 summary ... 57
Table 5.39 Optimal solutions (𝑥𝑥𝑖𝑖𝑖𝑖∗) of four models separately for Scenario 9 ... 57
Table 5.40 Optimal solutions (𝑥𝑥𝑖𝑖𝑖𝑖∗) of 𝑍𝑍𝑤𝑤𝑤𝑤𝑖𝑖𝑤𝑤ℎ𝑡𝑡𝑤𝑤𝑡𝑡 for Scenario 9 ... 58
Table 5.41 Scenario 9 summary ... 58
Table 5.42 Summary of optimal objective function values ... 58
Table 5.43 Summary of optimal depot locations ... 59
Table 5.44 Percent of unmet demand for each demand node based on Model 4 results in each scenario ... 62
vii
LIST OF FIGURES
Figure 1.1 North and East Anatolia fault ... 3
Figure 1.2 Marmara Sea and historical earthquake in the region ... 4
Figure 2.1 Distribution of DOM research type, ME, MS, MC. (Altay and Green, 2006) ... 12
Figure 2.2 SDVRP solutions for LMPD (Huang et al., 2010) ... 14
Figure 2.3 Last mile relief distribution (LMRD) (Noyan et al., 2015) ... 15
Figure 2.4 Number of requests from the shelter in Japan ... 16
Figure 2.5 Representation of the various functions of the information flows (Fiorucci et al., 2005)... 19
Figure 3.1 Model framework ... 28
Figure 3.2 Sample netwrok ... 29
Figure 4.1 Multi-objective optimization methods (based on Chiandussi et al. (2012) and Cui et al. (2017)) ... 34
Figure 5.1 Model 1 optimal objective function values for all scenarios ... 60
Figure 5.2 Model 2 optimal objective function values for all scenarios ... 61
Figure 5.3 Model 3 optimal objective function values for all scenarios ... 61
Figure 5.4 Model 4 optimal objective function values for all scenarios ... 62
viii
LIST OF ABBREVIATIONS
WFP World Food Program
NGO Non-Governmental Organization DOM Disaster of Operation Management DSS Decision Support System
IFRC International Federation of Red Cross
OR/MS Operation Research and Management Science
MS Management Science
MC Management Consulting
ME Management Engineering
CA Cluster Approach
VRP Vehicle Routing Problem
SDVRP Split Delivery Vehicle Routing Problem LMDP Last Mile Delivery Problem
FDP Final Destination Problem
EVPI Expected Value of Perfect Information VSS Value of Stochastic Model
LMRD Last Mile Relief Distribution LDC Local Distribution Center POD Point Distribution Center GIS Geological Information System
OCHA Office for the Collaboration of Humanitarian Affairs SMIP Stochastic Mixed Integer Programming
SCAP Single Commodity Allocation Problem
RCC Rescue Command Center
RRA Relief Resource Allocation HL Humanitarian Logistics
1
1. INTRODUCTION
One of the most important difficulties that humanity faces is the different types of disasters, including two major groups. The first one is natural disasters like floods, hurricanes, earthquakes, and cyclones, and the other group is caused by human beings, like wars, famines, and epidemics. Earthquakes are a common natural disasters group that cause huge damage and a high number of life losses. For example, Shanxi earthquake, the deadliest earthquake in history, stroke China in 1556 and killed 830,000 people (Tzeng et al., 2007), Tsunami attacked Indonesia in 2004 and killed more than 165,000 people.
Recently another earthquake stroke Haiti in 2010 which is assumed to be the worst earthquake encountered by United Nations (UN). The problem of facing the earthquakes is related to the uncertainty of the time and the area that the earthquake will strike. Even the advanced technology, computers and seismographs cannot help the scientists to determine where and when the earthquake will attack.
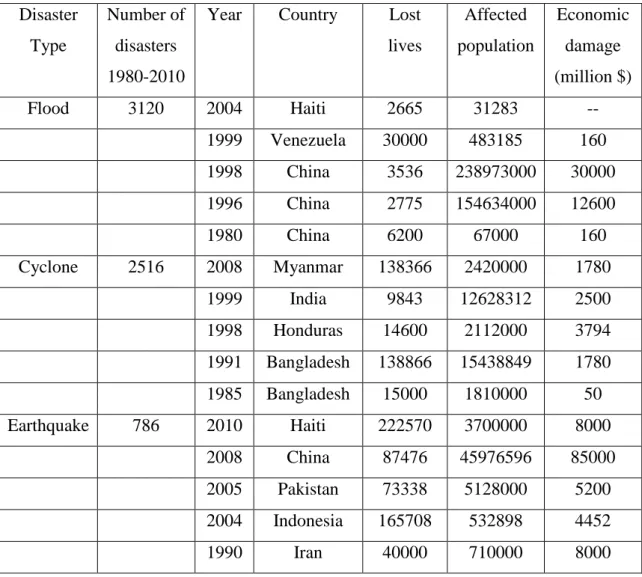
Table 1.1 shows the top 5 natural disasters within the period 1980-2010, and statistics of lives lost, the number of affected people, and damage in million dollars.
2
Table 1.1 Top five disasters within 1980-2010 (De La Torre et al., 2012) Disaster
Type
Number of disasters 1980-2010
Year Country Lost lives Affected population Economic damage (million $) Flood 3120 2004 Haiti 2665 31283 -- 1999 Venezuela 30000 483185 160 1998 China 3536 238973000 30000 1996 China 2775 154634000 12600 1980 China 6200 67000 160 Cyclone 2516 2008 Myanmar 138366 2420000 1780 1999 India 9843 12628312 2500 1998 Honduras 14600 2112000 3794 1991 Bangladesh 138866 15438849 1780 1985 Bangladesh 15000 1810000 50 Earthquake 786 2010 Haiti 222570 3700000 8000 2008 China 87476 45976596 85000 2005 Pakistan 73338 5128000 5200 2004 Indonesia 165708 532898 4452 1990 Iran 40000 710000 8000
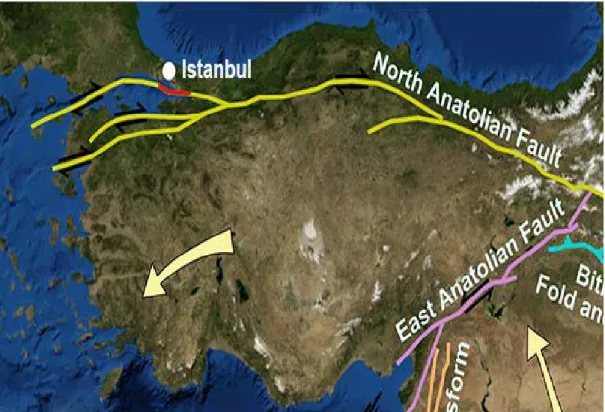
Earthquake scientists expect a disastrous earthquake that could strike Istanbul within the coming years, the magnitude on Richter scale is expected to be between 7 and 7.4, depending on the seismic site. Figure 1.1 shows the north and east Anatolia fault and specifically the epicenter of the earthquake in the red line. The north Anatolia fault line is a highly active tectonic fault line. This site shows hard subterranean movements, these movements create interlocking between earth plates, and that is increasing the tension in the ground and releasing this tension leads to new earthquakes.
3
Figure 1.1 North and East Anatolia fault (Weston, 2017)
According to the scientists, the earthquake will occur in the eastern part of Marmara Sea, twenty kilometers south of Istanbul, where there has not been an earthquake since 1776. Figure 1.2 appoints the region from the Marmara Sea that will be affected by the earthquake and the plates that faced earthquake before. UN estimated the number of affected people to be between seventy thousand to ninety thousand and the economic losses to be around five hundred million dollar.
The best way to decrease the consequences of the earthquake by preparing the community for a sudden attack and investment of sufficient budget in multiple kinds of research, including operations research and management sciences (OR/MS) in disaster operation management (DOM) to increase the efficiency of actions needed during the disaster. This area of research deals with decisions regarding the numbers of depots, vehicles, and shelters, the capacity of vehicles, relief demand, transportation cost and mode, in addition to the cost of materials.
4
Figure 1.2 Marmara Sea and historical earthquake in the region (Weston, 2017) DOM is a scientific approach to perform activities before, during, and after the disaster in order to diminish the losses in human life and economy and to revive the community to return to its normal situation.
DOM has four main stages, starting with the mitigation stage. At this stage, the performance of all activities within the period of the disaster are measured. Then, there is the preparedness stage and response stage, ending with recovery stage. Using operations research in disaster management as a method to incorporate the braces of OR/MS (MS, MC, ME) to increase the effectivity of stages (mitigation, preparedness, response, recovery).
In our research, we will consider uncertainty as an attempt to simulate the reality with the model applied within the work, since the deterministic case may result in infeasibilities if any condition changes unexpectedly.
The stochastic model is the most familiar model used to deal with disaster operation management and the reason behind that is related to the ability of a stochastic model to
5 cope the uncertainty during the disaster.
In general, the stochastic model is established in two stages, the first one depends on preparedness which is the second stage of disaster operation management, this stage considering any type of outfitting the society and environment before the occurrence of the disaster to increase the efficiency of response actions during the disaster, the second stage of the stochastic model relying on the response and recovery stages (third and fourth stages in disaster operation management).
Response is defined as the actions applied during the disaster by the government and other non-governmental organizations (NGOs) to help affected population and to utilize the available resources in a suitable way, while the recovery is the short and long-term activities helped to revive the community and its functioning to the normal situation.
In this model, the preparedness stage focusing on the locations that would be chosen to build depots and storages, where the uncertainty will be beneficiaries demand which changed because of moving between shelters and depots, in a trial to find a bigger relief and disease epidemics.
The reaction stage considering the performance parameters efficiency, efficacy, and equality, the first parameter in terms of minimizing total cost, efficiency highlighted the quick and sufficient distribution, and equality comparing the variety of service stage through different sites.
The thesis is organized as follows: In Chapter 2, the related literature is reviewed. In Chapter 3, the mathematical model development is presented. In Chapter 4, the methodology used for solving multi-objective disaster relief problem is explained. In Chapter 5, computational results of the mathematical model based on a case study is presented and analyzed. Finally, in Chapter 6, concluding remarks and future research directions are provided.
6
2. REVIEW OF RELATED LITERATURE
The challenges that create the barriers and difficulties for disaster operation field were built by destabilized infrastructure, duration and capacity needed to distribute relief materials and uncertainty in demand, these challenges have been discussed by De La Torre et al. (2012). The article explained how United Nations (UN) established Sphere handbook; the standard of minimum humanitarian relief materials like daily calories of food (2100 calorie per day per person) and amount of water (2.5 liters per day per person). This handbook expresses the collaborative effort between a large number of local and international non-governmental organizations. The article also used special software to generate damage scenarios for infrastructure modeling the Federal Emergency Management Agency’s (FEMA) HAZUS program, and defined the recovery stage as equality in delivery.
Another important article comprises multi-objective optimal planning for relief system is Tzeng et al. (2007), where the key to reducing human losses and damage is the distribution of relief materials. The model has three objectives starting with minimizing total cost and total travel time (efficiency goals), and increasing the minimal satisfaction as the last objective function for fairness target.
One of the popular and traditional locations problem is median location problem, P-median has several properties which makes this kind of problems capable and useable even in the present time. P-median is focusing on minimizing total distances between candidate nodes to choose best locations for different facilities, another important property that P-median has the ability to deal with un-capacitated storages, and the primary principle for P-median is trying to get nearest nodes to chosen locations as a final result of the model.
7
Advanced approach was derived from P-median is P-center, this approach uses minimax objective function in order to decrease the maximum amount of distances between located facilities and nodes of demand. The difference between P-median and P-center is minimizing average distances for P-median problem, while minimizing maximum distances for P-center.
In the model we used uncertainty in distances and demand as a basic concept, because of that for each scenario the located depots will change, and for demand we suggest upper and lower bounds, and P-median works with un-capacitated storages while we are limits our depots with six hundred pallets for each. The other properties of P-median has been used like the objective function for the first phase considers minimizing total distances between nodes of demand and depots.
We can say that we used P-median and its properties with new practical application includes stochastic approach, and P-center gave us the way to define and solve the fourth objective function in our model by using minimax methodology to get the percentages of unmet demand for each demand node.
Stochastic model has two different stages, preparedness stage and reaction stage, both of them considering uncertainty in multiple ways. While using OR/MS in DOM rises the possibility to incorporate the model with the reality. The different characteristics of assumptions will be available for the model, first type reasonable assumptions do not compromise the applicability of the study (finding space for improvement), second type is limited assumptions which specified to model inappropriate to others, non-realistic is the last type of assumptions, it doesn’t work with general settings but useful to diminish the complexity of the model.
By Table 2.1 many classifications was created to compare between different studies that have been made between 1978 and 2018, these classifications related to the type of the objective function like minimizing total distances, total costs, total unsatisfied demand and total waiting time. Another characteristic have been taken which is the stochasticity of demand and distances, in addition to use multi commodity, multi depot, heterogeneous
8
vehicles, data of real disaster and review of the past works as additional criteria to discover more details about these articles. The arrangement of the table based on the arrangement of the articles through literature review. The flow of our literature review: 2.1 General reviews for different articles in OR/MS in DOM, 2.2 Review for relief routing articles, and 2.3 Review for articles related to DOM levels: 2.3.1 mitigation, 2.3.2 preparedness, 2.3.3 response, 2.3.4 recovery, and 2.4 Review different aspects of disaster management.
Table 2.1 Comparing different characteristics of disaster relief articles
Features Articles Mi n . d is tan ces Mi n . co st Mi n . u n me t de m and Mi n . w ai ti ng ti me S toc ha st ic de m and M u lt i-co m mo d ity M u lt i-de p ot H et er o g en eo u s v eh icl es S toc ha st ic d ist an ce s Da ta f rom r ea l d is as ter L ite ra tu re rev iew Allahverdi et al. 2018
×
×
×
×
×
Battara et al. 2018×
×
Besiou et al. 2018×
Carracsco et al. 2018×
×
×
×
×
Ferrer et al. 2018×
×
×
×
×
Franco et al. 2018×
×
Kirac and Milburn
2018
×
×
Moshtagh et al. 2018×
×
Yucel et al. 2018×
×
Bonmee et al. 2017×
×
×
×
×
×
Pradhananga et al. 2016×
×
×
×
×
×
9
Table 2.1 Comparing different characteristics of disaster relief articles (continued)
Features Articles Mi n . d is tan ces M in. c os t M in. unm et de m and M in. w ai ti ng ti me S to ch ast ic de m and M u lt i-co m mo d ity M u lt i-de p ot H et er o g en eo u s v eh icl es S to ch ast ic d ist an ce s D at a f ro m r ea l d is as ter L ite ra tu re rev iew
Das and Okumura
2015
×
×
×
×
Huang et al. 2015×
×
×
×
×
×
×
Noyan et al. 2015×
×
×
×
Rodriguez-Espindola et al. 2015×
×
×
×
Zhan et al. 2014×
×
×
Balliue 2013×
×
Davis et al. 2013×
×
×
Galdino and Batta
2013
×
×
Milburn and Rainwater 2013×
×
×
Ortunu et al. 2013×
×
Rekik 2013×
Anaya-Arenas et al. 2012×
×
Roy et al. 2012×
×
×
×
×
×
×
×
De La Torre et al. 2012×
×
×
×
10
Table 2.1 Comparing different characteristics of disaster relief articles (continued)
Features Articles Mi n . d is tan ces M in. c os t M in. unm et de m and M in. w ai ti ng ti me S to ch ast ic de m and M u lt i-co m mo d ity M u lt i-de p ot H et er o g en eo u s v eh icl es S to ch ast ic d ist an ce s D at a fro m r ea l d is as ter L ite ra tu re rev iew Han et al. 2011
×
×
×
Leiras at el. 2010×
×
×
×
×
Mete and Zabinsky2010
×
×
×
×
×
×
×
Rawls and Turnquist
2010
×
×
×
×
×
×
Beamon and Balcik
2008
×
×
×
Tzeng et al. 2007
×
×
×
×
×
×
×
Yi and Ozdamar
2007
×
×
×
×
×
Altay and Green
2006
×
×
Fiorucci et al. 2005
×
×
Klose and Drexl
2005
×
×
Barbarosoğlu and Arda 2004×
×
×
×
Denzel et al. 2003×
×
Rand 1976×
×
×
Our thesis×
×
×
×
×
×
×
×
11 2.1 Review Articles on OR/MS in DOM
Galindo and Batta (2013) reviewed main studies for operation research and management science in disaster operation management between 2005-2010, and through 155 article 28.4% talked about preparedness stage, 33.5% focused on response stage, and 3.2% considered recovery stage, which means 36.7% for reaction stage in our stochastic model.
Altay and Green (2006) reviewed OR/MS in DOM, between 1980 and 2004, out of 109 articles, 21.1% related to preparedness stage, 23.9% for response stage, and 11% recovery. According to these reviews in Table 2.2, the proportion of articles and searches for the response and preparedness stages increased, because in these stages the successful of the models will be examined, if the decisions of preparedness stage has a high percentage of inaccurateness, the result will effect on the response stage then all stages of the model, at the end will lead to disastrous stochastic situation, on the other side the scientists concentrated on increasing the effectivity for these stages to catch higher possibility of success.
Table 2.2 Percent of research articles in 4 DOM stages (Galindo and Batta, 2013) Altay and Green Galindo and Batta
No. of articles 109 155 Mitigation 48 37 Preparedness 23 44 Response 26 52 Recovery 12 5 Multi-stages 0 17
Other aspects of Altay and Green (2006) the most important review in the last decades, provide starting points for researches and scientists who interested in OR/MS in DOM field, highlighted the role of DOM stages within the disaster, providing different sectors for future work, surviving the OR/MS which is done until 2004, focusing on sociological and psychological impact on the community, and finally the review was not limited to specific kind of disaster management, it took all of the societies that related to international federation of red cross (IFRC). Through 109 article Figure 2.1 shows the
12
percentages and numbers of articles relying on DOM stages and classification frameworks, management engineering (ME), management consulting (MC), management science (MS).
Figure 2.1 Distribution of DOM research type, ME, MS, MC. (Altay and Green, 2006) Denizel et al. (2003) discussed the limitations of operation research and management science these days, it is suffering from the low number of researchers developing conjunction with humanitarian organizations, low technology magnifies the gap between what we have and the demand, questions with answers of how service allocation for affected people models will contain critical factors. Research percentages decreased with time for recovery stage, the design of the infrastructure and community business has low number of articles and searches, lack of researchers considering socio-economic situation for displaced and affected families.
Papers that highlighted response stage in disaster operation management with relief distribution network reviewed by Anaya-Arenas et al. (2012). The article examined different available studies in multiple criteria to specify the degree of advancement for actions needed within DOM and emphasize the most effective approaches and contributions in the literature, in addition to defining each stage of DOM (pre-disaster stages: mitigation and preparedness, post-disaster stages: response and recovery) and which articles presenting the suitable model and solutions for each stage.
The study that reviewed models with decision support system (DSS) is Ortunu et al. (2013). This paper declared human-made and natural hazard effects as a threatening event
13
with a probability of a potential damage in specific region and specific period, the damage could be in health, different properties, infrastructure, human being, animal and plants life, the main objective for the article is incorporating humanitarian logistics models from different agencies into decision support system. This search try to define the fairness as the effective efforts to ensure and deliver each demand point with relief materials, the physical delivery consist three levels supply, transportation and demand, so the Ideal model driving for both effectiveness and fairness not for profit in business, which leads to find combinations of variables to decrease total travel time, size of vehicle fleet, fixed and variable costs.
2.2 Relief Routing Literature
An optimization stochastic model applied in Ethiopia-Africa by Leiras et al. (2010) for humanitarian supply to distribute of World food program (WFP). The model relies on two linear programming stages, the first one is the preparedness stage, and the second stage depends on recovery stage, uncertainty will appear through limited accessibility and warehouse capacities and will be calculated using two methodologies expected value of the perfect information (EVPI) and value of stochastic solution (VSS). Different kind of transportation affects distribution models, were characterized in primary transportation (PT) like air (high cost), railway (suffering from poor infrastructure and maintenance) and road (most used), secondary transportation is the transportation within two points from the same country.
One of the researches that focused on modeling relief routing with the principles of efficiency in terms of transportations cost, efficacy as fast and accurate response and equity represented by the measurement of fairness between deviated recipients is Huang et al. (2010). This article avoided ad-hoc distribution decisions that create problems in response time, amount of deliveries and usefulness of resources, the study explains how the Split delivery vehicle routing problem (SDVRP) model that split the demand through the fleet to minimize fleet cost and travel cost can incorporate within last-mile delivery problem (LMDP).
14
Figure 2.2 below shows multiple solutions (different roads) produced by using SDVRP in last mile delivery problem:
Figure 2.2 SDVRP solutions for LMPD (Huang et al., 2010)
The important role of OR within the last decades were studied by Besiou et al. (2018) included how OR can effect on different aspects of humanitarian logistics. In the same field Ferrer et al. (2018) produced a new model with multi-objective function to schedule many trips for relief vehicles where the performance has measured by security, and Pakistani flood 2010 were the case study for the model.
Ray and Albores (2012) develop logistical framework using the ability of last mile relief distribution (LMRD) then implementing the framework in optimization and humanitarian logistics model. Four main factors affects final decisions of the model are facility location (the location of most effectively inventory in relief network) , transportation mode(the most suitable mode of transportation with minimum travel cost and transportation cost), distribution decisions(fast and equity distribution between affected population) and inventory management( arrange and design incoming and left relief materials).
Allahverdi et al. (2018) have introduced a new algorithm with the name of ‘AA’, where the purpose from this algorithm to minimize total lateness of specific number of machines without wait flow-shop, and considering a maximum value of makespan as a limit for all machines. Another article has improved a new algorithm to build a specific schedule depending on total resource cost by Carrasco et al. (2018), the objective function of total
15
costs and total completion time were minimized in order to test the addition heuristics of the new algorithm an to know if we can apply it on real instances or not.
Stochastic optimization model used for designing the last mile relief network, this study was applied by Noyan et al. (2015). The article established the model by determining capacities and locations for each relief distribution point through last mile network as a first step, the second one designing the distribution network, third step building stochastic model with two stages, focusing at the same time on equity and achieving high levels of accessibility. This model used Branch-and-cut algorithm based on Benders decomposition, the last step explaining the effectiveness of uncertainty method to build stochastic model demand and transportation stages.
Figure 2.3 explains how local distribution center (LDC) deliver relief materials to points of Distribution (POD) which send the relief materials for demand points, these points serve different beneficiaries (like villages and neighborhoods) in the affected region:
Figure 2.3 Last mile relief distribution (LMRD) (Noyan et al., 2015)
Das and Okumura (2015) studied perishable kind of relief materials and how it effects on both declining urgency and distribution of the demand, this study used optimization dynamic programming model to determine the amount and the time for ordering perishable relief materials against demand and urgency, perishability influences service level of the system, so decision makers should balance between the efficiency of the system and wastage resulted from perishability.
16
Figure 2.4 declares trend of relief materials (bread and clothes) and a number of requests for the earthquake that stroke Japan 2011. We noticed here, the natural declining in demand with time, Das and Okumura (2015) tried to reach usefulness stage of perishability before the demand decreases until zero demand.
Figure 2.4 Number of requests from the shelter in Japan (a) Bread requests, (b) Clothes requests (Das and Okumura, 2015)
Another article that used relief resources allocation (RRA) principles to establish multi-objective function model in order to improve the relation between equity and efficiency to reach most suitable decisions of fleet routing and allocation of primary relief materials.
Zhan et al. (2014) tried to get most appropriate period before making critical decisions to response the consequences of the disaster. This article has defined RRA as an activities based on critical logistic orders which supplies different transportations with high security to deliver multiple relief materials (water, medications, different types of primary food and tents) from wide range resources (by sea, land and air) to act with the occurrence of any kind of disasters either natural or human-made, then the optimization model correlated OR with Bayesian analysis to get periodic results.
A systematic review has been applied to disaster relief routing by Anaya-Arenas et al. (2012). The review has targeted three aspects at the beginning searching for latest articles where the model dealing with supplying of disaster materials by improving and optimizing it’s logistics, the second aspect is pursuing the number of challenges for these
17
kinds of models, and the mathematical methods to solve it, the third aspect shows the fields and the scientific gaps into the current models in order to create new paths and to discover advanced approaches for logistics and routing challenges. This article has ensured that the articles which the dynamic models were built on uncertainty and solved by stochastic principles still have very small number because it is very hard models and sophisticated, on the other hand, keep using of deterministic models lead to low performances and inaccurate results.
2.3 Articles Related to DOM Stages
Two types of decisions related to disaster management, long-term decision and short-term decision, Rekik (2013), applied short-term decision type for deterministic problem to build optimization model helping decision makers in the early moments after the disaster, and determining number of warehouses in addition to planning for relief materials sent towards affected population. This study explains decision support system (DSS) that relying on expert’s discussions in crisis management and resulted observations, then DSS should specify the most suitable approach form operation research field for each stage through the model.
United Nations (UN) worked on a paper for sharing information in humanitarian emergencies, this paper recommended building systems instead of depending on information flow of individual within the disaster, the system will establish by collaboration between international humanitarian organizations.
Its work starts from what happened through the disaster, what kind of actions had done to decrease the effect of the disaster, what kind of actions was necessary but none of the organizations applied it, what we can extract for better collaboration between governmental and non-governmental organization (office of the collaboration of humanitarian affairs OCHA), the scenario is chosen in the article was from the earthquake of Haiti 2010.
18
tested a new approach to measure the distance between two nodes in tow separated areas, using straight line between the areas, than the algorithm compared with a famous algorithm to determine whether the performances have improved or not.
2.3.1 Mitigation Stage
Mitigation stage in DOM shares the principles of performance within different types of disaster and the necessity of modern approaches to improving actions performance, Beamon and Balcik (2008), framed new methodology to increase the efficiency of system performance in the relief aid field by comparing performance measurements in relief aid chains with performance measurements for commercial supply chains. New performance metrics will be produced to help relief professionals to achieve more targets in the models of mitigation stage and system performance. The paper also provide new ideas about how the performance of the system will get rid of negative and bottlenecks points if the collaboration between multiple chains reach maximum, limit and that will lead to saving more lives with decreasing amount of losses in different economy sectors.
Integrated methodology with two main columns, optimal appointing of resources and modelling systems are built to evaluate decision support system (DSS) in mitigation stage and providing tools to ease forecasting procedures to decision makers, this study was presented by Fiorucci et al. (2005). The article worked on formalizing and describing real time risk management in two phases, real time phase, and pre-operative phase. The first one refers to the horizon time intervals which belong to uncertainty transit time with dummy nodes (null demand), the other phase used expected daily information for the disaster as a base input data to allocate available resources. Three types of frameworks effect on second phase daily information, static hazard assessment represented by topographic and climate data, while dynamic hazard assessment based on model outputs and active hazard assessment related to semi-physical propagation model.
Figure 2.5 declared how daily information can be generated and the conditions that play an important role to determine data kinds:
19
Figure 2.5 Representation of the various functions of the information flows (Fiorucci et al., 2005)
Different types of models focusing on choosing depots locations, these types of studies have been introduced by Klose and Drexl (2005). The article has explained eight kinds of models considering optimization functions to discuss most appropriate locations for storages in relief operations. First kind of the models worked on finding depots and its locations based on geological maps and available roads, second kind helps decision makers to minimize distances between affected people and relief storages, and third kind deals with incapacitated storages to capture any size of demand under different scenarios. fourth type looking after supplying and logistics system for only a single stage model, fifth one has assumed all of the capacity, cost and demand for relief materials as a single aggregated unit, the sixth kind performing a special assumption under fixed and independent demand, seventh kind improves performance metrics within a single period, the last kind isolates every pair of depots and collection points to rising up the quality of relief materials allocation.
Bonmee et al. (2017) have studied how decision makers can appoint different locations for relief storages relying on multiple kinds of problems with various types of models, at the same time concentrating on some factors according to location characteristics which play the main role in determining where will be collection points, medical centers, relief storages, and other important facilities. This paper also defined humanitarian logistics (HL) as an operational activities established to evacuate effected people from the affected region to secure shelters, and performing specific actions to control the capacity of depots and calculates total costs for performed actions, while accurate information about the
20
disaster, stricken region, affected people and accessible ways have been gathered by expert team, (HL) assumed distances as a constant (actual distances between pair of points) not as a function (Euclidean, square Euclidean and rectilinear). By HL definition many types of location problems can be solved such as minisum problem, where there is an ability to use as much as needed of depots and storages to minimize total distances between these depots and demand nodes, another type of problems is covering problem, in this problem the time is limited and demand should be satisfied within this time, Third type of problem is maximal problem, the target is maximizing total demand with limited number of kilometers that can be covered, minimax problem focusing on developing performance metrics for the whole supply chain, while dynamic problem searching for compromising between total costs and times spent, last type is robust problem where uncertainty factors probabilities determine the shape of the model with specific uniform scenarios.
2.3.2 PreparednessStage
Preparedness stage in disaster operation management taking higher importance within the last two decades, Rodriguez-Espindola et al. (2015) create a combination between multi-objective optimization which considers relief materials allocation and prepositioning of stocks. The other side of combination is geographical information system (GIS) to deal with appointing emergency facilities locations (demand points, distribution centers, and shelters), achieving preparedness depending on the coordination between different non-governmental organizations, non-governmental organizations, and international agencies.
One of the most important relief materials is dedication materials, medical supply needs unique conditions to avoid any kind of spoilage, Mete and Zabinsky (2010) suggests stochastic optimization model in preparedness and response stage to assign warehouses points with inventory available capacity for each type of medications and drugs. The paper tried to balance between various percentages risks and uncertainty of events, also gives procedures to reach best ways to deliver medications, taking into account particular medical supplies as a priority for the hospitals. The model based on two stages, the first stage to determine warehouses areas with its stages, second one focusing on the amount
21
supplied to hospitals, the amount for each scenario equals aggregated stage which changes to number of vehicles, its capacity and the suitable routing, the different earthquake scenarios applied to Seattle state in the United States of America.
Yucel et al. (2018) have discussed the methodology of strengthening the roads before the disaster, for the first step they built a random model (randomness in roads), then they have calculated each road probability by Bayesian, after that they have worked on strengthen the weak links using stochastic model programming, so as a result the weak road’s probabilities has been diminished.
Social cost was the objective function of a three-echelon model introduced by Pradhananga et al. (2016) to build a critical planes for preparedness stage and response stage. Social cost was calculated using both of logistics cost and deprivation cost, where these costs increase exponentially with deprivation time. This study also shows how propositioning and purchasing decisions with multiple resources can reduce the shortage in the amount of relief materials and decrease the total cost. The network has a set of supply points (a large facilities near from the disaster) at the highest echelon to serve a large region which stroke by a disaster, assuming the type of shipping in this model is direct and flexible from these points to the victims and the affected areas.
Prepositioning of various supplies has a probability to rise the efficiency of preparedness stage, the results reflects on the actions of response stage after the disaster, finding the preposition stages for different kinds of equipment’s and emergency relief materials was the target of Rawls and Turnquist (2010) using two stages mixed integer program (SMIP), uncertainty in the model appears through demand and transportation availability, the study solved the model by decomposing the problem into series of sub-problems to make it easier to calculate, then finding total expected total cost as a first stochastic level and specifying suitable prepositioning level for the second stochastic level.
Using earthquake sciences and variety approaches for forecasting was made by Battara et al. (2018) to specify the amount of needs before the disaster and they have used in the article different scenarios of demands reflect with uncertainty, this study was suggested
22
to use upon preparedness stage to judge the level of prepositioning level of the relief materials.
Discussing different characteristics and criteria's to determine most suitable choices of relief storages location were performed by Rand (1976), the study suggested seven main aspects that should be satisfied in order to take right decisions for depots and storages locations. The first aspect is questioning about which is more important between minimizing total costs or applying performance metrics principles, second aspect wondering if the number of locations is limited or not, third one about the type of methodology which used in the model is optimizing or in heuristic way, the fourth point considering the periods is it in months, years or decades, in single period or not, fifth aspect is wondering if the current sites are included in the model, sixth aspect about limit capacity storages or incapacitated relief storages, seventh aspect comprise total supplying costs if it will be calculated related to fleet scheduling or information analysis, finally this paper suggest an algorithm to build a model by:
1) Determine the number of storages and depots 2) Allocate them randomly to suggest regions 3) Serve effected people by these regions
4) By minimizing total distances choose best regions 5) Do not continue if there are no better regions 6) Otherwise go back to step 3
2.3.3 Response Stage
The evaluation of first two stages of disaster operation management, mitigation, and preparedness stages, occurred in response stage, Milburn and Rainwater (2013), presented how we can build disaster response model, starting with determining distribution points after the disaster occurrence, ending with the advancement of the infrastructure, and preparing actions to face the consequences of the disaster, the scenario of the disaster in this paper had taken from New Madrid Seismic Zone (NMSZ) to test the results of the response model.
23
With eighty percent of total disaster relief operations, logistics considered as the most important stage for relief aid, Balliue (2013) characterized logistics as on-going process and explained its role in saving lives within and after the disaster, also the importance of logistics in emergency plans for response stage and how collaboration between supply chains provide the most effective possible aid for shelters, demand and distribution points, and finally affected population.
Two stages model for logistical relief aid to effected region in the response stage was established by Barbarosoğlu and Arda (2004), they explained the flow of materials over modern types of transportation through multi-objective model network, uncertainty in the model represented by variety of supply and capacities amounts which resulted from affected infrastructure. To solve uncertainty and variety in the linear programming model they used different scenarios for demand, supply flow, and capacities, and dealing with two stages needs a model with multi-commodity and network flow, then first stochastic stage is a structural component with free uncertainty and fixed variables, while control components the second stage is affected by uncertainty in input data, the article studied Avcilar region in Istanbul with different earthquakes scenario to find the most effective stochastic model.
Multi-objective function model was developed by Huang et al. (2015), in this model three objective functions have been integrated and improved under two important terms emergency distribution and resource allocation. The paper suggests multiple time horizons to consider latest updates of information and to modify the wrong logistics decisions. Lifesaving utility is the first objective function which has the highest importance between other objective functions, delay cost was assumed as the second objective function and it was offered to show how postponing relief materials maximize the suffering of the victims, and to show the importance of time urgency and how to deal with it, last objective function is fairness, it was defined by the degree of the equality and the priority through the affected region.
Highly important operations applied through disaster response stage, evacuation and logistical support, Yi and Ozdamar (2007) built a model with integrated
distribution-24
location, the target of the model is reaching accurate results for logistical plans, depots, and distribution locations, establishing emergency and shelters regions within affected zone and relief materials delivery, like medications, food, water, tents, and rescue equipment's, then to obtain vehicles numbers, capacities, and routs. The article will consider mixed-integer network flow multi-commodity model, finally the study characterizes relief materials and affected population into hierarchy priorities, that means the vehicles will serve higher priorities locations, this approach achieving minimum delay in supplying time.
2.3.4 Recovery Stage
Recovery stage did not take the same importance of other stages, related to low number of articles and studied performed at this stage, but one of the recent papers explained recovery stage in stochastic model which is Van Hentenryck et al. (2010). The paper focused on Single Commodity Allocation Problem (SCAP) as the main stage for stochastic optimization model to obtain series of depots and fleet routing, also to minimize inefficiency in resource allocation and supplying time. The scenario generated by Los Alamos Library for expected hurricane that will strike USA, and uncertainty in this paper is the outcome of hurricane effected people lives and infrastructure
2 . 4 Articles Reviewed for Different Aspects of Disaster Management
Volunteer management one of the aspects in humanitarian relief has not a high concentration, this aspect could improve the actions in response level but it is depending on the way that the organizations and agencies will manage the volunteers and the field experiences. Falasca and Zobel (2012) examined a model with multi-criteria to find a systematic approach to assign volunteers and different tasks in addition to labor scheduling this assignment related to volunteers experience and field skills for each of them. This approach will help decision makers to reach the best choices in the early period after occurrence of disaster consequences.
25
An interesting paper shows the effect of the social media on response stage was discussed by Kirac and Milburn (2018). The writers have viewed how awareness level will be changed significantly after using social media through the disaster, and the way that affected people can use mobile app to finally determine total needs into the affected area, and providing valuable information’s about the disaster.
Health sector were studied in term of performance metrics, many of these studies explained different methods to improve delivery services. Davis et al. (2013) built a model depending on equity, efficiency, and effectiveness to rank 35 general service hospitals in New Zealand between 2001 and 2009. The study applied for more than 500 admissions per year, where the total number of admissions in that period around 4 million admission, each performance metric relied on two measurements. For equity as a first metric both of level of ethnic and the variation through socio-economic for the hospitals considered as variables to calculate equity, the correlation between pooled data variation and inter hospital variation for first metric is 0.41 which is moderate correlation. The second performance the efficiency measured by patient stay and number of surgeries for each day, the correlation of variances for this metric is 0.2 that means low correlation. Effectiveness as a last metric related to morality of period before disaster and unplanned readmission, for the last metric the correlation is low and equals 0.2.
To highlight the importance of queue problems, Moshtagh et al. (2018) have been published to illustrate the different situations of the roads through the disaster and which one of them has a huge effect on the evacuation operations, and developed a model with travel time and total costs as an objective functions.
Our model has common aspects shared with relevant articles, but the distinguishable points in our research are:
- Uncertainty in demand and supply.
- Simultaneous optimization of performance parameters.
- Multi-objective function model, the first objective function is determining depots locations, while other objective functions related to performance parameters (efficiency, efficacy, and equity).
26
The closest parameters for our research are Huang et al. (2010) who worked on optimizing performance parameters, and Klose and Drexl (2005), they built a model to obtain best possible locations for depots and storages.
27
3. MATHEMATICAL MODEL DEVELOPMENT
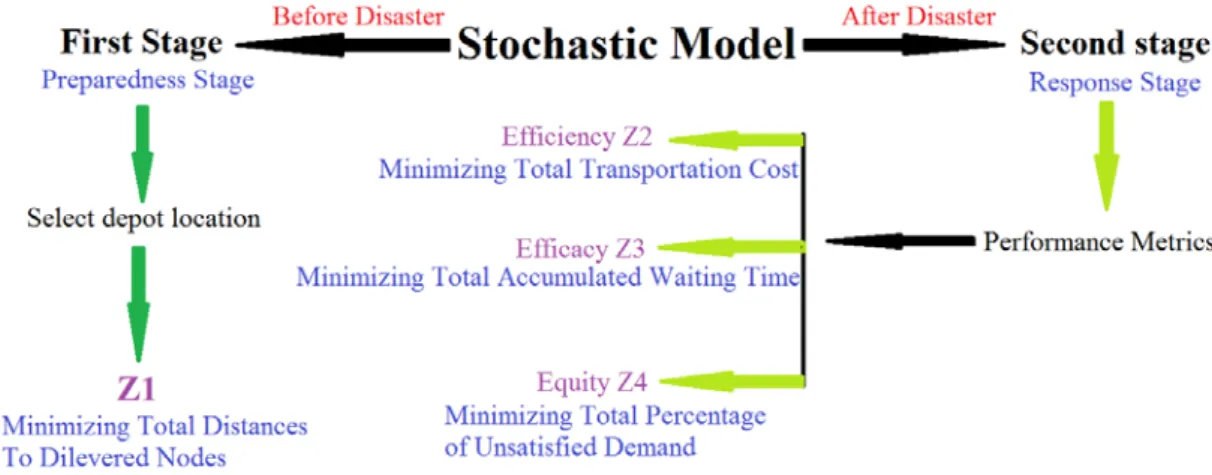
Disaster operations management has four stages, each stage considers a specific time (before or after the disaster) that will effect on the final results of any model. To incorporate the science with the reality in terms of the existence of inaccurate data and uncertainty in details, the stochastic model of two stages can create the perfect environment to solve the uncertainty problem. Two stage stochastic model are applied with different cases through different scenarios, starting with the first stage that deal with preparedness (first stage of DOM), where the target is selecting the locations of different depots, in the model it was represented as a minimization function for total distance to demand nodes and it takes (𝑍𝑍1) symbol, the decisions of this stage are applied before the disaster.
Response (second stage of DOM) represented by performance metrics as a second stage of the stochastic model, in this stage the decisions are made after the disaster. Performance metrics starts with efficiency (𝑍𝑍2), it is focusing on minimizing total transportation cost by minimizing both amount of pallets delivered and the distance between depot and demand node. Second performance metric is the efficacy, this metric can be evaluated by using total accumulated waiting time (𝑍𝑍3). Last performance metric related to equity the one with many approaches to be calculated, and it does not have a direct way to solve like other performance metrics but in our study unmet demand and it’s percentage is the key to find the value of equity metric as (𝑍𝑍4) function, the following Figure 3.1 shows how each stage connect to different objective functions.
28
Figure 3.1 Model framework
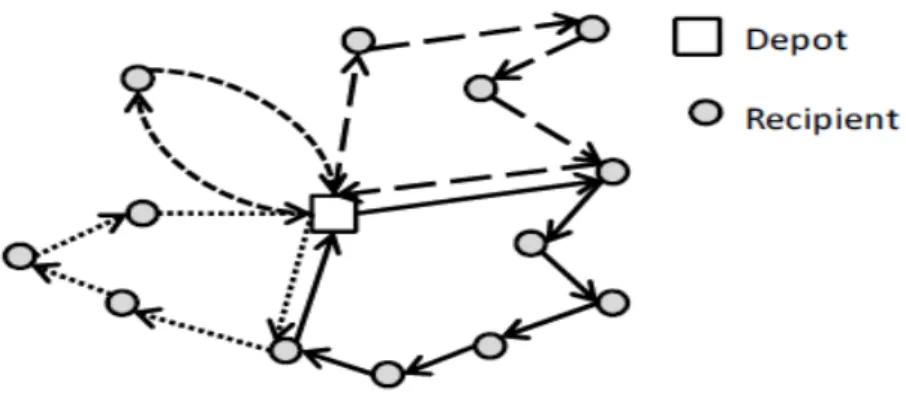
In this study the model has some similarities and differences with P-median, as one of the famous approaches to solve locations selection problems. P-median works with un-capacitated storages while we are limits our depots with a specific number of pallets, and we have used the principle of uncertainty in the distances between demand nodes and the multiple location of depots. The other properties of P-median has been used within the model like the common objective function which considers minimizing total distances between nodes of demand and depots. We can say that we used P-median and its properties with new practical application includes stochastic approach, and P-center gave us the way to define and solve the fourth objective function in our model by using minimax methodology to get the percentages of unmet demand for each demand node. In Figure 3.2 which refers to the sample network that the case study in Chapter 5 is based on, we can find the following:
• Demand nodes in twelve blue points,
• 7 different alternative locations depot in orange color to choose 4 or less from, • The distances between all depots and demand nodes in kilometers,
29
Figure 3.1 Sample network The assumptions of the proposed model are as follows:
1. The total storage capacity of the depots is greater than or equal to the total demand. 2. A specific number of locations will be chosen out of the total number of available
locations.
3. A specific average speed of trucks and a predetermined unit cost have been assigned for different objective functions.
4. Each depot can send relief aid to a specific number of demand nodes based on the number of available vehicles for that depot.
5. The unit transportation cost is a constant that does not depend on the depot-demand node pair.
6. Percent of unmet demand for each demand node is assumed as the equity measure. 7. Loading time and unloading time for a truck are assumed to be equal.
8. There is no vehicle restriction, i.e., there are enough number of trucks available at time zero such that all demand can be loaded starting at the same time and delivered immediately.
30
The notation used in the model is defined as follows. Sets:
𝑺𝑺 : set of alternative depot nodes, 𝑈𝑈 = 1, 2, … , 𝑆𝑆 𝑫𝑫 : set of demand nodes, 𝑗𝑗 = 1, 2, … , 𝐷𝐷
𝑲𝑲𝒊𝒊 : set of available vehicles (trucks) at depot 𝑈𝑈, 𝑘𝑘 = 1, 2, … , 𝑁𝑁𝑁𝑁𝑖𝑖 𝛀𝛀 : set of disaster scenarios, 𝜔𝜔 = 1, 2, … , Ω
Parameters:
𝑐𝑐𝑐𝑐𝑝𝑝𝑖𝑖 : Capacity of depot 𝑈𝑈 in number of pallets 𝑑𝑑𝑑𝑑𝑈𝑈𝑖𝑖 : Demand of node 𝑗𝑗 in number of pallets
𝑑𝑑𝑖𝑖𝑖𝑖 : Distance between depot 𝑈𝑈 and demand node 𝑗𝑗 in kilometers 𝑡𝑡𝑐𝑐 : Unit transportation cost per kilometer in dollars
𝑀𝑀𝐷𝐷 : Maximum number of depots that can be opened
𝑁𝑁𝑁𝑁i : Number of vehicles available at each depot at time zero 𝑁𝑁𝑐𝑐𝑐𝑐𝑝𝑝 : Capacity of a truck in number of pallets
𝐿𝐿𝐿𝐿 : Loading time for a truck in minutes 𝑈𝑈𝐿𝐿 : Unloading time for a truck in minutes 𝑆𝑆𝑆𝑆 : Average speed of trucks (km/hour)
𝑈𝑈𝑖𝑖𝑖𝑖 : Fuel cost for the trip between 𝑈𝑈 and 𝑗𝑗 in dollars
𝐷𝐷𝑈𝑈𝐷𝐷𝑡𝑡𝑖𝑖𝑖𝑖 : Distribution cost between demand nodes and depots in dollars 𝑊𝑊𝑈𝑈𝑖𝑖𝑖𝑖 : Worker’s cost in dollars
𝐴𝐴𝑐𝑐𝑐𝑐𝐴𝐴𝑖𝑖𝑖𝑖 : Accumulated waiting time in minutes
Decision variables:
𝑥𝑥𝑖𝑖𝑖𝑖 : Number of pallets delivered from depot 𝑈𝑈 to demand node 𝑗𝑗 𝑤𝑤𝑖𝑖𝑖𝑖 = �1, depot 𝑈𝑈 serves node 𝑗𝑗0, otherwise
𝑦𝑦𝑖𝑖 = �1, if depot location 𝑈𝑈 is selected0, otherwise
Before applying the model we should calculate the parameters 𝐴𝐴𝑐𝑐𝑐𝑐𝐴𝐴𝑖𝑖𝑖𝑖, 𝑈𝑈𝑖𝑖𝑖𝑖, 𝐷𝐷𝑈𝑈𝐷𝐷𝑡𝑡𝑖𝑖𝑖𝑖, and 𝑊𝑊𝑈𝑈𝑖𝑖𝑖𝑖. Accumulated waiting time parameter 𝐴𝐴𝑐𝑐𝑐𝑐𝐴𝐴𝑖𝑖𝑖𝑖 is the sum of loading time, unloading
31
time, and the time needed to reach demand nodes. Fuel cost parameter 𝑈𝑈𝑖𝑖𝑖𝑖 equals the product of the unit fuel cost ($ per km) and the distance between depots and demand nodes. The distribution cost parameter 𝐷𝐷𝑈𝑈𝐷𝐷𝑡𝑡𝑖𝑖𝑖𝑖 has different levels based on the quality of service of each depot. In our case study, based on sample network in Figure 3.2, we will define three levels of distribution cost such that depot 1 has the lowest cost, depots 2, 3 and 4 have an average cost, and depots 5, 6 and 7 have the highest cost. Worker cost parameter 𝑊𝑊𝑈𝑈𝑖𝑖𝑖𝑖 is the product of the number of workers at a depot and the wage of each worker for that depot.
In our study, we define certain scenarios based on the level of demand and the impact of the disaster on the transportation network. We will be using scenario-dependent parameter values for demand, where 𝑑𝑑𝑑𝑑𝑈𝑈𝑖𝑖𝑠𝑠 is the demand of node 𝑗𝑗 in number of pallets under scenario 𝐷𝐷 ∈ Ω, and distances, where 𝑑𝑑𝑖𝑖𝑖𝑖𝑠𝑠 is the distance between depot 𝑈𝑈 and demand node 𝑗𝑗 under scenario 𝐷𝐷. Accordingly, the decision variables in each scenario will be defined as 𝑥𝑥𝑖𝑖𝑖𝑖𝑠𝑠, 𝑤𝑤𝑖𝑖𝑖𝑖𝑠𝑠, and 𝑦𝑦𝑖𝑖𝑠𝑠. The description of the demand and distance scenarios and the corresponding numerical results will be provided in Chapter 5.
The mathematical model for the preparedness stage problem is given as Model 1 below. Model 1: Minimize 𝑍𝑍1 = ∑𝑖𝑖⋿S∑𝑖𝑖⋿D�𝑥𝑥𝑖𝑖𝑖𝑖 × 𝑑𝑑𝑖𝑖𝑖𝑖� (3.1) Subject to: ∑𝑖𝑖∈D 𝑥𝑥𝑖𝑖𝑖𝑖 ≤ 𝐶𝐶𝑐𝑐𝑝𝑝𝑖𝑖 × 𝑦𝑦𝑖𝑖 ∀𝑈𝑈 ∈ 𝑆𝑆 (3.2) ∑𝑖𝑖∈S 𝑥𝑥𝑖𝑖𝑖𝑖 ≥ 𝑑𝑑𝑑𝑑𝑈𝑈𝑖𝑖 ∀𝑗𝑗 ∈ 𝐷𝐷 (3.3) ∑𝑖𝑖∈S𝑦𝑦𝑖𝑖 ≤ 𝑀𝑀𝐷𝐷 (3.4) 𝑥𝑥𝑖𝑖𝑖𝑖 ≥ 0, integer ∀𝑈𝑈 ∈ 𝑆𝑆,∀𝑗𝑗 ∈ 𝐷𝐷 (3.5) 𝑦𝑦𝑖𝑖 ∈ {0,1} ∀𝑈𝑈 ∈ 𝑆𝑆 (3.6)
The objective function 𝑍𝑍1 in (3.1) minimizes the total distance between the demand nodes and the depot locations selected. Constraint (3.2) declares that for each delivery, the storage capacity of depots should not be exceeded. Constraint (3.3) ensures the amount of relief materials will satisfy the demand for each node. Constraint (3.4) ensures that the
32
number of selected depot locations does not exceed the maximum number of depots required. Constraint (3.5) is the non-negativity constraint for the integer 𝑥𝑥𝑖𝑖𝑖𝑖variables and constraint (3.6) defines the binary 𝑦𝑦𝑖𝑖 variables.
The mathematical models for the response stage problems are given as Models 2, 3, and 4 below.
Model 2:
Minimize 𝑍𝑍2 = ∑ ∑𝑖𝑖∈S 𝑖𝑖∈D�𝑥𝑥𝑖𝑖𝑖𝑖 × �𝑈𝑈𝑖𝑖𝑖𝑖 + 𝐷𝐷𝑈𝑈𝐷𝐷𝑡𝑡𝑖𝑖𝑖𝑖+ 𝑊𝑊𝑈𝑈𝑖𝑖𝑖𝑖�� (3.7) Subject to: (3.2)-(3.6)
The objective function 𝑍𝑍2 in (3.7) minimizes the total transportation cost that consists of fuel cost, distribution cost, and worker cost.
Model 3: Minimize 𝑍𝑍3 = ∑ ∑𝑖𝑖∈S 𝑖𝑖∈D (𝑥𝑥𝑖𝑖𝑖𝑖 × 𝐴𝐴𝑐𝑐𝑐𝑐𝐴𝐴𝑖𝑖𝑖𝑖) (3.8) Subject to: (3.2)-(3.6) ∑𝑖𝑖∈D𝑥𝑥𝑖𝑖𝑖𝑖 ≤ 𝑁𝑁𝑐𝑐𝑐𝑐𝑝𝑝 × 𝑁𝑁𝑁𝑁𝑖𝑖 ∀𝑈𝑈 ∈ 𝑆𝑆 (3.9) 𝑥𝑥𝑖𝑖𝑖𝑖 ≤ 𝑁𝑁𝑐𝑐𝑐𝑐𝑝𝑝 × 𝑤𝑤𝑖𝑖𝑖𝑖 ∀𝑈𝑈 ∈ 𝑆𝑆,∀𝑗𝑗 ∈ 𝐷𝐷 (3.10) ∑𝑖𝑖∈D𝑤𝑤𝑖𝑖𝑖𝑖 ≤ 𝑁𝑁𝑁𝑁𝑖𝑖 × 𝑦𝑦𝑖𝑖 ∀𝑈𝑈 ∈ 𝑆𝑆 (3.11) 𝑤𝑤𝑖𝑖𝑖𝑖 ∈ {0,1} ∀𝑈𝑈 ∈ 𝑆𝑆, ∀𝑗𝑗 ∈ 𝐷𝐷 (3.12)
The objective function 𝑍𝑍3 in (3.8) minimizes the total accumulated waiting time for the demand nodes to receive relief items. In addition to constraints (3.2)-(3.6), constraint (3.9) limits delivered pallets with the number of vehicles. Constraint (3.10) ensures the number of delivered pallets is at most as much as the capacity of vehicles for each trip. Constraint (3.11) limits the number of demand nodes that can be served by a depot with the number of available vehicles at that depot. Constraint (3.12) defines the binary 𝑤𝑤𝑖𝑖𝑖𝑖 variables.