y
&
Chemical
Sa
fe
ty
Energy Drink Induced Lipid Peroxidation
and Oxidative Damage in Rat Liver and Brain
When Used Alone or Combined with Alcohol
Rengin Reis, Mohammad Charehsaz, Hande Sipahi, Asiye Is¸ın Do˘gan Ekici, C¸a˘glar Macit, Hatice Akkaya, and Ahmet Aydın
Abstract: Energy drinks (ED) are containing large doses of metabolic stimulants and its use with ethanol has increased dramatically among young adults. In this study, we examined the effects of ED exposure either alone or in combination with ethanol on oxidative stress parameters including superoxide dismutase (SOD), catalase (CAT), glutathione peroxidase (GSH-Px), and lipid peroxidation parameter malondialdehyde (MDA) in rat. Some histopathological findings were also evaluated. ED exposure led to a dose-dependent increase in liver MDA compared to the control indicating oxidative damage. Histopathological findings also revealed that ED alone may generate liver damage. Ethanol exposure increased MDA level and SOD, CAT, and GSH-Px activity in both the brain and the liver. The combination of ethanol and ED produced greater damage which is considered by further increases in SOD and GSH-Px activity in the brain. Similar results for MDA were observed in both the liver and brain as well. Our findings suggest that ED consumption alone or combination with ethanol may represent a significant public health concern.
Keywords: alcohol, energy drink, ethanol and energy drink mixture, lipid peroxidation, oxidative stress
Practical Application: ED consumption among young adults, especially combined with alcoholic beverages, has increased over the last decade. There is not enough research in the literature to determine the total effects of co-administrated alcoholic beverage and ED. This study aimed to provide awareness of the deleterious effects from the consumption of EDs and alcohol both together and separately. Results of this study are expected to be a reference for public service broadcasting and manufacturer of ED in terms of producing a deterrent packaging in case of incorrect self-consumption or mixture preparation.
Introduction
Energy drinks (EDs) are beverages which contain large doses of caffeine and other metabolic stimulants such as taurine, carbo-hydrates, glucuronolactone, and B-complex vitamins (Attila and C¸ akır 2011). The energy boosting capacity of EDs comes mainly from sugar and the stimulating effect from its caffeine content, which is comparable to 1 cup of coffee containing a minimum 80 mg caffeine (Miller 2008). Over the last decade, ED use among young adults, especially its combination with alcohol, has increased dramatically (Franklin and others 2013; Marczinski 2014). These drinks are considered the most popular dietary supplement be-sides multivitamins among American adolescents and they are re-ported to be the most popular supplement among British athletes due to improved performance with mental function and alertness (Campbell and others 2013). A report in 2011 indicates that emer-gency department visits in the United States because of ED and alcohol mixed ED-related problems has increased 10-fold in the previous 5 years (Marczinski and others 2013). France and Den-mark have banned the sale of these kinds of EDs and the
gov-JFDS-2016-0931 Submitted 6/12/2016, Accepted 1/24/2017. Authors Reis, Charehsez, Sipahi, and Aydın are with Dept. of Toxicology, Faculty of Pharmacy, Yeditepe Univ., Istanbul, Turkey. Author Ekici is with Dept. of Pathology, Fac-ulty of Medicine, Yeditepe Univ., Istanbul, Turkey. Author Macit is with Dept. of Pharmacology, Faculty of Pharmacy, Istanbul Medipol Univ., Istanbul, Turkey. Author Akkaya is with Dept. of Biochemistry, Faculty of Medicine, Yeditepe Univ., Istanbul, Turkey. Direct inquiries to author Aydın (E-mail: [email protected]).
ernments of Sweden and Canada published their concerns about limited safety data on caffeinated EDs (Howland and others 2010). In addition to their limited safety data, there is not enough in-formation about the effects of EDs and the mixture of EDs with ethanol on oxidative stress and lipid peroxidation in the literature. Oxidative stress is attributed to the etiology of several diseases such as diabetes, cancer, and cardiovascular disorders. However, reac-tive oxygen species (ROS) may have beneficial functions in terms of cellular signaling, and combating with microorganism in cells. Enhanced production of ROS or depletion of antioxidant defense system can cause an imbalance between oxidants and antioxidants (Ilaiyaraja and others 2011). Overexpression of ROS causes dam-ages to lipids, proteins, and DNA structure (Bloomer and others 2013). To prevent oxidative consequences, cells are surrounded by a defense mechanism which consists of antioxidant enzymes such as superoxide dismutase (SOD), catalase (CAT), and glutathione peroxidase (GSH-Px; Ilaiyaraja and others 2011).
Lipid peroxidation is an autocatalytic process which can be de-scribed as an attack of ROS unsaturated bonds of membrane fatty acids due to increased generation of these oxidant species (Souza and others 2013). Physical breakage of cell membrane caused by lipid peroxidation leads to an influx of ions and body fluids into the cell which results in cell membrane rupture and death. Among lipid peroxidation products, malondialdehyde (MDA) is a very re-active one and serves as a marker of lipid peroxidation. MDA can also bind to cellular proteins and forms protein-aldehyde adducts which act as neo-antigens (Everitt and others 2007; Ilaiyaraja and others 2011).
C
Toxicol
og
y
&
Food
Sa
In this study we aimed to investigate the effects of EDs and the mixture of EDs with ethanol on lipid peroxidation parameter MDA and oxidative stress parameters SOD, CAT, and GSH-Px in liver and brain tissue. Histopathological evaluations were also examined in this study.
Materials and Methods
Chemicals
Hematoxylin and eosin were supplied from Bio Optica and DDK, Italy, respectively. Formalin was purchased from J.T. Baker, Netherlands. Potassium chloride was purchased from Riedel-de Haen, Germany. All other chemicals were supplied from Sigma (St. Louis, Mo., U.S.A.).
Instrument
The centrifuge used for the preparation of samples was a 3– 16PK laboratory centrifuge (Sigma, D-37520 Osterode am Harz, Germany). The spectrophotometer used for the analysis of ox-idative stress parameters was an EVO300 PC UV-Vis (Thermo Fischer Scientific, Madison, WI, U.S.A.).
Animals and housing
Male Sprague-Dawley rats, weighing 200 to 250 g, were ob-tained from the Yeditepe Univ. Medical School Experimental Research Center (YUDETAM) and housed at controlled room temperature (21 ± 1 °C) with 12:12 h light–dark cycle. They were allowed unrestricted access to water and rodent chow. The experimental protocol was approved by the Ethic Committee of Yeditepe Univ. (protocol #414).
Experimental design
A total of 36 Sprague-Dawley rats were divided into control and 5 treatment groups. Control group received tap water (C). Treat-ment groups are as follows: low-dose ED (L): 3.5 g ED/kg/d, high-dose ED (H): 7 g ED/kg/d, ethanol (E): 1 g ethanol/kg/d, ethanol mixed with low-dose ED (EL): 1 g ethanol/kg/d + 3.5 g ED/kg/d, ethanol mixed with high-dose ED (EH): 1 g ethanol/kg/d+ 7 g ED/kg/d. All administrations were done by oral gavage for 14 d.
We used a brand of marketed ED, Rockstar (250 mL per can). Ingredients of Rockstar were sucrose, glucose, dextrose, acid (cit-ric acid), carbon dioxide, taurine (4 g/L), caffeine, sodium citrate, glucuronolactone (240 mg/L), colors (ammonia caramel and ri-boflavins), inositol (100 mg/L), niacin, pantothenic acid, vitamin B6, vitamin B12. Energy content was indicated as 114 kilocalo-ries/250 mL (calorie breakdown is 2% fat, 96% carbohydrates, and 2% protein) according to the information on its label. Designing of the dose of ED was based on the consumption of one con-tainer of ED (250 mL) per day by an adult weighing 65 kg for low-dose ED and 2 containers (500 mL) per day for high-dose ED exposed group. Dose of ethanol was determined according to a previous study (Novier and others 2012). On day 15, animals were weighed and sacrificed by decapitation. Brain and liver tis-sues were dissected and weighed. Tistis-sues from each group which were separated for histopathological evaluation were fixed in 10% formalin for 24 h. Other portions of the liver and brain tissue were frozen immediately on dry ice and stored at−80 °C until analysis of MDA and oxidative stress parameters.
Sample preparation
Brain and liver samples were minced and homogenized with a glass homogenizer in a cold potassium chloride solution (1.15%)
and centrifuged at 3722 g and 4 °C for 15 min. The obtained supernatants were then used to analyze MDA, SOD, CAT, GSH-Px, and protein content.
Determination of protein content in samples
The protein content in tissue homogenates was determined ac-cording to the method published by Lowry and others (1951). Briefly, main solutions including reagent A (2% sodium carbonate in 0.1 N sodium hydroxide), reagent B (0.5% copper sulfate), and reagent C (1% potassium sodium tartrate) were prepared. Then 50 mL of reagent A, 0.5 mL of reagent B, and 1 mL of reagent C were mixed to obtain alkaline copper reagent. Working stan-dard solutions were prepared from bovine serum albumin in the concentration range of 0.625 to 20 mg/mL. For measurement, 0.01 mL of standard solutions or samples were mixed with 1 mL distilled water and 4.5 mL of alkaline copper reagent and allowed to stand for 10 min at room temperature. Then 0.5 mL of Folin’s reagent (1:2 v/v) was added to this solution, mixed and allowed to stand for 20 min at room temperature. Finally, the optical density of standard and sample solutions was measured at 640 nm.
Determination of SOD activity
Each tissue homogenate was diluted 1:40 with 10 mM phos-phate buffer (pH 7.0). Twenty-five microliters of diluted sample was then mixed with 850 µL of substrate solution containing 0.05 mmol/L xanthine sodium and 0.025 mmol/L INT (2-[4— iodophenyl]-3-[4-nitrophenol]-5-phenyltetrazolium chloride) in a buffer solution containing 50 mmol/L CAPS (N-cyclohexyl-3-aminopropanesulfonic acid) and 0.94 mmol/L EDTA disodium dihydrate (pH 10.2). Then, 125µL of xanthine oxidase (80 U/L) was added to the mixture and absorbance increase was followed at 505 nm for 3 min against air. Standard solutions were prepared from stock solution of SOD from bovine erythrocytes in the con-centration range of 0.217 and 5.2 kU/L and phosphate buffer was used as the blank solution (Aydin and others 2001).
Determination of CAT activity
For determination of the CAT activity, the reaction mixture was composed of 50 mM phosphate buffer (pH 7.0), 10 mM H2O2,
and tissue homogenate sample. The reduction rate of H2O2was
followed at 240 nm for 45 s against air at room temperature (Park and others 2010). CAT activity was expressed as kU/g protein. Phosphate buffer was used as the blank solution and the calibration curve was plotted with standard solutions (1.25 to 15 U/mL) prepared from CAT stock lyophilized powder.
Determination of GSH-Px activity
To measure the GSH-Px activity, the reaction mixture was com-posed of 50 mmol/L tris buffer (pH 7.6) containing 1 mmol/L of EDTA disodium dihydrate, 2 mmol/L of reduced glutathione, 0.2 mmol/L of NADPH, 4 mmol/L of sodium azide, and 1000 U of glutathione reductase. The reaction mixture (990µL) and 10 µL of tissue homogenate (diluted 17 times) were pipetted into a quartz spectrophotometer cuvette and incubated for 5 min at room temperature. Then, the reaction was initiated with the addition of 10µL of tert-butyl hydroperoxide solution (1: 1000 dilution). The decrease in NADPH absorbance was followed at 340 nm against air for 3 min and absorbance change per min was calculated. GSH-Px activity was expressed as kU/g protein (Aydın and others 2001; Park and others 2010).
y
&
Chemical
Sa
fe
ty
Measurement of MDA level
Level of MDA was determined as a thiobarbituric acid reactive substance (TBARS) in the liver and brain homogenates according to the method described by Jamall and Smith (1985). Tetram-ethoxypropane solution was used as the standard for plotting the calibration curve and the results in the sample were expressed as nmol/g protein. Briefly, 200µL of sample or standard solution, 200µL of sodium dodecyl sulfate (8.1%), 1500 µL of acetic acid solution (20%), and 1500µL of thiobarbituric acid solution (0.8%) were mixed. The volume was completed to 4000 µL with dis-tilled water. The tubes were kept at 95°C for 1 h. Then, they were cooled under tap water and 2000 µL of the mixture was added to 2000µL of trichloroacetic acid. They were centrifuged at 1017× g for 10 min. The absorbance of the supernatant was measured at 532 nm.
Histopathology
The brain and liver tissues from each group were fixed in 10% formalin for 24 h. After routine tissue processing, the tissues were embedded in paraffin. Sections at 4µm thickness obtained from each paraffin block were stained with hematoxylin and eosin for histopathological evaluation under light microscope (Olym-pus BX53, Tokyo, Japan). Micro photos were taken by Olym(Olym-pus DP 73 (Japan) micro camera. All biopsies at baseline and at follow-up were read by the same pathologist of Yeditepe Univ. Hospital
who was blinded to details of the study. Histopathological variables were scored according to the NASH Clinical Research Network Scoring System (Brunt and others 1999).
Statistical analysis
SPSS version 20 was used for all statistical analyses. MDA, SOD, CAT, and GSH-Px data were analyzed using 1-way ANOVA. When significant interactions were present, follow-up analyses were performed by separate 1-way ANOVAs between variables. For histopathological data, continuous variables were presented as mean (standard deviation) and categorical variables were presented as number (percentage). Differences between several groups were tested with one-way ANOVA, and post hoc tests were performed using Tukey. Differences were considered significant at P< 0.05.
Results and Discussion
Body and organ weight changes
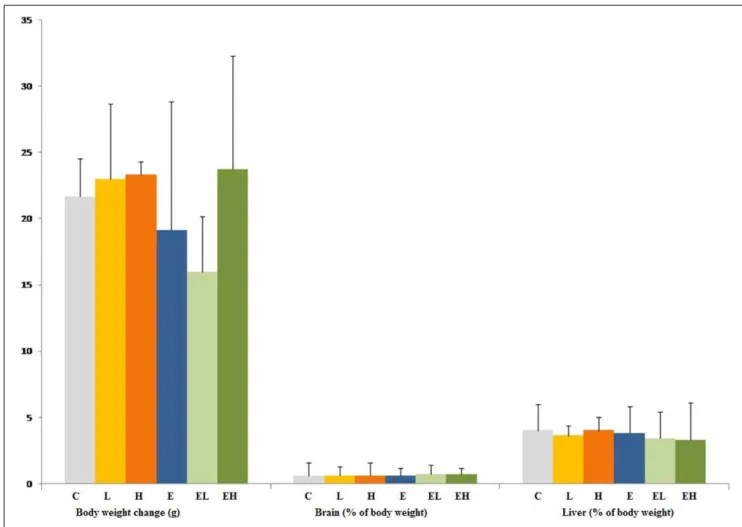
Figure 1 presents the body and relative organ weight changes. No significant differences were found for either body or relative brain and liver weights after 14-d of oral exposure to ED alone and the mixture of EDs with ethanol.
Change in SOD activity
SOD activity is presented in Figure 2(A). In the brain tissue of the ethanol exposed group, SOD activity exceeded in all treated
Figure 1–Body weight (g) and relative organ weight (%) changes in rats exposed to energy drink and energy drink-ethanol mixture. C: control, L: low-dose energy drink group, H: high-dose energy drink (3.5 g/kg/d) group, E: ethanol (1 g/kg/d) exposed group, EL: ethanol (1 g/kg/d) plus low-dose energy drink (3.5 g/kg/d) group and EH: ethanol (1 g/kg/d) plus high-dose energy drink (7 g/kg/d) group.
Toxicol
og
y
&
Food
Sa
groups, but that was statistically significant when compared to the control (P < 0.05). Administration of low-dose ED led to an increase in SOD activity when is compared to the exposure of high-dose ED (P< 0.05). Also, addition of ethanol to high dose of ED showed a significant increase in SOD activity compared to the high-dose ED alone (P< 0.05) In liver tissues, difference on the SOD activity between groups was negligible. Only ethanol exposed group has higher SOD activity when compared to the other groups, but that was not significant.
Change in CAT activity
CAT activity is presented in Figure 2(B). Both in the liver and brain tissues, there is no significant difference between groups.
Change in GSH-Px activity
GSH-Px activity is presented in Figure 2(C). GSH-Px activities were increased significantly in brain tissue of ethanol and ethanol plus low-dose ED exposed group when we compared to the con-trol (P< 0.05). Addition of ethanol to low-dose ED increased this enzyme activity in comparison to low-dose ED alone (P< 0.05). In contrast to the results seen in brain tissue, GSH-Px activity differences were negligible in the liver tissue of all groups. Only ethanol exposed group in liver had higher GSH-Px activity when
compared to the other groups, but that failed to reach statistical significance.
Change in MDA level
MDA content in brain and liver tissues is presented in Figure 2(D). Liver MDA levels in all treated groups exceeded that of the control. Administration of ED alone led to dose dependently higher MDA content in the liver. This induction was signifi-cant (P < 0.05) for high-dose ED group, which suggests that ED exposure at this level exerts oxidative damage in the liver. Co-administration of high-dose ED and ethanol caused greater increment of liver MDA level (P< 0.05). Similarly, in brain tissue, MDA levels were increased in a dose dependent manner in both ethanol plus ED groups compared to the ethanol alone, ED alone, and control groups (P< 0.05).
Histopathology
Histopathological findings and mean scores of variables for liver tissue are shown in Figure 3 and Table 1. Only 2 histopathologi-cal variables, lobular inflammation, and ballooning degeneration, were evaluated in liver tissues according to nonalcoholic fatty liver disease scoring (NAS; Brunt and others 1999). Histopathological
Figure 2–SOD, CAT, and GSH-Px enzyme activity and MDA level in liver and brain tissues of rats exposed to energy drink, ethanol and energy drink-ethanol mixture. SOD activity is expressed as U/mg protein, CAT activity is expressed as kU/mg protein, GSH-Px activity is expressed as U/mg protein and MDA level is expressed as nmol/g protein. C: Control, L: low-dose energy drink group, H: high-dose energy drink (3.5 g/kg/d) group, E: ethanol (1 g/kg/d) exposed group, EL: ethanol (1 g/kg/d) plus low-dose energy drink (3.5 g/kg/d) group and EH: ethanol (1 g/kg/d) plus high-dose energy drink (7 g/kg/d) group.∗P < 0.05.
y
&
Chemical
Sa
fe
ty
Table 1–Mean scores of histopathological variables for liver tissue.
Control L H E EL EH (n= 6) (n= 6) (n= 6) (n= 6) (n= 6) (n= 5) Lobular inflammation None (0) 6 (100%) 1 (17%) 1 (17%) 1 (17%) 3 (50%) 0 Mild (1) 0 5 (83%) 4 (66%) 5 (83%) 3 (50%) 3 (60%) Moderate (2) 0 0 1 (17%) 0 0 2 (40%) Mean score 0± 0.00 0.83± 0.41 1.00± 0.63 0.83± 0.41 0.50± 0.55 1.40± 0.55 Ballooning degeneration None (0) 0 0 0 0 2 (33%) 0 Few (1) 0 3 (50%) 5 (83%) 5 (83%) 3 (50%) 5 (100%) Many (2) 0 3 (50%) 1 (17%) 1 (17%) 1 (17%) 0 Mean score 0± 0.00 1.50± 0.55 1.16± 0.41 1.17± 0.41 0.83± 0.75 1.00± 0.00
Results were expressed as the mean± standard deviation (SD). Lobular inflammation was graded according to the number of inflammatory foci per 200 field (0 is no foci; 1 is <2 foci per 200 field, 2 is 2 to 4 foci per 200 field, 3 is>4 foci per 200 field); hepatocellular ballooning was graded as none, few balloon cells, and many cells/prominent ballooning (0 to 2). L, low-dose energy drink group; H, high-dose energy drink group; E, ethanol group; EL, ethanol plus low-dose energy drink group; EH, ethanol plus high-dose energy drink group.
variables such as steatosis and portal fibrosis were not evaluated for any of the liver tissue due to the short administration period.
Histological characteristics showed the high incidence of lobu-lar inflammation and ballooning degeneration in treated animals compared to controls. The lobular inflammation was observed in 5/6 of low-dose ED, high-dose ED, and ethanol-treated groups as well as 3/6 of ethanol plus low-dose ED exposed animals but not in controls. The lobular inflammation rates were highest in ethanol plus high-dose ED (6/6) group compared to other groups and 40% of them were categorized as having moderate inflamma-tion. These differences were significant in all treated groups for ballooning degeneration compared to the control group (Table 2).
Also, 33% of ethanol plus low-dose ED and 100% of all other treated groups showed the ballooning degeneration incidence with no such observation in controls (Table 2).
Most of the previous studies investigated the cognitive effects of EDs or their major components (for example, caffeine or taurine), alone or in combination with alcohol (Giles and others 2012; Franklin and others 2013; Alford and others 2001). This study was undertaken to assess the effect of ED alone and in combination with ethanol on oxidative stress and lipid peroxidation status in rat. In this study, because of having high sensitivity to ROS, consuming approximately 20% of the body’s total oxygen and being wealthy of polyunsaturated fatty acids, the brain was selected as one of our
A B C
D E F
Figure 3–Hepatocyte ballooning and lobular inflammation in liver tissues of rats exposed to energy drink and energy drink mixed with ethanol. (A) Control (×40), (B) low-dose energy drink (L) group (×100), (C) high-dose energy drink (H) group (×100); (D) ethanol (E) group (×100), (E) ethanol plus low-dose energy drink (EL) group (×100), and (F) ethanol plus high-dose energy drink (EH) group (×100). Marked areas show lobular inflammation.
Toxicol
og
y
&
Food
Sa
Table 2–Statistical significance of ballooning degeneration and lobular inflammation of liver between groups.
Pa Pb1-2 Pb1-3 Pb1-4 Pb1-5 Pb1-6 Pb2-3 Pb2-5 Pb3-6 Pb4-5 Pb4-6 Pb5-6
Lobular inflammation 0.001 0.047 0.011 0.047 0.452 0.000 0.989 0.818 0.721 0.818 0.368 0.038
Ballooning degeneration 0.000 0.000 0.002 0.002 0.038 0.012 0.799 0.150 0.100 0.800 0.100 0.012
Control: 1, L (low-dose energy drink): 2, H (high-dose energy drink): 3, E (ethanol): 4, EL (ethanol plus low-dose energy drink group): 5, EH (ethanol plus high-dose energy drink group): 6.
aDifferences between the 6 groups were evaluated with one-way ANOVA. bPost hoc tests (Tukey) were performed when the primary analysis was<0.05.
target organ. Also, it has lower levels of endogenous antioxidants compared to the other tissues (Abreu and others 2011). Having a special defense mechanism against ROS and being the main or-gan that metabolizes ethanol via alcohol dehydrogenase, aldehyde dehydrogenase, and cytochrome enzymes, the liver was selected as other target. The liver exposed to excessive amounts of alcohol undergoes numerous changes as a consequence of oxidative stress and inflammation (Ilaiyaraja and others 2011; Cichoz-Lach and Michalak 2014).
There are many ingredients in EDs which may be responsi-ble for oxidative consequences and liver toxicity, but these ef-fects are probably not attributable to a single ingredient of EDs. It might be caused by the mixture of many ingredients having high antioxidant capacity, or due to an augmented oxidative effect through synergistic interaction of them. Ingredients of ED used in this study were carbohydrates (10.8 g sucrose, 12.4 g glucose), sodium (as sodium citrate), antioxidants such as glucuronolactone (240 mg), inositol B8(only listed), caffeine (32 mg), taurine (400
mg), pyridoxine hydrochloride (B6; 2 mg, 100% of its
recom-mended daily allowance [RDA]), niacin (B3; 8 mg, 40% of its
RDA), and cyanocobalamin (B12; 2µg, 32% of its RDA) per 100
mL (Higgins and others 2010).
As suggested by Higgins and others (2010), a great majority of the ingredients in one can of these beverages (250 mL) are above the RDA values. According to The American Academy of Pedi-atrics, caffeine and other stimulants such as taurine, guarana, and so on, contained by EDs have no place in the diet of children and adolescents. Therefore, there is no reported RDA value for these stimulants. Some studies have suggested that caffeine is responsi-ble for major toxicity (Seifert and others 2013) and conclusions about glucuronolactone are not clear due to limited human data (Abreu and others 2011). In our study, we cannot attribute the toxicological findings to any of the ingredient specifically.
ROS have some physiological functions including cellular de-fense against microorganisms, and adaptive responses. During these physiological functions, some of the radicals can escape from an-tioxidant defense system. Therefore, exogenous anan-tioxidant sup-plementation can protect cells against ROS. However, overcon-sumption of them could lead to a state of “antioxidative stress,” where antioxidants might attenuate or block adaptive cellular stress responses. In addition, antioxidative stress may interfere with en-dogenous physiological defense mechanisms decreasing the level of free radicals which are necessary for cellular protection (Poljsak and Milisav 2010). In this study we suggest that the combina-tion of antioxidant substances through ED intake results in an “antioxidative stress.” This status may be explained by decreased SOD activity in brain tissue of the low-dose ED and high-dose ED exposed group in our study. This reduction was significant in high-dose ED exposed rats’ brain tissue. Zeid´an-Chuli´a and oth-ers (2013) studied the cellular response to ED and its components in Human Neuronal SH-SY5Y cell line. They identified that ED components alone or together induced a significant decrease in
cellular SOD and CAT activities. These authors suggested that the decrease of basal free radical generation due to the strong antioxi-dant effect of ED downregulates the cellular enzymatic antioxiantioxi-dant defense which subsequently drives a cytotoxic response.
It is well known that ethanol consumption increases the produc-tion of ROS and enhances oxidative damage in many tissues (Jing and others 2012; Reedy and others 2013). However, data on the effects of alcohol exposure on SOD, CAT, and GSH-Px activity are discordant, with results having been reported as increase, no change, or decrease (Grasselli and others 2014). In this study, the ethanol treated group exhibited significantly increased SOD and GSH-Px activity in brain tissue compared to the control group. Although not statistically significant, slight increases in SOD, CAT, and GSH-Px activity were observed in liver tissue of the ethanol exposed group. These findings may indicate increased production of SOD to combat ROS production from ethanol exposure.
Increased liver MDA levels in the ED exposed groups of this study may be similarly explained by decreased cellular defense mechanisms. As explained by Montoliu and others (1994), alco-hol apart from being a source of free radicals also disturbs the antioxidant defense system. The increased lipid peroxidation level observed in ED-ethanol co-exposed rats might be a consequence of increased free radical formation as well as the disruption of cel-lular antioxidant defense status. Findings on liver histopathology revealed that EDs may generate liver damage and the combined effect of ethanol and ED may produce greater damage than ei-ther treatment alone which is indicated by increased MDA level. Histopathological examination of brain tissue did not reveal any abnormality related to treatment. This may be due to the short period of exposure (14-d) which is not enough to produce brain damage.
Results of this study clearly revealed that oral administration of EDs and ethanol alone caused significant increases in oxida-tive stress and lipid peroxidation which was exaggerated after co-exposure. But, it is important to recognize that there are many ingredients in EDs, and these effects are difficult to assign to one specific ingredient. Also, it may be due to the combination of ingredients that augments the observed toxicity. These findings should cause major concerns about the impact of these beverages on public health. Further experiments are warranted to explain the effects of the other non-caffeine components in ED (includ-ing glucuronolactone, niacin and so on) when combined with ethanol or through interactions with each other on oxidative stress and lipid peroxidation.
Conclusion
These data suggest that ED consumption especially in exag-gerated amounts might be a risk factor for antioxidative stress, as indicated by decreased brain SOD activity. Also, the particu-lar combination of EDs’ ingredients may be responsible for the augmentation of oxidative stress parameters and histopathologi-cal abnormalities in liver and to some extent in brain tissue. Thus,
y
&
Chemical
Sa
fe
ty
consumption of EDs especially with alcoholic beverages appears to represent a significant public health concern due to the increased toxicological consequences both peripherally and centrally. On account of these toxicological findings, further researches and reg-ulations on marketed EDs and their combination with alcoholic beverages are needed.
Acknowledgment
This project was supported by the Scientific and Technological Research Council of Turkey (T ¨UB˙ITAK), 2209A.
Authors’ Contributions
R. Reis, M. Charehsaz, C¸ . Macit, and H. Akkaya designed the study. R. Reis, M. Charehsaz, and H. Sipahi interpreted the results. A.I. Do˘gan Ekici performed the histopathological evaluation. R. Reis, M. Charehsaz, and A. Aydın collected test data and drafted the manuscript.
References
Abreu RV, Silva-Oliveira EM, Moraes MF, Pereira GS, Moraes-Santos T. 2011. Chronic coffee and caffeine ingestion effects on the cognitive function and antioxidant system of rat brains. Pharmacol Biochem Behav 99:659–64.
Alford C, Cox H, Wescott R. 2001. The effects of Red Bull Energy Drink on human perfor-mance and mood. Amino Acids 21:139–50.
Attila S, C¸ akir B. 2011. Energy-drink consumption in college students and associated factors.
Nutrition 27:316–22.
Aydin A, Orhan H, Sayal A, Ozata M, Sahin G, Isımer A. 2001. Oxidative Stress and nitric oxide related parameters in type II diabetes mellitus: effects of glycemic control. Clin Biochem 34:65–70.
Bloomer RJ, Trepanowski JF, Farney TM. 2013. Infuence of acute coffee consumption on postprandial oxidative stress. Nutr Metab Insights 6:35–42.
Brunt Janney C, Di Bisceglie A. 1999. Neuschwander-Tetri B, Bacon B. Nonalcoholic steato-hepatitis: a proposal for grading and staging the histological lesions. Am J Gastroenterol 94:2467–74.
Campbell B, Wilborn C, La Bounty P, Taylor L, Nelson MT, Greenwood M, Ziegenfuss TN, Lopez HL, Hoffman JR, Stout JR, Schmitz S, Collins R, Kalman DS, Antonio J, Kreider RB. 2013. International Society of Sports Nutrition position stand: energy drinks. J Int Soc Sports Nutr 10:1–16.
Cicho˙z-Lach H, Michalak A. 2014. Oxidative stress as a crucial factor in liver diseases. World J Gastroenterol 20:8082–91.
Everitt H, Patel VB, Tewfik I. 2007. Nutrition and alcoholic liver disease, British Nutrition Foundation. Nutr Bull 32:138–44.
Franklin KM, Hauser SR, Bell RL, Engleman EA. 2013. Caffeinated alcoholic beverages— an emerging trend in alcohol abuse. J Addict Res Ther S4:015. Available from: http://dx.doi.org/10.4172/2155-6105.S4-012. Accessed 2016 December 2.
Giles GE, Mahone CR, Brunye TT, Gardony AL, Taylor HA, Kanarek RB. 2012. Differen-tial cognitive effects of energy drink ingredients: caffeine, taurine, and glucose. Pharmacol Biochem Behav 102:569–77.
Grasselli E, Compalati AD, Voci A, Vecchione G, Ragazzoni M, Gallo G, Borro P, Sumberaz A, Testino G, Vergani L. 2014. Altered oxidative stress/ antioxidant status in blood of al-coholic subjects is associated with alal-coholic liver disease. Drug Alcohol Depend 143:112– 19.
Higgins JP, Tuttle TD, Higgins CL. 2010. Energy beverages: content and safety. Mayo Clinic Proc 85:1033–41.
Howland J, Rohsenow DJ, Arnedt JT, Bliss CA, Hunt SK, Calise TV, Heeren T, Winet M, Littlefield C, Gottlie DJ. 2010. The acute effects of caffeinated vs. non caffeinated alcoholic beverages on driving performance and attention/reaction time. Addiction 106:335–41. Ilaiyaraja N, Khanum F. 2011. Amelioration of alcohol-induced hepatotoxicity and oxidative
stress in rats by acorus calamus. J Diet Suppl 8:331–45.
Jamall IS, Smith JC. 1985. Effects of cadmium on glutathione peroxidase, superoxide dismutase, and lipid peroxidation in the rat heart: a possible mechanism of cadmium cardiotoxicity. Toxicol Appl Pharmacol 80:33–42.
Jing L, Jin C, Li S, Zhang F, Yuan L, Li W Sang Y, Zhou L. 2012. Chronic alcohol intake-induced oxidative stress and apoptosis: role of cyp2e1 and calpain-1 in alcoholic cardiomyopathy. Mol Cell Biochem 359:283–92.
Lowry OH, Rosebrough NJ, Farr AL, Randall RJ. 1951. Protein measurement with the folin phenol reagent. J Biol Chem 193:265–75.
Marczinski CA, Fillmore MT, Henge AT, Ramsey MA, Young CR. 2013. Mixing an energy drink with an alcoholic beverage increases motivation for more alcohol in college students. Alcohol Clin Exp Res 37:276–83.
Marczinski CA. 2014. Combined alcohol and energy drink use: hedonistic motives, adenosine, and alcohol dependence. Alcohol Clin Exp Res 38:1822–5.
Miller KE. 2008. Energy drinks, race, and problem behaviors among college students. J Adolesc Health 43:490–7
Montoliu C, Valles S, Renau-Piquesras J, Guerii C. 1994. Ethanol-induced oxygen radical formation and lipid peroxidation in rat brain: effect of chronic ethanol consumption. J Neu-rochem 63:1855–62.
Novier A, Van Skike CE, Chin VS, Diaz-Granados JL, Matthews DB. 2012. Low and moderate doses of acute ethanol do not impair spatial cognition but facilitate accelerating rotarod performance in adolescent and adult rats. Neurosci Lett 512:38–42.
Park EJ, Bae E, Yi J, Kim Y, Choi K, Lee SH. 2010. Repeated-dose toxicity and inflammatory responses in mice by oral administration of silver nanoparticles. Environ Toxicol Pharmacol 30:162–8.
Poljsak B, Milisav I. 2012. The neglected significance of antioxidative stress. Oxid Med Cell Longev. Doi: 10.1155/2012/480895.
Reedy VD, Padmavathi P, Kavitha G, Saradamma B, Varadacharyulu N. 2013. Alcohol induced oxidative/nitrosative stress alters brain mitochondrial membrane properties. Mol Cell Biochem 375:39–47.
Seifert SM, Seifert SA, Schaechter Bronstein C, Benson BE, Hershorin ER, Arheart KL, Franco VI, Lipshultz SE. 2013. An analysis of energy-drink toxicity in the National Poison Data System. Clin Toxicol 51:566–74.
Souza MA, Mota BC, Gerbatin RR, Rodrigues FS, Castro M, Fighera MR, Royes LF. 2013. Antioxidant activity elicited by low dose of caffeine attenuates pentylenetetrazol- induced seizures and oxidative damage in rats. Neurochem Int 62:821–30.
Zeid´an-Chulia F, Gelain DP, Kolling EA, Rybarczyk-Filho JL, Ambrosi P, Teraa SR. 2013. Major components of energy drinks (caffeine, taurine and guarana) exert cytotoxic effects on human neuronal SH-SY5Y cells by decreasing reactive oxygen species production. Oxid Med Cell Longev. Doi: 10.1155/2013/791795.