EVALUATION OF AMMUNITION AND FUEL SUPPLY SYSTEMS
OF A TURKISH ARMORED BATTALION DURING
MOBILIZATION AND DEPLOYMENT USING SIMULATION
A THESIS
SUBMITTED TO THE DEPARTMENT OF INDUSTRIAL
ENGINEERING
AND THE INSTITUTE OF ENGINEERING AND SCIENCES
OF BILKENT UNIVERSITY
IN PARTIAL FULFILMENT OF THE REQUIREMENTS
FOR THE DEGREE OF MASTER OF SCIENCE
By
Aydın ÖZÇEVİK
July, 2002
I certify that I have read this thesis and in my opinion it is fully adequate, in scope and in quality, as a thesis for the degree of Master of Science.
... Assoc. Prof. İhsan Sabuncuoğlu (Principal Advisor)
I certify that I have read this thesis and in my opinion it is fully adequate, in scope and in quality, as a thesis for the degree of Master of Science.
... Assoc. Prof. Osman Oğuz
I certify that I have read this thesis and in my opinion it is fully adequate, in scope and in quality, as a thesis for the degree of Master of Science.
... Assoc. Prof. M. Selim Aktürk
Approved for the Institute of Engineering and Science ...
Prof. Mehmet Baray
ABSTRACT
EVALUATION OF AMMUNITION AND FUEL SUPPLY SYSTEMS
OF A TURKISH ARMORED BATTALION DURING
MOBILIZATION AND DEPLOYMENT USING SIMULATION
Aydın Özçevik
M.S. in Industrial Engineering
Advisor: Assoc. Prof. İhsan Sabuncuoğlu
July, 2002
In current wars, supply systems have become vital factors to reach military success. With improvements in technology, the capabilities and means of military units have also improved and as a result, the supply materials which military units require have also increased greatly. The timely delivery of supply materials to the combatant units is the key to success. The delivery of supply materials to combatant units at the right time and as needed can only be possible with the efficient planning of supply systems by staff officers. The insufficient evaluation of supply systems will cause interruptions in delivery of supply materials to combatant units and consequently prevent the combatant units from accomplishing their tasks.
In this study, the existing ammunition and fuel supply systems of an armored battalion before alarm order is evaluated via simulation. By using the simulation models which were coded for existing systems, commanders will have the capability to detect potential problems and take precautions. The main objectives of this study are: (1) To evaluate existing systems via simulation because of difficulties in executing real world systems due to impediments in creating real world conditions and also economic reasons. (2) To detect the factors which have significant effects on the existing system. (3) To foresee the probable problems of the existing system by studying the simulation model outputs using statistical methods. (4) To select the most critical region of Turkey according to performance measures of interest. The codes of models are created by using ARENA 3.0 simulation program and SIMAN programming language.
ÖZET
ALARM FAALİYETLERİ ESNASINDA BİR TÜRK TANK
TABURUNUN MÜHİMMAT VE YAKIT İKMAL SİSTEMLERİNİN
SİMÜLASYONLA ANALİZ EDİLMESİ
Aydın Özçevik
Endüstri Mühendisliği Bölümü Yüksek Lisans
Danışman: Doç. Dr. İhsan Sabuncuoğlu
Temmuz, 2002
Günümüz muharebelerinde ikmal sistemleri askeri başarının elde edilmesinde önemli faktörler haline gelmiştir. Gelişen teknoloji ile birlikte askeri birliklerin imkan ve kabiliyetleri de gelişmiş ve bunun sonucunda ihtiyaç duydukları ikmal maddelerinde de büyük bir artış olmuştur. İkmal maddelerinin muharip birliklere zamanında dağıtımı ordunun başarısı için çok önemlidir. İkmal maddelerinin zamanında ve tam olarak muharip birliklere dağıtılabilmesi ancak ikmal sistemlerinin karargah subayları tarafından iyi planlanması ile mümkün olabilir. İkmal sistemlerinin iyi analiz edilmemesi ikmal maddelerinin muharip birliklere ulaştırılmasında aksaklıklara sebep olacak ve neticede muharip birliklerin vazifelerini başarmalarını engelleyecektir.
Bu çalışmada, bir tank taburunun alarm emri öncesi kullandığı mevcut mühimmat
ve yakıt ikmal sistemleri simülasyon vasıtasıyla analiz edilmektedir. Komutanlar henüz barış zamanında iken mevcut sistemler için kurulan simülasyon modellerini kullanarak, mevcut sistemlerin icrasında karşılaşabilecekleri muhtemel problemleri önceden görme ve bunlara karşı tedbir alma imkanına sahip olacaklardır. Bu çalışmanın ana hedefleri: (1) Gerek gerçek koşulların oluşturulmasındaki güçlük ve gerekse maddi nedenler dolayısıyla tatbiki zor olan mevcut mühimmat ve yakıt ikmal sistemlerini simülasyon vasıtasıyla analiz etmek. (2) Sistemler üzerine etkili olan faktörleri tespit etmek. (3) Simülasyon modellerinin çıktılarını istatiksel metodlarla inceleyerek sistemlerdeki muhtemel problemleri önceden görmek. (4) Performans kriterlerine göre en kritik bölgeyi seçmektir. Modellerin kodları ARENA 3.0 simülasyon programı kullanılarak ve SIMAN dilinde yazılmıştır.
ACKNOWLEDGMENTS
I would like to express my deep gratitude to Assoc. Prof. İhsan Sabuncuoğlu for his guidance, attention, understanding and patience throughout this work.
I am grateful to the readers Assoc. Prof. Osman Oğuz and Assoc. Prof. M. Selim Aktürk for their valuable comments, kindness and time.
I can not fully express my gratitude and thanks to my parents and friends for their care, support and encouragement.
CONTENTS
List of Figures...…. X List of Tables... XII Glossary... XV
1. INTRODUCTION... 1
2. LITERATURE REVIEW...…...…... 10
2.1. Simulation Software and Methodology... 10
2.2. Military Simulation...…...……….. 11
2.3. Combat Modeling... 13
2.4. Military Logistics... 15
3. SIMULATION MODEL... 18
3.1. Formulation of the Problem and Planning the Study... 18
3.2. Why Simulation?... 20
3.3. Model Development... 21
3.3.1. Conceptual Model... 21
3.3.2. Logical Model... 29
3.3.3. Simulation Model (Computer Code)... 34
3.4. Input Data Analysis... 34
3.5. Verification and Validation of the Models... 37
3.5.1. Verification of the Models... 37
3.5.2. Validation of the Models... 38
4. DESIGN AND ANALYSIS OF EXPERIMENTS...……..….. 46
4.1. Factorial Designs and Analysis of Experiments...…...…...… 46
4.1.1. Determination of Sample Sizes...………... 47
4.1.2. Testing the Assumptions of Analysis of Variances... 48
4.1.3. Diagnostic Checking...…...……… 50
4.2.1. ANOVA Results and Interpretation of Main Effects and Interactions of Maximum
Time-in-System Measure for Model-1... 51
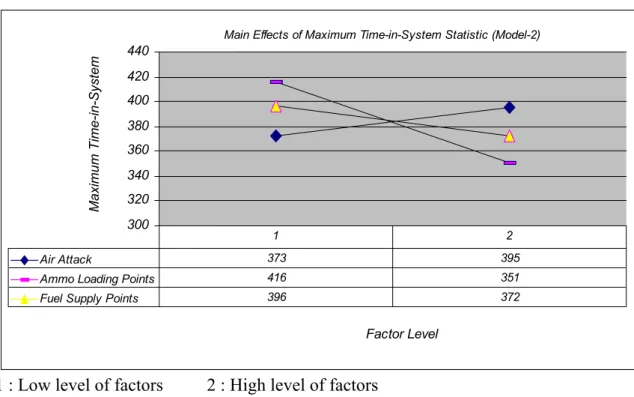
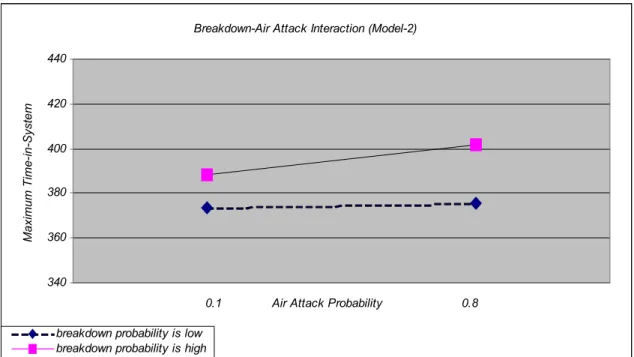
4.2.2. ANOVA Results and Interpretation of Main Effects and Interactions of Maximum Time-in-System Measure for Model-2...….….. 57
4.3. 25 Factorial Design for Number of Destroyed Vehicles Performance Measure... 60
4.3.1. ANOVA Results and Interpretation of Main Effects and Interactions of Number of Destroyed Vehicles Measure for Model-1... 60
4.3.2. ANOVA Results and Interpretation of Main Effects and Interactions of Number of Destroyed Vehicles Measure for Model-2...…...….…... 63
4.4. Determination of Time Standards of Existing Systems...…….…. 65
4.5. Conclusion...…...….……….…… 66
5. IMPLEMENTATION OF RANKING PROCEDURES FOR THE REGIONS OF TURKEY...…...….…………...…… 70
5.1. Introduction...…...….………. 70
5.2. Ranking of Regions by Rinott Procedure………...…………... 72
5.2.1. Ranking of Regions by Rinott Procedure According to Maximum Time-in-System Performance Measure (Model-1)………. 73
5.2.2. Ranking of Regions by Rinott Procedure According to Number of Destroyed Vehicles Performance Measure (Model-1)………..…… 75
5.2.3. Ranking of Regions by Rinott Procedure According to Maximum Time-in-System Performance Measure (Model-2)………. 76
5.2.4. Ranking of Regions by Rinott Procedure According to Number of Destroyed Vehicles Performance Measure (Model-2)………..………... 78
5.2.5. Summary of Rinott Procedure Results………. 79
5.3. Solution of Multiple Objective Problem... 80
5.3.1. Ranking of Regions by AHP Technique (Model-1)... 82
5.3.2. Ranking of Regions by AHP Technique (Model-2)... 84
6. CONCLUSION... 88
6.1. General...…...……….……….. 88
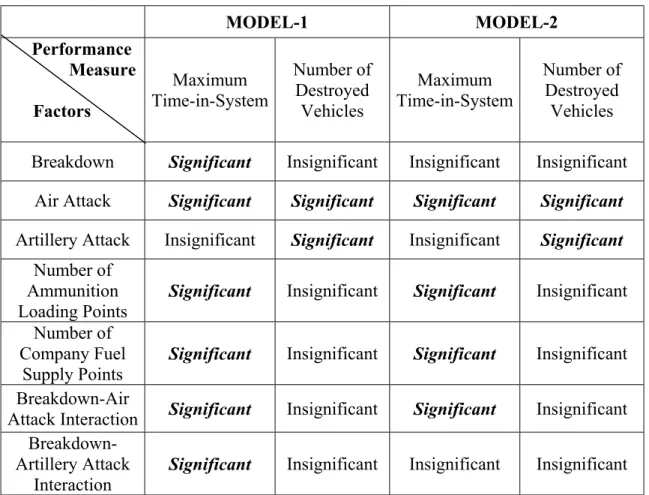
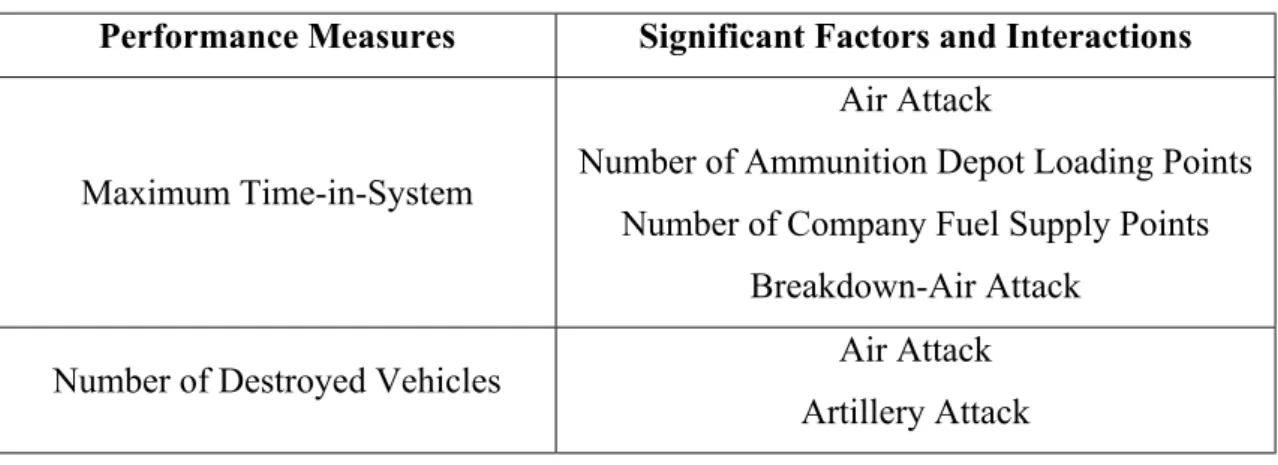
6.2. Significant Factors and Interactions on Performance Measures... 89
6.3. Time Standards of Existing Systems... 91
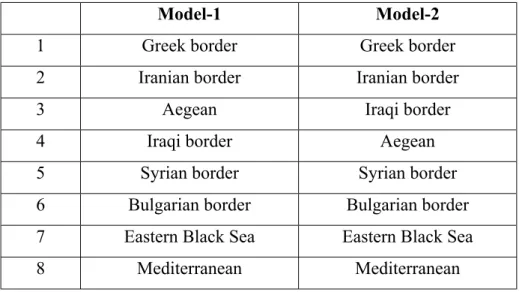
6.4. Ranking of Regions of Turkey...…...…….…… 92
6.5. Comparison of System-1 and System-2... 94
6.6. Future Research Topics...…...………. 95
Bibliography……… 96
Appendices...…...…...………...…… 99
Appendix-A: Detailed Flowcharts for Model-1 and Model-2... 100
Appendix-B: Design Points and Results of Replications for Experimental Design... 108
Appendix-C: ANOVA Tables of Performance Measures... 117
Appendix-D: Residual Analysis and Scatter Plots of Residuals... 125
Appendix-E: Analysis of Normal Probability Plots and Effects of Measures... 133
Appendix-F: Scatter Plots of Variances of Performance Measures... 141
Appendix-G: Part of Codes for Model-1 and Model-2... 145
Appendix-H: Structure of an Armored Battalion... 149
Appendix-I: Pairwise Comparison and Normalized Matrices... 150
LIST OF FIGURES
1.1. Ammunition and fuel supply flow in system-1... 6
1.2. Ammunition and fuel supply flow in system-2... 8
3.1. Simplified flowchart of system-1... 30
3.2. Simplified flowchart of system-2... 32
3.3. A view from animation of model-1... 44
3.4. Statistics collected for model-1... 44
3.5. A view from animation of model-2... 45
3.6. Statistics collected for model-2... 45
4.1. Main effect diagram of significant factors for maximum time-in-system (model-1)... 52
4.2. Interaction diagram of breakdown-air attack for maximum time-in-system (model-1)... 54
4.3. Interaction diagram of breakdown-artillery attack for maximum time-in-system (model-1)... 55
4.4. Main effect diagram of significant factors for maximum time-in-system (model-2)... 58
4.5. Interaction diagram of breakdown-air attack for maximum time-in-system (model-2)... 59
4.6. Main effect diagram of significant factors for number of destroyed vehicles (model-1)... 62
4.7. Main effect diagram of significant factors for number of destroyed vehicles (model-2)... 64
A.1. Detailed flowchart of system-1... 100
A.2. Detailed flowchart of system-2... 104
D.1. Scatter plot of residuals for maximum time-in-system statistics (model-1)... 126
D.2. Scatter plot of residuals for maximum time-in-system statistics (model-2)... 128
D.3. Scatter plot of residuals for number of destroyed vehicles statistics (model-1)... 130
D.4. Scatter plot of residuals for number of destroyed vehicles statistics (model-2)... 132
E.1. Normal probability plot of maximum time-in-system statistics (model-1)... 134
E.3. Normal probability plot of number of destroyed vehicles statistics (model-1)... 138
E.4. Normal probability plot of number of destroyed vehicles statistics (model-2)... 140
F.1. Scatter plot of variances of maximum time-in-system measure (model-1)... 141
F.2. Scatter plot of variances of maximum time-in-system measure (model-2)... 142
F.3. Scatter plot of variances of number of destroyed vehicles measure (model-1)... 143
LIST OF TABLES
2.1. Summary table of related literature... 17
3.1. Maintenance times of wheeled vehicles... 35
3.2. Maintenance times of armored vehicles... 35
3.3. Ammunition loading times... 36
3.4. Fuel supply times... 36
3.5. Destruction probabilities of enemy weapons... 37
4.1. Factors and their levels... 46
4.2. Bartlett Test results for maximum time-in-system statistics... 49
4.3. Bartlett Test results for number of destroyed vehicles statistics... 49
4.4. Confidence interval of maximum time-in-system statistics for model-1... 65
4.5. Confidence interval of maximum time-in-system statistics for model-2... 66
4.6. Significant factors and interactions... 67
5.1. Ranking of regions according to maximum time-in-system statistics (model-1)…….. 73
5.2. Ranking of regions according to number of destroyed vehicles statistics (model-1)… 75 5.3. Ranking of regions according to maximum time-in-system statistics (model-2)….…. 77 5.4. Ranking of regions according to number of destroyed vehicles statistics (model-2)… 78 5.5. Rinott procedure results for model-1... 79
5.6. Rinott procedure results for model-2... 80
5.7. Relative weights of criteria... 82
5.8. Ranking of regions by AHP (model-1) ... 83
5.9. Ranking of regions by AHP (model-2) ... 84
5.10.AHP results of model-1 and model-2... 85
6.1. Significant factors and interactions on performance measures (model-1)... 89
6.2. Significant factors and interactions on performance measures (model-2)... 90
6.3. Summary table of ranking of regions according to Rinott Procedure results……..….. 92
6.4. Summary table of ranking of regions according to AHP results………... 93
B.1. Factor names and design points for performance measures... 108
B.2. Averages and variances of 15 replications for maximum time-in-system (model-1)... 109
B.4. Averages and variances of 15 replications for number of destroyed
vehicles (model-1)... 113
B.5. Averages and variances of 10 replications for number of destroyed vehicles (model-2)... 115
C.1. Effects and ANOVA results for maximum time-in-system statistics (model-1)... 117
C.2. Effects and ANOVA results for maximum time-in-system statistics (model-2)... 118
C.3. Effects and ANOVA results for number of destroyed vehicles statistics (model-1)... 119
C.4. Effects and ANOVA results for number of destroyed vehicles statistics (model-2)... 120
C.5. SPSS output of maximum time-in-system statistics (model-1)... 121
C.6. SPSS output of maximum time-in-system statistics (model-2)... 122
C.7. SPSS output of number of destroyed vehicles statistics (model-1)... 123
C.8. SPSS output of number of destroyed vehicles statistics (model-2)... 124
D.1. Residual analysis for maximum time-in-system statistics (model-1)... 125
D.2. Residual analysis for maximum time-in-system statistics (model-2)... 127
D.3. Residual analysis for number of destroyed vehicles statistics (model-1)... 129
D.4. Residual analysis for number of destroyed vehicles statistics (model-2)... 131
E.1. Analysis of normal P-P plot effects of maximum time-in-system statistics (model-1)... 133
E.2. Analysis of normal P-P plot effects of maximum time-in-system statistics (model-2)... 135
E.3. Analysis of normal P-P plot effects of number of destroyed vehicles statistics (model-1)... 137
E.4. Analysis of normal P-P plot effects of number of destroyed vehicles statistics (model-2)... 139
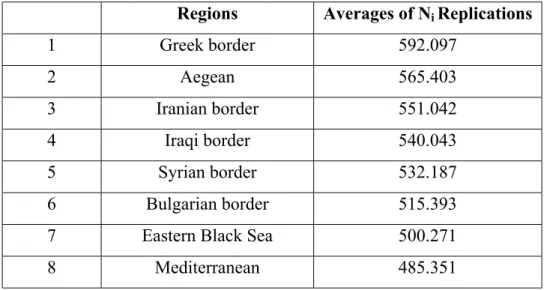
J.1. Averages and variances of 15 replications according to maximum time-in-system statistics for regions (model-1) ... 155
J.2. Total sample sizes (Ni) needed for each region and averages of total sample sizes according to maximum time-in-system statistics (model-1) ... 155
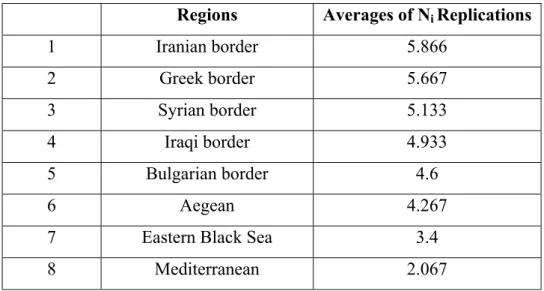
J.3. Averages and variances of 15 replications according to number of destroyed vehicles statistics for regions (model-1)... 156
J.4. Total sample sizes (Ni) needed for each region and averages of total sample sizes
according to number of destroyed vehicles statistics (model-1)………... 156
J.5. Averages and variances of 15 replications according to maximum time-in-system
statistics for regions (model-2) ... 157 J.6. Total sample sizes (Ni) needed for each region and averages of total sample sizes
according to maximum time-in-system statistics (model-2)……….. 157
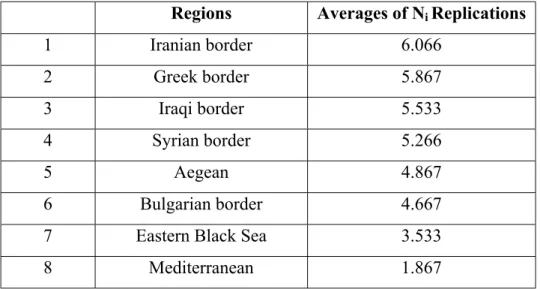
J.7. Averages and variances of 15 replications according to number of destroyed
vehicles statistics for regions (model-2) ... 158 J.8. Total sample sizes (Ni) needed for each region and averages of total sample sizes
GLOSSARY
Alert Dispersion Area: Area where the troops spread to minimize the casualties during enemy attack.
Ammunition: Military stores, especially of explosives (shells, bombs, etc.) to be used against the enemy.
Armored Vehicle: A vehicle covered with metal sheeting for protection and equipped with special guns.
Battalion: An army unit made of several companies and forming part of a brigade. Company: Subdivision of a battalion, commanded by a captain.
Convoy: To travel, especially said of motor vehicles, in a procession for safety and convenience.
Field Manual: Military publication for use by military personnel explaining tactics and techniques of any military activity.
Logistics: The science of planning and carrying out the movement and maintenance of forces.
Maintenance: Maintenance is the function of sustaining material (weapon systems, components, spares, support equipment) and facilities in an operational status; restoring them to a serviceable condition; or upgrading their functional utility through modification. Mobilization: A situation in which the power, sources and mainly the military forces of the country are prepared, gathered, arranged and used for the needs of a war and in which the rights and liberties are limited partially or wholly.
CHAPTER 1
INTRODUCTION
The purpose of the supply systems is to provide the supply materials to the military units on time and in order. Any delay or disorder in distribution of supply materials to military units because of improper functioning of supply systems can prevent military units from carrying out their missions. The timely delivery of supply materials to forces in the field is the key to success of military units’ missions. In the Turkish military, there are five classes of supply materials (Kara Kuvvetleri Lojistik Faktörler Yönergesi, 1994) and these supply materials are as follows:
Class-I : This class includes subsistence items and health and welfare items.
Class-II : This class includes items of equipment, other than principal items, that are prescribed in authorization and allowance tables. Individual tools and tool sets, individual equipment and clothing items, batteries and housekeeping supplies are in this class of supply.
Class-III : This class comprises all types of petroleum products. All types of motorin, benzin jet fuel, lubricants, greases, hydraulic fluids, antifreeze materials and firewoods are considered as class-III supply materials.
Class-IV : This class comprises materials that are used for special duties.
Class-V : This class comprises all ammunition items (small arms, artillery and tank rounds, mines and demolotions, fuzes, missiles and bombs).
In our study we only focus on two classes of supply materials. These are Class-ІІІ and Class-V supply materials. Class-ІІІ supply materials provide mobility of military units and Class-V supply materials provide the fire power. Our systems are subsystems
of the Army Logistics System which aims to support the soldier in the field on time and with the required amount of supply materials. The Army Logistics System connects all logistics activities and establishes a framework of fundamental logistics principles which helps the army to accomplish its mission. The models of our systems are examples of combat simulation because they include combat activities like enemy air and artillery attack.
In this study, we model the ammunition and fuel supply systems of one of the armored battalions in the Turkish Army during mobilization and deployment using simulation. We study the following two systems which are used in the Turkish military:
• Ammunition and fuel supply of an armored battalion at supply points (System-1).
• Ammunition and fuel supply of an armored battalion by ammunition trucks and fuel tankers at alert dispersion areas (System-2).
We develop simulation models of these systems because of their importance in achieving military objectives. Improper functioning of systems would cause delays in carrying out military objectives and also increase personnel casualties and number of destroyed vehicles if the battalion is under enemy threat. In our study, the armored battalion under consideration is positioned close to a regional border and under enemy threat.
In this study, we aim to reach our following objectives: (1) To examine the behaviors of these two existing systems. (2) To detect the factors which have significant effects on existing systems. (3) To find time standards of existing systems. (4) To rank the regions of Turkey from most to least critical according to performance measures of interest.
As a member of the North Atlantic Treaty Organization (NATO), the Turkish military uses NATO standards and unit structures. In a Turkish armored battalion there are four companies. The main firepower of the battalion is provided by three identical armored companies and these companies are supported by Headquarters Company. The structure of an armored battalion is presented in Appendix-H. In our models, the distance between company alert dispersion areas and garages is 400 meters. The distance between garages and the ammunition depot is 8 km. The distance between the ammunition depot and fuel supply points is 1 km.
Military units have two main activities when tension between two countries increases and a would-be conflict is imminent. The first one is to disperse vehicles at alert dispersion areas as soon as possible so as not to be a mass target in case of a sudden enemy attack. The second one is to complete supply material needs of personnel and vehicles as soon as possible. At peace times, armored vehicles are unloaded of ammunition because of safety reasons. In our models, the ammunition of armored vehicles is preserved in the ammunition depot of the battalion and the ammunition of small arms (i.e. rifles) is preserved in ammunition trucks. When military tension between two countries increases, companies distribute the ammunition of small arms to company personnel as soon as possible. In our study, we only deal with ammunition loading of armored vehicles. We assume that armored and wheeled vehicles are half fueled because we can not be sure about the level of fuel in each vehicle. The level of fuel in a vehicle tank would change according to its daily consumption. In real life, ammunition depots and fuel supply points are highly protected against enemy attacks. In our study, we assume that there is a strong air defense system against enemy planes around the ammunition depot and fuel supply points.
System-1, ammunition and fuel supply of armored battalion at supply points, starts with the order of battalion commander. In this existing system, armored and wheeled vehicles travel to supply points for ammuniton and fuel supply. After the order of the battalion commander, companies of the battalion start preparations. Ammunition of small arms is distributed and vehicle crews start to prepare their vehicles to travel to supply points. When preparations are done, each company’s armored vehicles convoy to the ammunition depot via preplanned company pathes. The armored vehicles of Headquarters Company convoy with the armored vehicles of armored companies to the ammunition depot. Wheeled vehicles also convoy to company fuel supply points in company formation. Armored vehicles queue close to the ammunition depot which has two loading points according to the priority of their companies’ tasks in battalion plans. In our study, the queue order of companies for ammunition supply is 1st Company, 2nd Company and 3rd Company. At the ammunition depot, the loaded armored vehicle immediately travels to its company fuel supply point and queues with other wheeled or armored vehicles. At fuel supply points company wheeled vehicles wait for the completion of the rest of company wheeled vehicles’ fuel supply and when all are fueled, wheeled vehicles convoy to the company alert dispersion area. Armored vehicles also convoy after fueling to company alert dispersion area. The system ends when all undestroyed armored and wheeled vehicles of the battalion arrive to alert dispersion areas. During convoys, some stochastic events like breakdowns, enemy air attacks and enemy artillery attacks can occur. These events can damage or destroy vehicles during convoy and delay the supply activity, hence the mission success of the armored battalion. When a vehicle is destroyed by enemy attack or breakdown it is taken off the road, not to create traffic congestion. If it is damaged by enemy attack or breakdown, a vehicle crew
tries to repair the vehicle. If it can not be repaired, then a maintenance team is called. The ammunition and fuel supply flow in System-1 can be seen in Figure 1.1.
System-2, ammunition and fuel supply of armored battalion by ammunition trucks and fuel tankers, also starts with the order of the battalion commander. The main difference of this system from System-1 is the distribution of supply materials to armored and wheeled vehicles. Only supply vehicles from Headquarters Company convoy to supply points and then transport supply materials to alert dispersion areas. After the order of the battalion commander, the ammunition trucks and fuel tankers from Headquarters Company complete their preparations to convoy to supply points. At the same time, the rest of the armored and wheeled vehicles of the battalion travel to company alert dispersion areas so as not to be a mass target at garages. All of the ammunition trucks responsible for transportation of ammunition to any company of the battalion convoy to the ammunition depot and all of the fuel tankers responsible for fuel supply of any company of battalion convoy to the company fuel supply point. At the ammunition depot, ammunition trucks are loaded according to the priority of each companies’ tasks. After ammunition trucks are loaded, they convoy to company alert dispersion areas. They unload their ammunition at the company alert dispersion areas then proceed to Headquarters Company alert dispersion area. Armored vehicles’ crews start to load their vehicles and then wait for the fuel supply process. Fuel tankers first fuel wheeled vehicles of companies at alert dispersion areas and then fuel armored vehicles. Fuel tankers also travel to the Headquarters Company alert dispersion area when all fuel supply activity is completed. During travel, some stochastic events like breakdowns, air and artillery attacks can occur. These events can damage or destroy supply vehicles during convoys. If an ammunition truck or fuel tanker is destroyed and
Headquarters Company-3 Company-2 Company-1 Company Fuel Supply Fuel Supply Fuel Supply
Armored Vehicle Path
Wheeled Vehicle Path
Figure 1.1. Ammunition and Fuel Supply Flow in System-1
Company-3 Alert Dispersion A. Company-2 Alert Dispersion A. Company-1 Alert Dispersion A. Headquarters C. Garage Company-3 Garage Company-2 Garage Company-1 Garage
Battalion Ammunition Depot
Headquarters Company Alert Dispersion Area
can be safely moved, then it is taken off the road. If it is not safe to move because of fire or explosion, then necessary safety measures are taken and other supply vehicles are directed to alternate safe paths. The supply materials are distributed accordingly at alert dispersion areas despite the loss of ammunition or fuel because of enemy attacks. If the supply vehicles are destroyed on the way to supply points, then spare supply vehicles are sent to supply points. When an ammunition truck or fuel tanker is damaged, the vehicle driver first tries to repair the vehicle and if he can not repair the damage, then a maintenance crew is called. These events can delay the supply activity, hence the mission success of the armored battalion. The armored and wheeled vehicles at alert dispersion areas are also under enemy threat. They can be destroyed or damaged by enemy attacks but these events do not cause important delays in the system since these vehicles had already been at alert dispersion areas before enemy attacks occured. The system ends when all undestroyed vehicles are supplied at alert dispersion areas. The ammunition and fuel supply flow in System-2 can be seen in Figure 1.2.
We study the systems via simulation because of the difficulties in creating real world war conditions such as air and artillery attacks. Simulation also enables us to include stochastic events such as vehicle maintenance and breakdown. Finally, simulation is far more economical than exercising the systems in the field. We use Arena 3.0 simulation program in our study because it is a powerful and flexible tool with animation capabilities.
The rest of the thesis is organized as follows: In Chapter 2 we present the relevant literature with the simulation software and methods; general supply system applications in the field of military logistics similar to our systems; the requirements of military simulation modeling; combat modeling applications. In Chapter 3, we describe existing
Headquarters Company-3 Company-2 Company-1 Company Fuel Supply Fuel Supply Fuel Supply
Ammunition Truck Path
Fuel Tanker Path
Armored and Wheeled Vehicle Path
Figure 1.2. Ammunition and Fuel Supply Flow in System-2
Headquarters Company Alert Dispersion Area
Company-3 Alert Dispersion A. Company-2 Alert Dispersion A. Company-1 Alert Dispersion A. Headquarters C. Garage Company-3 Garage Company-2 Garage Company-1 Garage
Battalion Ammunition Depot
systems. The conceptual models of existing systems, verification and validation of models are explained in this chapter. In Chapter 4, we give the design and analysis of experiments. The results of the statistical analyses are also presented in this chapter. In Chapter 5, we rank the regions of Turkey from most to least critical according to performance measures of interest. The results of simulation study and future research suggestions are given in Chapter 6.
CHAPTER 2
LITERATURE REVIEW
In the literature review we could not find a study which considers all aspects of ammunition and fuel supply systems of an armored battalion. Our systems are military logistics systems which operate under enemy threat. In this chapter, we review some studies about combat modeling because our models include combat activities such as enemy air and artillery attacks. We also review some of the studies related military logistics because our models include distribution activities of supply materials. We organize this chapter as follows:
• Simulation software and methodology • Military simulation
• Combat modeling • Military logistics
2.1. Simulation Software and Methodology
While building the simulation models and performing some of the analyses of the outputs, we used ARENA 3.0 and its output Analyzer, which is a product of Systems Modeling Corporation. Takus and Profozich (1997) explain the ARENA software and its capabilities in their tutorial.
Jennifer Chew and Cindy Sullivan (2000) explain the activities and tasks during the early stages of model development and address each of Verification, Validation and Accreditation (VV&A) efforts separately, along with its associated activities. They
outline the specific VV&A activities and products that are appropriate to each phase of model development.
Law and Kelton (1991) explain the timing and relationships of validation, verification and establishing credibility, and discuss guidelines for determining the level of model detail and some techniques for verification and validation.
Don Coughlin (2000) explains an integrated approach to VV&A from a system perspective and identifies the relationships between the M&S resources in an integrated VV&A program.
Balci Osman (1998) explains how to create sufficiently valid models and principles of verification and validation.
Sargent (1998) explains various verification and validation techniques and discusses conceptual model validity, model verification and data validity.
Alexopoulos and Seila (1998) explain techniques and procedures dealing with
output data analysis.
Law and Kelton (1991) explain some comparison techniques and describe ranking and selection procedures.
2.2. Military Simulation
In this section, we present the papers related with military modeling and simulation. These papers provide insights regarding military simulation theory and the underlying limitations assocatiated with them. We use guidance from them to define our models and better understand the problems we could encounter before creating the models.
Metz Micheal (2000) focuses on Joint Warfare System (JWARS) verification and validation processes. JWARS users include the United States Joint Staff, regional military commanders, the office of secretary of defense, and military Joint Task of Forces.
Grabau M. and Payne M. (2000) provide planners to assess critical factors such as transportation network constraints, equipment reliability and maintainability, varying task times and the effects of air interdiction.
Raymond R.Hill, J.Miller and Gregory A. (2001) discuss the uses of military simulation and the issues associated with military simulation to include categorizations of various types of military simulation.
Garrabrants (1998) proposes an expansion of simulation systems’ roles to support all levels of command and control functioning. He explains how Marine Tactical Warfare Simulation is used to model all aspects of combat.
Hartley (1997) stresses on the difficulties, methods and cost of the military simulation studies and presents the comparison of military simulation studies with others in terms of verification, validation and accreditation.
Robinson Stewart (1997) provides an understanding of how simulation models can be verified and validated. He aims to show where Verification and Validation (V&V) fit within the overall modelling process and to describe various methods of V&V.
Sisti (1996) deals with a wide variety of research issues in simulation science being presented by government, academia, industry and their application to the military domain.
Smith (1998) provides a brief historical introduction and goes on with essential methods necessary for modern military training simulations in his study. He stresses on the importance of modeling the right problem while mentioning the fundamental principles of military modeling.
Kang and Roland (1998) stress on the differences of military simulation and classify the military simulation models in their study. They provide some explanations about simulation as a training tool and also mention a war-gaming model of joint theater-level simulation.
Pace (1993) discusses naval modeling and simulation verification, validation and accreditation. He reviews VV&A processes developed as interim policy guidance for navy managed models and simulations.
2.3. Combat Modeling
In this section, we review studies of combat modeling because our models include combat activities such as enemy air and artillery attacks. Few declassified papers are available in the field of combat modeling due to the highly sensitive nature of the information. The combat activities in our models, air and artıllery attacks, are highly anticipated in a typical war. These papers help us integrate these anticipated combat activities into our models.
Müslüm and Sabuncuoğlu (2002) develop a simulation model of mobilization and deployment activities of one of the armored battalions in the Turkish Army that includes loading of vehicles, marching to alert dispersion area, and marching to the assembly area under enemy attack. The authors measure the combat readiness of an armored battalion. Specifically, they present a decision support tool for armored battalion commanders to
observe the troop behavior in a computer-simulated environment before the war. Of all the studies from the literature review, this paper provided the most applicable combat modeling information for our study. Similarities include stochastic events such as air and artillery attacks, the same armored battalion structure and analysis of critical regions in Turkey. Their study does not include logistics activities such as ammunition loading and fuel supply. Our study attempts to capture this feature of mobilization and deployment planning for a Turkish Armored Battalion using the same ARENA 3.0 simulation software.
Parker (1995) explains a unique approach developed for analyzing force structures of the armed forces of United States of America. With this approach, combat readiness is measured to ensure armed forces remain ready to fight despite military drawdown.
Childs and Lubaczewski (1987) propose a simulation model used for training Brigade and Battalion commanders and their staff to improve their decision-making skills.
Henry (1994) describes the Corps Battle Simulation as a standard tool for training commanders and their staff. He also stated the hardware and evaluation of the Corps Battle Simulation.
Youngren, Parry, Gaver and Jacobs (1994) describe research conducted at the Naval Postgraduate School into new methodologies for joint theater-level combat simulation modeling.
Blais (1994) gives the description of a computer assisted, two-sided warfare gaming system designed to support training of U.S. Marine Corps commanders and their staffs.
Mostaglio, Johnson and Peterson (1993) give an overview of a distributed interactive simulation training system used in the army called the close combat tactical trainer. They discuss how protocol standards within its program architecture will ensure its long term training success.
Oswalt Ivar (1995) presents the technologies critical to military simulation. He proposes technologies that are likely to be applied in future military simulations, and concludes with a review of two current simulation architectures-SIMOBJECT and J-MASS.
Kathman (1995) explains the processes and techniques of data collection in field combat simulation with particular attention to data requirements, operational environment, and instrumentation. He describes four basic types of instrumentation that have been developed to assist data collection in field combat simulation.
2.4. Military Logistics
In this section, we review some studies about military logistics because our models include distribution activities of supply materials. These papers show specific applications for fuel and ammunition supply systems even though they are in separate military branches. We expand our search of supply systems beyond ammunition and fuel. These papers highlight the areas of ammunition and fuel supply systems and help us create valid models for our existing systems.
Parsons and Krause (1999) introduce the Tactical Logistics and Distribution Systems (TLOADS) simulation model that is a tool to study the delivery of logistics material to U.S. Marine Expeditionary Forces. This tool tries to provide inexpensive,
flexible and frequent evaluations of new logistics delivery tactics and logistics material transport vehicles.
Parker and Williams (1997) introduce a model to develop alternative approaches to Air Force logistics support strategies. The model makes it possible to evaluate the steady state flow of fuel and ammunition.
Parker (1990) developes a simulation model capable of analyzing the deployment strategies of combat, combat support and service support units. The model is developed on the deployment of the field artillery ammunition carrying vehicles to an ammunition supply.
Table 2.1. Summary Table of Related Literature
CLASSIFICATION PUBLICATION SUBJECT
Takus and Profozich (1997) ARENA software tutorial Don Coughlin (2000) An integrated approach to VV&A of models and simulations Jennifer and Cindy (2000) VV&A in the life cycle of models
Sargent (1998) V&V of simulation models
Simulation Software and Methodology
Kelton (1997) Statistical analysis of simulation output Grabau and Payne (2000) Predicting enemy force closure with
simulation
Metz Micheal (2000) Joint warfare system verification and validation lessons learned Raymond Hill, Miller and
Gregory (2001)
Applications of discrete event simulation modeling to military
problems
Garrabrants (1998) Simulation as a mission planning and rehearsal tool Hartley (1997) V&V in military simulations Oswalt Ivar (1995) Technology trends in military simulation
Sisti (1996) Modeling and simulation technologies for military applications Smith (1998) Essential techniques for military
modeling and simulation Kang and Roland (1998) Military simulation
Military Simulation
Pace (1993) Naval modeling and simulation VV&A Parker (1995)
Military force structure and realignment through dynamic
simulation
Childs and Lubaczewski (1987) A battalion/brigade training simulation
Henry (1994) The Corps battle simulation Blais (1995)
Scalability issues in enhancement of the MAGTF tactical warfare
simulation
Kathman (1985) Data collection in field combat Youngren and Parry (1993) The future theater-level combat
Mostaglio,Johnson and Peterson (1993)
The close combat tactical training program
Combat Modeling
Müslüm and Sabuncuoğlu (2002)
Evaluation of Mobilization and Deployment Plan of an Armored
Battalion
Parker (1990) Ammunition upload and deployment Parker and Williams (1997) Integrating logistics support operations
Military Logistics
Parsons and Krause (1999) Tactical logistics and distribution systems simulation
CHAPTER 3
THE SIMULATION MODEL
3.1. Formulation of the Problem and Planning the Study
We develop the models of ammunition and fuel supply systems of an armored battalion during mobilization and deployment using simulation to enable commanders to examine the behaviors of existing systems before conducting real exercises. The systems we analyze in this study are:
• Ammunition and fuel supply of an armored battalion at supply points (System-1) • Ammunition and fuel supply of an armored battalion by ammunition trucks and
fuel tankers at alert dispersion areas (System-2)
In this study we have the following objectives: (1) To examine the behaviors of the existing systems by constructing valid models of systems. (2) To detect the factors which have significant effects on existing systems. (3) To find time standards of existing systems. (4) To rank the regions of Turkey from most to least critical according to performance measures of interest.
We have two main performance measures in our study for both models. These performance measures are maximum time-in-system and number of destroyed vehicles. Maximum time-in-system is the time the last battalion vehicle arrives at the alert dispersion area after supply activity. Both performance measures have vital importance in the military since they affect the course of war. By using our simulation models, we try to answer the following questions:
• Do the systems operate efficiently?
• How do vehicle breakdowns, enemy air attacks and enemy artillery attacks affect the system performances?
• What are the significant factors on performance measures?
• Which region of Turkey is the most critical region against enemy air and artillery attacks?
• What is the ranking of regions of Turkey according to maximum time-in-system performance measure?
We study the systems under war conditions and we need the following data in our simulation models.
For Model-1,
• Velocity of armored vehicles. • Velocity of wheeled vehicles.
• Ammunition loading time of an armored vehicle. • Fuel supply time of an armored vehicle.
• Fuel supply time of a wheeled vehicle.
• Maintenance times for vehicles due to vehicle breakdowns, air attacks and artillery attacks.
For Model-2,
• Velocity of ammunition trucks. • Velocity of fuel tankers.
• Ammunition loading and unloading times of ammunition trucks. • Fuel supply time of a fuel tanker.
• Maintenance times for vehicles due to vehicle breakdowns, air attacks and artillery attacks.
• Ammunition loading time of an armored vehicle. • Fuel supply times of armored and wheeled vehicles.
By using the models, the military planners can examine the physical behaviors of systems with the help of animation. The models can be adapted to model other supply systems of the army using the flexibility of Arena software. The end users of this study are the armored battalion commanders.
3.2. Why Simulation?
We model the existing systems and analyze them by using simulation for the following reasons:
• The systems under study have many stochastic features such as vehicle breakdowns, enemy air attacks and maintenance times for damages due to enemy attacks.
• Because of economic reasons and difficulties creating real world conditions, it is almost impossible to exercise the systems in the field.
• Simulation enables us to analyze different policies and system alternatives in our study.
• Simulation enables us to animate our models. Animations of our models greatly assist in the models’ validation and also help present our models to other people. • By using simulation we compare different scenarios of existing systems in the
• Simulation enables us to train military personnel in a safe environment.
3.3. Model Development
The first step in model building consists of observing the real system and the interactions among its various components and collecting data on its behavior. The second step in model building is the construction of a conceptual model (a collection of assumptions on the components and the structure of the system, plus hypotheses on the values of model input parameters). The third step is the translation of the operational model into the computerized model. (Banks, Carson, and Nelson, 1999)
We form the conceptual models of our real systems by data gathered from the experts of supply systems and also from users of the systems. The warfare related data are taken primarily from army publications. We interviewed personnel responsible for ammunition depot and fuel supply points to obtain information about ammunition loading and fuel supply processes. We also interviewed maintenance personnel to gather maintenance times for possible damages and squadran leaders for insights about difficulties during supply activities. After we gathered enough data about real systems, we developed the logical model (flowchart) of the systems to show relationships among the elements of the models. We then wrote the code of simulation models by using the Arena 3.0 simulation program.
3.3.1. Conceptual Model
“The construction of a model is probably as much art as science. The art of modeling is enhanced by an ability to abstract the essential features of the problem, to
select and modify basic assumptions that characterize the system, and then to enrich and elaborate the model until a useful approximation results” (Banks, Carson, Nelson, 1999).
A conceptual model is not intended to be a design for a system to simulate the real world. Rather, it provides an organised way for an analyst to document the workings of the system of interest and a framework for the modeller to document the system. Only objects necessary for understanding of the system need to be documented.
To examine the essential components and structures of the real world systems under consideration, we devise conceptual models of these real world systems. In our study the real world systems of interest are:
• Ammunition and fuel supply of an armored battalion at supply points (System-1). • Ammunition and fuel supply of an armored battalion by ammunition trucks and
fuel tankers at alert dispersion areas (System-2).
We present the basic elements of our simulation models in the following: Events
Common Events for Model-1 and Model-2
• Breakdown of vehicles.
• Maintenance of broken vehicles. • Artillery attack of enemy.
• Loading of ammunition to armored vehicles. • Air attack of enemy.
• Damage of vehicles because of enemy attacks.
Unique Model-1 Events
• Departure of armored and wheeled vehicles to supply points. • Arrival of armored vehicles to ammunition depot.
• Arrival of wheeled vehicles to fuel supply points. • Fuel supply to armored and wheeled vehicles.
• Departure of vehicles to alert dispersion areas from supply points. • Arrival of vehicles to alert dispersion areas.
Unique Model-2 Events
• Departure of ammunition trucks and fuel tankers to supply points.
• Departure of armored and wheeled vehicles to company alert dispersion areas. • Arrival of armored and wheeled vehicles to company alert dispersion areas. • Arrival of ammunition trucks to ammunition depot.
• Arrival of fuel tankers to fuel supply points. • Loading of ammunition to ammunition trucks. • Fuel supply to fuel tankers.
• Departure of ammunition trucks and fuel tankers to alert dispersion areas from supply points.
• Arrival of ammunition trucks and fuel tankers to alert dispersion areas. • Unloading of ammunition from ammunition trucks.
• Fuel supply to armored and wheeled vehicles by fuel tankers. • Completion of ammunition loading to armored vehicles. • Completion of fuel supply to armored and wheeled vehicles.
• Departure of ammunition trucks and fuel tankers to Headquarters Company alert dispersion area.
• Arrival of ammunition trucks and fuel tankers to Headquarters Company alert dispersion area.
Entities
Common Entities for Model-1 and Model-2
• Armored vehicles. • Wheeled vehicles.
Unique Model-2 Entities
• Fuel tankers.
• Ammunition Trucks. Activities
Common Activities for Model-1 and Model-2
• Ammunition loading to armored vehicles. • Fuel supply to armored and wheeled vehicles. • Convoy of vehicles.
• Breakdowns of vehicles. • Enemy attacks.
• Maintenance.
Unique Model-2 Activities
• Ammunition loading to ammunition trucks. • Fuel supply to fuel tankers.
Attributes
Common Attributes for Model-1 and Model-2
• Company identification numbers. • Convoy identification numbers. • Fuel level of vehicles.
• The beginning time of supply activity.
Exogenous Variables (Input Variables)
a)
Decision Variables (Controllable Variables)Common Decision Variables for Model-1 and Model-2
• Number of loading points at ammunition depot. • Number of fuel supply points per company.
Unique Model-1 Decision Variables
• Velocity of wheeled and armored vehicles.
• The vehicle convoy formation (in company or squadran formation).
Unique Model-2 Decision Variables
• Velocity of ammunition trucks and fuel tankers.
• Capacity of ammunition trucks and fuel tankers.
b) Parameters (Uncontrollable Variables)
Common Parameters for Model-1 and Model-2
• Ammunition loading time of an armored vehicle. • Fuel supply time of an armored vehicle.
• Maintenance times for vehicle damages due to enemy air attack and artillery attack.
• Distances between supply points, garages and alert dispersion areas.
Unique Model-1 Parameters
• Number of armored and wheeled vehicles.
Unique Model-2 Parameters
• Ammunition loading time of an ammunition truck. • Fuel supply time of a fuel tanker.
• Number of ammunition trucks and fuel tankers. • Ammunition unloading time of an ammunition truck.
Endogenous Variables (Output Variables) a) State variables
Common State Variables for Model-1 and Model-2
• State of ammunition loading units. • State of fuel supply units.
Unique Common State Variables for Model-1
• Number of armored vehicles in ammunition queue. • Number of vehicles in fuel supply queues.
Unique Common State Variables for Model-2
• Number of ammunition trucks in ammunition queue. • Number of fuel tankers in fuel supply queues.
• Number of armored vehicles in ammunition queues at alert dispersion areas. • Number of vehicles in fuel supply queues at alert dispersion areas.
b) Performance measures
Common Performance Measures for Model-1 and Model-2
• Maximum time-in-system (the time the last battalion vehicle occupied its position at the alert dispersion area after supply activities).
• Number of destroyed vehicles.
• Number of broken vehicles because of vehicle breakdowns. • Number of damaged vehicles because of enemy attacks. • Utilization of the ammunition loading units.
• Utilization of fuel supply units.
Unique Model-1Performance Measures
• Average time-in-system of an armored vehicle. • Average time-in-system of a wheeled vehicle.
• Average waiting time of an armored vehicle in ammunition queue.
• Average waiting time of a vehicle (armored and wheeled) in fuel supply queue. • Average number of armored vehicles at ammunition depot.
• Average number of vehicles (armored and wheeled) at fuel supply point.
Unique Model-2 Performance Measures
• Average time-in-system of an ammunition truck. • Average time-in-system of a fuel tanker.
• Average waiting time of an ammunition truck in ammunition queue.
• Average waiting time of an armored vehicle in ammunition queue at alert dispersion area.
Assumptions
Common Assumptions for Model-1 and Model-2
• Basic unit is company.
• Armored Battalion is an independent mission battalion.
• In the beginning all armored vehicles are unloaded of ammunition.
• The personnel in charge at supply points are well trained and there is no accident because of personnel mistakes.
• There is a strong air defense system at supply points against enemy air attacks.
Unique Model-1 Assumptions
• The ammunition loading will be carried out by the sequence of 1st, 2nd and 3rd armored companies at the ammunition depot.
• In the beginning all wheeled and armored vehicles are half fueled. • Velocity of armored vehicles is 25km/hour.
• Velocity of wheeled vehicles is 40km/hour.
Unique Model-2 Assumptions
• In the beginning all wheeled and armored vehicles are half fueled. • The weight of an ammunition box (two shells in one box) is 70 kg. • Velocity of ammunition trucks is 30 km/hour.
3.3.2. Logical Model
In this section, we explain the logic of Model-1 and Model-2. In Model-1, our entities are armored and wheeled vehicles. After it starts, entities resembling wheeled vehicles convoy to fuel supply station and entities resembling armored vehicles convoy to the ammunition supply station. During convoy some entities go through breakdown or artillery attacks according to probabilities given in the model. Those entities which experience the breakdown or artillery attacks are delayed by the time depending on minor, medium or severe damage status or disposed from the system when completely destroyed. At the end, armored vehicle entities arrive at the ammunition supply station while wheeled vehicle entities arrive at the fuel supply station. Armored vehicle entities are delayed at ammunition supply station before convoying to the fuel supply station and queing behind the wheeled vehicle entities. Meanwhile, wheeled vehicle entities are delayed at the fuel supply station before convoying to alert dispersion area station. Armored vehicle entities are delayed after completion of wheeled vehicle entities fueling. Armored vehicle entities convoy to alert dispersion area station after the delay. Some armored and wheeled vehicle entities go through breakdown or air attack stations during convoy to the alert dispersion area station. Those entities which experience the breakdown or air attacks are delayed by the time depending on minor, medium, or severe damage status or disposed from the system when completely destroyed. The last entity to reach the alert dispersion area station completes the model. We present the simplified flowchart of Model-1 in Figure 3.1 and detailed flowchart of Model-1 in Appendix-A.
In Model-2, our entities are armored vehicles, wheeled vehicles, ammunition trucks and fuel tankers. After the model starts, entities resembling wheeled and armored vehicles convoy to alert dispersion area station and do not visit any stations during the
Ammunition and Fuel Supply of an Armored Battalion at Supply Points
Figure 3.1. Simplified Flowchart of System-1
START
Battalion commander orders for ammunition and fuel supply
Armored vehicles convoy to ammunition depot Wheeled vehicles convoy to fuel supply points Does breakdown or
artillery attack occur? YES
If shot or broken, are vehicles repairable? NO Move vehiclesoff road Repair Continue to convoy to supply points N O Y E S Armored vehicle convoys arrive to ammunition depot Wheeled vehicle convoys arrive to fuel supply points
Are all armored
vehicles loaded? NO Wait until all loaded Y E S Convoy to fuel supply points
Are all vehicles
fueled? NO Wait until all fueled Y E S Convoy to alert dispersion areas Does breakdown or
air attack occur? YES
If shot or broken, are vehicles repairable? NO Move vehiclesoff road Repair Continue to convoy to alert dispersion areas N O Y E S STOP
Occupy alert dispersion areas and continue preparations until alarm
convoy. They wait at the alert dispersion area station until ammunition truck and fuel tanker entities arrive. Meanwhile, ammunition truck entities convoy to the ammunition supply station and fuel tanker entities convoy to the fuel supply station. During convoy some ammunition truck and fuel tanker entities go through breakdown or artillery attack stations according to probabilities given in the model. Those entities which experience the breakdown or artillery attacks are delayed by the time depending on minor, medium, or severe damage status or disposed from the system when completely destroyed. At the end, ammunition truck and fuel tanker entities arrive at the supply stations. Ammunition truck entities are delayed at the ammunition supply station while fuel tanker entities are delayed at the fuel supply station. After supply activity delays, entities convoy to the alert dispersion area station to supply armored and wheeled vehicle entities. Some ammunition truck and fuel tanker entities go through breakdown or air attack stations during convoy to the alert dispersion area station. Those entities which experience the breakdown or air attacks are delayed by the time depending on minor, medium, or severe damage status or disposed from the system when completely destroyed. Ammunition truck and fuel tanker entities are delayed to unload their supply material before travelling to alert dispersion area station. The last entity to arrive to the alert dispersion area station completes the model. We present the simplified flowchart of Model-2 in Figure 3.2 and detailed flowchart of Model-2 in Appendix-A.
Figure 3.2. Simplified Flowchart of System-2
Ammunition and Fuel Supply of an Armored Battalion by Ammunition Trucks and Fuel Tankers START
Battalion commander orders for ammunition and fuel supply
Ammunition trucks and fuel tankers are prepared to convoy to supply points
Armored and wheeled vehicles convoy to alert dispersion areas and continue preparations until supply vehicles arrive
Ammunition trucks convoy to ammunition depot Fuel tankers convoy to fuel supply points YES NO Move vehicles off road Y E S Repair Continue to convoy to supply points Ammunition trucks arrive to ammunition depot Fuel tankers arrive to fuel supply points Are company ammunition trucks loaded?
NO until all Wait loaded
Y E S
Are all company fuel tankers fueled?
Convoy to alert dispersion areas NO Y E S Wait until all fueled Convoy to alert dispersion areas 1 Does breakdown or artillery attack occur?
If shot or broken, are vehicles repairable?
Figure 3.2. Simplified Flowchart of System-2 (cont’d) 1
Ammunition trucks unload ammunition at alert dispersion areas
Fuel tankers fuel vehicles at alert dispersion areas Is all ammunition unloaded? NO Wait for unloading to be completed Y E S
Ammunition trucks convoy to Headquarters Company alert dispersion area
Are all vehicles
fueled? NO Wait until all fueled Y E S
Fuel tankers convoy to Headquarters Company alert dispersion area
STOP
Occupy alert dispersion areas and continue preparations until alarm
order is given YES NO Move vehicles off road Y E S Repair Continue to convoy to alert dispersion areas Does breakdown or
air attack occur?
If shot or broken, are vehicles
3.3.3. Simulation Model (Computer Code)
In our study we use ARENA 3.0 software for the simulation codes of existing systems. Arena software has the capability of creating animated models and is a flexible tool. We have two models in our study. The model of ammunition and fuel supply of an armored battalion at supply points, Model-1, and the model of ammunition and fuel supply of an armored battalion by ammunition trucks and fuel tankers at alert dispersion areas, Model-2. Some details are as follows:
• Technical information about Model-1
Size of model : 3.64 MB
Total number of lines : 460 Siman lines • Technical information about Model-2
Size of model : 4.21 MB
Total number of lines : 633 Siman lines
We present some parts of the computer codes of Model-1 and Model-2 in Appendix-G.
3.4. Input Data Analysis
There are three probability distributions which are often used in absence of data or limited data. These distributions are the uniform, triangular and beta distributions. The uniform distribution can be used when an interarrival or service time is known to be random, but no information is immediately available about the distribution. The triangular distribution can be used when we have some information about the minimum, maximum and modal values of the random variable. The beta distribution provides a variety of distributional forms on the unit interval which with appropriate modification can be shifted to any desired interval (Pegden, Shannon and Sadowski, 1995).
In our case, since we do not have actual data for war conditions, we use triangular distributions. The parameters of the distribution functions are obtained from army field manuals and defense ministry publications. For data concerning ammunition and fuel supply activities in war conditions, we use Kara Kuvvetleri Lojistik Faktörler Yönergesi (Turkish Army Logistics Procedures) which is mainly used for logistics calculations for the Turkish Army. We interviewed expert personnel from ammunition and fuel supply activities in the army. We also interviewed maintenance personnel for technical information and staff officers for tactical information.
We present the parameters of triangular distribution for maintenance times of wheeled vehicles in Table 3.1 and maintenance times of armored vehicles in Table 3.2.
Table 3.1. Maintenance Times of Wheeled Vehicles
Damage Type
Minor Damage Medium Damage Severe Damage
Vehicle Breakdown Tria (10,15,20) Tria (25,30,35) Tria (40,45,50)
Air Attack Tria (30,35,40) Tria (35,40,45) Tria (50,55,60)
Artillery Attack Tria (20,25,30) Tria (35,40,45) Tria (50,55,60)
Table 3.2. Maintenance Times of Armored Vehicles
Damage Type
Minor Damage Medium Damage Severe Damage
Vehicle Breakdown Tria (15,20,25) Tria (30,35,40) Tria (45,50,55)
Air Attack Tria (35,40,45) Tria (40,45,50) Tria (55,60,65)
The parameters of distribution functions of ammunition loading times and fuel supply times are obtained by interviewing expert personnel at supply activities and studying Kara Kuvvetleri Lojistik Faktörler Yönergesi (Turkish Army Logistics Procedures, 1994). We present ammunition loading times in Table 3.3 and fuel supply times in Table 3.4.
Table 3.3. Ammunition Loading Times
Vehicle Loading Time
Armored Vehicle Tria (20,25,30)
Ammunition Truck Tria (65,75,85)
Table 3.4. Fuel Supply Times
Vehicle Fuel Supply Time
Wheeled Vehicle Tria (1,3,6)
Armored Vehicle Tria (4,7,10)
We take destruction probabilities of enemy air and artillery weapons from the
JANUS database (http://www-leav.army.mil/nsc/famsim/janus/index.htm) software, the
war simulation package which is used to model combat field activities. In our study, we use the ARENA software because JANUS is only used for combat activities. JANUS is effective for battle-focused training from platoon to brigade level and for command and battle staff training. We not only deal with combat activies in our study but also logistics activities. ARENA allows us to model logistics activities and also combat activities. Logistics activities include the storage, movement, distribution, maintenance, evacuation, and disposition of material; evacuation and hospitalization of personnel; construction,
maintenance, operation, and disposition of facilities. We present destruction probabilities of enemy weapons in Table 3.5.
Table 3.5. Destruction Probabilities of Enemy Weapons
Wheeled Vehicles Armored Vehicles
Enemy War Plane Cannon (30 mm) 0.65 0.55
Enemy Artillery Cannon (155 mm) 0.5 0.35
3.5. Verification and Validation of the Models
In this section, we discuss whether our simulation models operate correctly and whether they simulate their real-world counterparts. Verification and validation of the model is one of the challenging tasks for the model developer.
3.5.1. Verification of the Models
Verification is the process of determining whether a model operates as intended. The purpose of model verification is to ensure that the conceptual model is reflected accurately in the computerized representation. In this section, the computer programs representing existing systems are verified by techniques recommended by (Banks, Carson and Nelson, 1999) and by techniques stated in Department of the Army Pamphlet 5-11 (1999).
• Debugging : We used Arena debugger so as not to make logical mistakes when building our models. By applying the debugging process, we test our models to reveal