Enhancement of Formic Acid Dehydrogenation Selectivity of
Pd(111) Single Crystal Model Catalyst Surface via Brønsted Bases
Bartu Karakurt,
†Yusuf Kocak,
†and Emrah Ozensoy
*
,†,‡†Chemistry Department, Bilkent University, 06800 Ankara Turkey
‡UNAM-National Nanotechnology Center, Bilkent University, 06800 Ankara, Turkey
*
S Supporting InformationABSTRACT: The influence of ammonia (NH3) on the
doubly deuterated formic acid (DCOOD, FA) dehydrogen-ation selectivity for a Pd(111) single crystal model catalyst surface was investigated under ultrahigh vacuum conditions using programmed desorption and temperature-programmed reaction spectroscopy techniques. NH3 adsorp-tion on Pd(111) revealed reversible, molecular desorpadsorp-tion without any significant decomposition products, while DCOOD adsorption on Pd(111) yielded D2, D2O, CO, and CO2 as a result of dehydration and dehydrogenation pathways. Functionalizing the Pd(111) surface with ammonia suppressed the FA dehydration and enhanced the dehydro-genation pathway. The boost in the FA dehydrodehydro-genation of
Pd(111) in the presence of NH3can be linked to the ease of FA deprotonation as well as the stabilization of the decomposition intermediate (i.e., formate) due to the presence of ammonium counterions on the surface. In addition, the presence of a H-bonded ammonia network on the Pd(111) surface increased the hydrogen atom mobility and decreased the activation energy for molecular hydrogen desorption. In the presence of NH3, catalytic FA decomposition on Pd(111) also yielded amidation reactions, which further suppressed CO liberation and prevented poisoning of the Pd(111) active sites due to strongly bound CO species.
1. INTRODUCTION
Various recent energy forecasts predict that the global energy need will continue to grow with an increasing pace in the forthcoming century.1Thus, developing sustainable and renew-able alternatives for energy harvesting will continue to be a critical challenge. Hydrogen-based energy technologies are among the most promising alternative energy technologies, as they are clean, sustainable, and environmentally and ecologically friendly.2 A major drawback of hydrogen-based energy applications is fuel storage. Since gaseous hydrogen has a very low mass density (0.089 kg/m3at STP), storing hydrogen in a gaseous form brings about numerous cost, safety, and ergonomic disadvantages. A number of alternative hydrogen-containing chemicals have been proposed in order to store and release hydrogen, most of which suffered from low hydrogen storage capacity and slow hydrogen generation kinetics under ambient conditions.2 Formic acid (FA) is a widely studied and a promising hydrogen-based energy vector, since (i) it possesses a relatively high hydrogen weight percent (i.e., 4.4 wt %), (ii) it is in a liquid form under ambient conditions, and (iii) it has low toxicity andflammability.3,4Furthermore, FA can be obtained from naturally abundant sources such as CO25,6and renewable biomass feedstocks.7These features make hydrogen production from FA a favorable option to be used in hydrogen energy applications. Catalytic decomposition of FA occurs via two
competing pathways, namely the (1) dehydrogenation and (2) dehydration pathways. Since the FA dehydration pathway does not yield any H2, the catalytic selectivity toward H2is governed by the dominance of dehydrogenation over dehydration. Furthermore, CO generated through the dehydration pathway also binds to catalytically active precious metal sites (e.g., Pd) in an extremely strong and irreversible manner at room temper-ature, leading to permanent site blocking and catalytic poisoning.8−11 Hence, the dehydration pathway not only decreases the catalytic selectivity but also suppresses the overall long-term catalytic activity.
G HCOOH→H2+CO2 Δ °298 K = −33.0 kJ mol· −1 (1) G HCOOH→CO+H O2 Δ °298 K = −13.0 kJ mol· −1 (2)
FA decomposition on several group-VIII transition-metal surfaces such as Pd,12−16 Rh,17−19 Ru,20,21 Pt,22−24 Cu,25−27 Co,28 Ag,29 and their bimetallic combinations30 has been extensively studied under ultrahigh vacuum (UHV) conditions.
Received: September 13, 2019 Revised: November 2, 2019 Published: November 5, 2019
Article pubs.acs.org/JPCC
Cite This:J. Phys. Chem. C 2019, 123, 28777−28788
It has been reported that one of the key aspects associated with the catalytic action of these metal surfaces is the ability of these metal surfaces to stabilize the main FA decomposition intermediate, i.e., formate.31 In addition to UHV studies on two-dimensional planar model catalyst surfaces, numerous large surface area32−35 and core/shell36−38 catalysts containing various transition-metal active sites have also been investigated, revealing high activity and selectivity toward FA dehydrogen-ation.
Pd is known to be one of the most active catalytic metals that can renewably generate ultrahigh purity hydrogen from biomass side products such as FA.38−41In such heterogeneous catalytic systems, additional bases are often introduced into the reaction medium in order to initiate the reaction. Furthermore, catalytic sites/promoters/support surfaces are also frequently function-alized with basic groups in order to enhance the catalytic H2 production selectivity.
Earlier UHV studies showed that coordinatively unsaturated group-VIII transition-metal single crystal surfaces were not able to carry out the HCOOH dehydrogenation selectively. For instance, it was shown that Pd(100) decomposed HCOOH unselectively to yield excessive amounts of CO along with H2.13,15,16In accordance with these observations, Barteau et al. reported that a clean Ag(110) surface did not react with FA.29 On the other hand, various other experimental studies reported that many high-coordination group-VIII transition-metal single crystal surfaces were able to carry out FA dehydrogenation effectively.12,18,20,22,23Thesefindings were also supported by the DFT study of Jin et al., which compared the reactivities of Pd(111) vs Pd(100) in FA dehydrogenation and reported a higher dehydrogenation capability for Pd(111).42 It has also been shown that creating Lewis basic surface oxygen species on transition-metal catalyst surfaces enhanced the dehydrogenation selectivity of FA decomposition.12,18,22 In one of our former reports,39we showed that a large surface area powder catalyst containing PdAg bimetallic nanoparticle (NP) active sites promoted with MnOxdomains dispersed on amine-function-alized SiO2supports revealed extraordinarily high activity and selectivity in FA dehydrogenation, where amine functionaliza-tion resulted in a drastic increase in the H2+ CO2gas production rate. It should be noted that the promoting effect of Brønsted bases in FA dehydrogenation is not unique for Pd active sites. For instance, Yadav et al. also demonstrated that the presence of amine (−NH2) groups grafted on the support material can turn Au nanoparticles, which are relatively inactive in FA dehydrogenation, into significantly active catalysts by improving the FA adsorption through a process called “strong metal-molecular support interaction” (SMMSI).43Similarly, Mori et al. showed that Pd−Ag NP catalysts inside a −N(CH3)2 -functionalized polymer matrix had a significantly higher H2 conversion than Pd−Ag NPs inside other matrices with different functional groups.34These studies clearly indicate that Brønsted acid/base chemistry can be effectively utilized in order to improve H2 production from FA. However, current literature lacks detailed molecular-level fundamental studies focusing on the effect of Brønsted bases on the selective dehydrogenation of FA on atomically well-defined group-VIII single crystal metal surfaces.
Therefore, in this study, the effect of NH3on the selective dehydrogenation of doubly deuterated FA (i.e., DCOOD) on Pd(111) was investigated. The utilization of DCOOD allowed us to monitor the FA decomposition products in a more precise manner and enabled us to differentiate the particular
contributions of DCOOD and NH3to H2generation. In the current work, we first investigate the individual adsorption/ desorption behavior of NH3 and DCOOD on Pd(111) as a function of the adsorbate coverages via temperature-pro-grammed desorption (TPD). Then, we focus on the interaction
between DCOOD and NH3 on Pd(111) by performing
temperature-programmed reaction spectroscopy (TPRS) ex-periments, where DCOOD was adsorbed on Pd(111), which was initially exposed to varying coverages of NH3in an attempt to elucidate the influence of the presence of Brønsted bases in FA dehydrogenation on Pd(111). The results presented in the current work reveal valuable molecular-level insights regarding the fundamental understanding of the effectiveness of Brønsted bases in the dehydrogenation processes of FA, which can also be extended to other organic acids and carboxylated oxygenates. 2. EXPERIMENTAL SECTION
Experiments were conducted in a custom-made UHV chamber, which had a base pressure of 3× 10⁻¹⁰Torr. The chamber was equipped with X-ray photoemission spectroscopy (XPS, Riber Mg/Al dual anode with a Riber EA150 electron energy analyzer), custom-made low energy electron diffraction (LEED), infrared reflection absorption spectroscopy (IRAS), TPD, and TPRS modules. A quadrupole mass spectrometer (QMS, Ametek Dycor Dymaxion DM200) and a PID-controlled linear sample heater (Heatwave, model 101303) were used for the TPD/TPRS experiments. All of the TPD/ TPRS experiments were performed with a heating rate of 1 K/s, 70 eV QMS ionization energy, and 30 ms dwell time for each TPD desorption channel. A Pd(111) single crystal sample (10 mm diameter× 1 mm thickness disc, polished on both sides, purity >99.999%, MaTeck GmbH) was affixed on Ta wires, which enabled cooling of the sample with liquid nitrogen to 90 K and heating to 1073 K via resistive heating. The temperature of the sample was measured using a K-type thermocouple (thickness: 0.005 in., Omega Inc.) that was spot-welded on the lateral facet of the Pd(111) disc. Before each experiment, the Pd(111) sample surface was cleaned by using various methods depending on the extent of contamination present on the surface of the Pd(111) sample. Thefirst method consisted of multiple cleaning cycles, where Pd(111) was exposed to O2(g) (Linde AG, purity≥ 99.999%) using a dedicated high precision leak valve (PO2= 1.0× 10⁻⁸Torr, 5 min at 600 K) and subsequently annealed at 727 K for 3 min in vacuum. In the second method, after exposing the Pd(111) sample to the conditions given above, the sample wasflash-heated to 1000 K and then exposed to Ar+ sputtering (Ar(g), Linde AG, purity≥99.999%) with a sputtering gun (LK Technologies, NGI3000, 1.5 kV× 15 mA) at room temperature (RT), followed by annealing at 1000 K in UHV for 2 min. The third method included Ar+sputtering at RT, followed by annealing at 1000 K in UHV for 2 min. The cleanliness of the Pd(111) surface was checked by performing blank TPD experiments, where the m/z = 28 desorption channel was monitored to verify the absence of strongly bound CO species on the surface before conducting the experiments.
NH3(g) (Linde AG, purity≥99.995%) was delivered on the clean Pd(111) sample using a dedicated high precision leak valve. DCOOD (Cambridge Isotopes Laboratories Inc., formic acid-D2, D > 98%, D2O < 5%) wasfirst transferred into a UHV-compatible glass bulb in a glovebox to avoid H2O and CO2 contaminations from the atmosphere, and the container bulb was covered with aluminum foil to prevent photochemical reactions. Before each FA experiment, a fresh dose of The Journal of Physical Chemistry C
DOI:10.1021/acs.jpcc.9b08707
DCOOD(g) was introduced in the UHV chamber through a dedicated DCOOD dosing line, since DCOOD is known to decompose upon its long-term interaction with stainless steel.12 In the current work, exposures of the adsorbate species (ε) are given in units of Langmuir (L, 1 L = 1× 10⁻⁶Torr·s) and the surface coverages (θ) of the corresponding adsorbates are given in monolayer equivalents (MLE).
3. RESULTS AND DISCUSSION
3.1. Ammonia Adsorption on Pd(111). The NH3-TPD profiles were obtained by dosing various exposures of NH3onto the clean Pd(111) model catalyst surface at 90 K.Figure 1shows the corresponding data for the m/z = 17 desorption channel, while some of the other possible decomposition products were
also monitored by following m/z = 2 (H2) and m/z = 28 (N2) desorption channels (Figure S1). These experiments revealed that (within the current detection limits) ammonia was adsorbed and desorbed from the clean Pd(111) surface in a molecular and reversible process without dissociation. The NH3-TPD profiles given in Figure 1 suggest that at least 3 different ammonia desorption states are discernible. The first state is the low-coverage α1 state, which has a desorption maximum at 279 K. With an increasingθNH3, theα1state starts to broaden toward lower temperatures. The second submonolayer desorption state which is denoted asα2starts to appear around 0.6 MLE and reaches its desorption maximum around 164 K. A further increase in θNH3 leads to the formation of the α3
Figure 1.TPD profiles (m/z = 17) obtained after adsorption of NH3at 90 K on clean Pd(111) as a function of increasing NH3coverage.
Figure 2.(a) TPD profiles of DCOOD adsorption on clean Pd(111) with a DCOOD exposure of εDCOOD= 2× 10⁻²L at 123 K. Note that some of the TPD signals are multiplied with the given factors for clarity. (b) m/z = 2 desorption channel from a blank (control) TPD experiment on a freshly cleaned Pd(111) surface in the absence of any intentionally added adsorbates.
The Journal of Physical Chemistry C Article
DOI:10.1021/acs.jpcc.9b08707
desorption state at 127 K. The general features of the NH3-TPD profiles on the clean Pd(111) surface given inFigure 1are in very good agreement with the TPD data obtained from other face centered cubic (FCC) single crystal metal surfaces such as Rh(111),44Au(111),45Pt(111),46Ag(111),47Ni(111),48and Ru(0001).49The broadening of the TPD signals in Figure 1
toward low temperatures can be explained by the presence of the repulsive interactions between the adsorbed ammonia mole-cules on Pd(111) and the existence of dissimilar adsorption sites and adsorption configurations. These observations are in accordance with the computational work of Salli et al., suggesting multiple ammonia adsorption states on the FCC (111) transition-metal surfaces and the presence of repulsive intermolecular interactions between NH3molecules during the monolayer formation.50InFigure 1, theα1desorption state can be assigned to the chemisorbed NH3species on the Pd(111) surface, since it is known that, at low coverages, ammonia is coordinated strongly to the metal surfaces predominantly through its lone pair electrons.44−46,49The second
submono-layer desorption state (α2), appearing at relatively higher coverages inFigure 1, was also reported by Fisher et al. on the Pt(111) surface46 and was assigned to the H-bonded chemisorbed NH3 species, which were less tightly bound to the Pt(111) surface. In accordance with this observation, the lower-temperatureα2desorption state on Pd(111) was assigned to NH3 species that are more weakly interacting with the Pd(111) surface as a result of the H-bonding between the chemisorbed ammonia species. Finally, theα3desorption state can be assigned to the presence of the multilayer ammonia species, revealing a strong H-bonding network within the ammonia overlayer and a much weaker interaction with the Pd(111) surface due to the presence of the underlying ammonia monolayer. The TPD profiles given inFigure 1can also be used to estimate the relative ammonia coverages on the Pd(111) surface. In the literature, the saturation of the second NH3 desorption state was attributed to the saturation coverage of the first adsorption overlayer.44,46
Hence, in the current work, the integrated desorption signal of the red curve given inFigure 1
was assigned to 1 MLE coverage, as this curve contains saturated α1andα2states without a significant contribution from the α3 multilayer desorption state.
3.2. DCOOD Adsorption on Pd(111). The TPD profiles given inFigure 2a were obtained by dosing DCOOD with an exposure ofεDCOOD= 2× 10⁻²L on a clean Pd(111) surface at 123 K. DCOOD coverage was intentionally kept at a relatively low value in order to minimize the influence of D2O (present as an impurity in the FA feedstock) on FA decomposition selectivity, since it has been reported that water can react with adsorbed CO species and replenish Pd active sites that were poisoned with CO.51 A general glance at Figure 2a reveals desorption signals at m/z = 4 (D2), 30 (DCO), and 48 (DCOOD), which are in line with the adsorption of DCOOD species, whereas the existence of m/z = 2 (H2) and 3 (DH) signals indicates the presence of singly deuterated (DCOOH, HCOOD) or nondeuterated FA (HCOOH) impurities in the DCOOD source and/or H-exchange of DCOOD with the background H2/H2O species present on the surface. The inset in
Figure 2b also reveals the desorption of a minor amount of H2 (m/z = 2) in the blank TPD of a clean Pd(111) surface, highlighting the presence of a small but detectable amount of background H2adsorption. It should be noted that the m/z = 46 signal not only is associated with the DCOO species but also may have a contribution from the molecular HCOOH desorption.
Discussions of the various desorption signals observed in
Figure 2a can be grouped in different thermal windows centered at ca. 165, 190, 325, and 485 K. Multiple desorption features observed inFigure 2a at ca. 165 K can be mostly attributed to DCOOD catamers (i.e., oligomeric linear sequences formed by the condensation of DCOOD units52) formed on the Pd(111) surface,12and their mass spectroscopic fragmentation signatures are similar to the analogous species observed for FA adsorption on Rh(111)17and Pd(100).16The m/z = 20 (D2O) desorption signal appearing at a relatively low temperature of ca. 170 K can be attributed to the submonolayer desorption of the D2O impurity of the FA source. This argument is in line with the typical desorption temperatures (ca. 170 K) of submonolayer molecular water on Pd(111).53 In summary, the desorption features appearing at ca. 160 K are mostly not due to catalytic FA dehydration/dehydrogenation/decomposition but rather due to the mass spectroscopic fragmentation of catameric and/or monomeric FA units.
Figure 3.TPRS profiles for DCOOD adsorption (εDCOOD= 2× 10⁻²L at 90 K) on Pd(111), which was initially exposed to (a) 0.1, (b) 0.4, (c) 0.8, (d) 1.0, and (e) 1.4 MLE of NH3.
The Journal of Physical Chemistry C
DOI:10.1021/acs.jpcc.9b08707
The second desorption window inFigure 2a appears at ca. 190 K. Compared to the m/z = 30 (DCO), 46 (HCOOH/DCOO), and 48 (DCOOD) signals desorbing at 165 K, intensities of these channels at 190 K are significantly lower, suggesting a limited extent of FA desorption at 190 K. However, the lack of
any molecular FA desorption features and the presence of intense CO, D2, and DH desorption signals at T > 190 K suggest that FA species are catalytically decomposed into smaller species
on the Pd(111) surface at ≥190 K. The DCOOD
decom-position features appearing at 190 K in Figure 2a reveal
Figure 4.TPRS profiles for DCOOD (εDCOOD= 2× 10⁻²L at 90 K) adsorption on Pd(111), which was initially exposed to various coverages of NH3: m/z = (a) 20, (b) 19, and (c) 18 desorption channels. (d) Corresponding integrated TPRS signal intensities for the m/z = 20 (D2O) channel.
Figure 5.(a) TPRS profiles for CO2(m/z = 44) production upon DCOOD adsorption (εDCOOD= 2× 10⁻²L at 90 K) on Pd(111) which was initially exposed to various coverages of NH3. (b) Corresponding integrated TPRS signal intensities for m/z = 44 channel.
The Journal of Physical Chemistry C Article
DOI:10.1021/acs.jpcc.9b08707
differences as compared to that of the signals observed for the HCOOH/Pd(111) system studied by Barteau et al.12 The
reason for the observed different HCOOH and DCOOD
decomposition temperatures can be associated with the differences in the dosing temperatures of FA in these two studies (i.e., 123 K (current work) vs 170 K (ref3)) and the
differences in the linear heating rates used in the TPD experiments (i.e., 1 K·s−1(current work) vs 10 K·s−1(ref3)).
Experimental12,18,20,22and theoretical54−56studies report the formation of bidentate formate species on group-VIII metal surfaces when they are exposed to FA, including the Pd(111) surface (while the Pd(100) surface reveals an exception).13,15,16 Hence, the presence of the m/z = 44 (CO2) signal at 190 K may suggest that the Pd(111) surface is capable of decarboxylating the formate intermediate and facilitating the FA dehydrogen-ation through pathway (1). As will be discussed in more depth in the forthcoming sections, CO2 desorption at 190 K is also accompanied by m/z = 4 (D2), 3 (DH), and 2 (H2) signals, which are the remaining products of dehydrogenation.12Also, the m/z = 20 (D2O) signal present at ca. 190 K inFigure 2a can be ascribed to the dehydration accompanying the dehydrogen-ation process. The m/z = 28 (CO) signal at≤190 K can be readily attributed to the mass spectroscopic fragmentation of CO2 (inside the QMS), since (i) line shapes of the corresponding m/z = 44 and 28 signals show significant resemblance and (ii) CO desorption from the Pd(111) surface at submonolayer coverages occurs at much higher temperatures such as 470−500 K due to the strong chemisorption of CO on Pd(111).8,9,11,57,58
Figure 6.TPRS profiles for DCOOD adsorption (εDCOOD= 2× 10⁻²L at 90 K) on Pd(111), which was initially exposed to various coverages of NH3: m/z = (a) 4 (D2), (b) 3 (DH), and (c) 2 (H2) desorption channels.
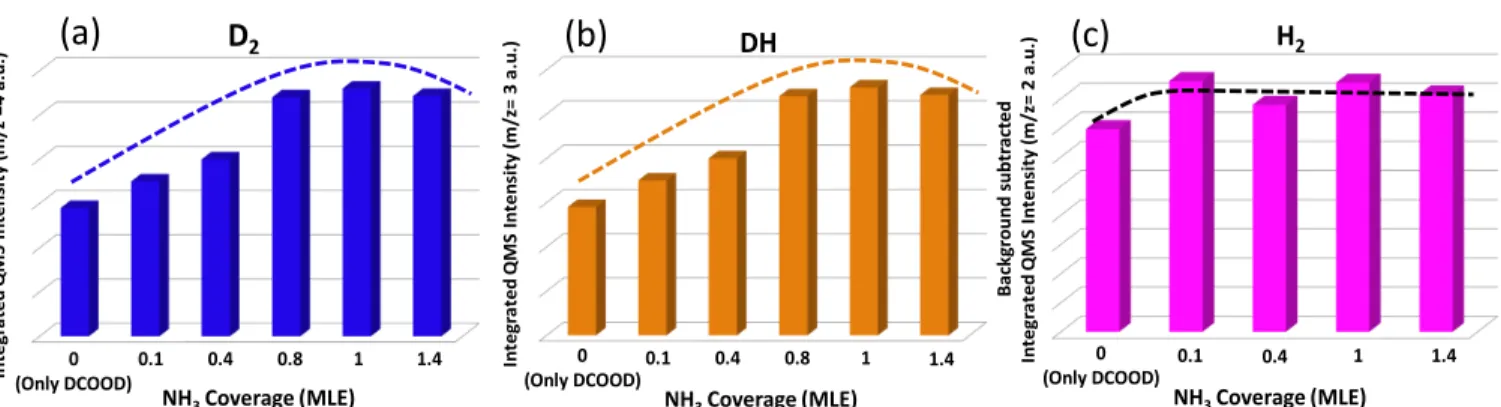
Figure 7.Integrated m/z = (a) 4 (D2), (b) 3 (DH), and (c) 2 (H2) TPRS desorption signals for DCOOD adsorption (εDCOOD= 2× 10⁻²L at 90 K) on Pd(111), which was initially exposed to various coverages of NH3at 90 K.
Figure 8. Integrated m/z = 28 (CO) TPRS desorption signals for DCOOD adsorption (εDCOOD= 2× 10⁻²L at 90 K) on Pd(111), which was initially exposed to various coverages of NH3at 90 K.
The Journal of Physical Chemistry C
DOI:10.1021/acs.jpcc.9b08707
The next thermal window inFigure 2a is located at ca. 325 K. In order to analyze the nature of the m/z = 2 (H2) signal desorbing at 322 K in Figure 2a, the H2 desorption signal originating from the clean Pd(111) surface (given inFigure 2b) was utilized as a control experiment. Figure 2b shows that background H2 adsorption on clean Pd(111) leads to a H2 desorption signal at 335 K with a distinct high-temperature desorption tail extending toward elevated temperatures (most probably due to recombinative desorption of subsurface H species). Differences in H2desorption maxima and the lack of the high-temperature desorption tail in the m/z = 2 (H2) desorption channel in the DCOOD/Pd(111) TPD data suggest that the origin of this signal is most likely not due to background H2adsorption. Furthermore, considering the difference in the scale bars of the TPD plots givenFigure 2a and2b, it is clear that the extent of H2desorption in the DCOOD/Pd(111) TPD data is greater than that of the clean Pd(111) surface. Therefore, the m/z = 2 (H2) signal inFigure 2a located in the close proximity of the m/z = 3 (DH) and 4 (D2) signals was assigned to be a FA dehydrogenation product along with DH and D2species.
The last temperature window inFigure 2a is positioned at ca. 485 K and presents a strong m/z = 28 (CO) desorption signal whose desorption maximum is in accordance with the former work of Barteau et al.12The absence of any m/z = 44 (CO2) desorption signal at this temperature suggests that the origin of this desorption signal is CO(g), which is generated as a product of the catalytic FA dehydration.
3.3. DCOOD Adsorption on NH3-Functionalized Pd-(111). We also investigated DCOOD adsorption on Pd(111) which was initially exposed to various coverages of NH3(Figure 3). In the next section, we will first focus on the general desorption behavior of DCOOD from Pd(111) in the presence of NH3in comparison to DCOOD desorption from the clean
Pd(111) surface. Then, in the forthcoming sections, we will provide a detailed account of the influence of NH3 on the generation of different dehydration and dehydrogenation products on Pd(111).
3.3.1. Behavior of NH3 in the Presence of DCOOD. An inspection of the NH3(m/z = 17) desorption profiles inFigure 3 reveals that there are two major NH3desorption signals located at ca. 160 K and ca. 232−274 K. The NH3desorption state appearing at 160 K inFigures 3a−3e can be assigned to theα2 state observed in Figure 2a, which is due to molecular adsorption/desorption of H-bonded NH3 species loosely bound to the Pd(111) surface. The presence of H-bonding NH3species even at these low NH3coverages may indicate the disruption of the H-bonding network of the catemeric DCOOD species by ammonia, since the presence of Lewis basic functional groups on the Pd(111) surface is also known to disrupt the FA catamer formation.12 Moreover, a shift of the catameric FA desorption features from 165 K (Figure 2a) to 160 K (Figure 3) after NH3functionalization (i.e., a 5 K decrease in desorption maxima) is also in accordance with the suggested weakening of the H-bonds between the DCOOD catamers and the formation of new H-bonding interactions between NH3 and DCOOD species. Therefore, the 160 K m/z = 17 signal can also be attributed to NH3species, which are directly interacting with the DCOOD catamers through H-bonding (possibly, along with a minor contribution from the background water/OH species present on the catalyst surface).
Figure 3a shows that the second m/z = 17 desorption feature desorbs at 274 K atθNH3= 0.1 MLE ammonia coverage, and this desorption temperature is consonant with the desorption temperature of theα1state observed in Figure 1for strongly bound chemisorbed NH3on Pd(111). Furthermore, the peak intensity of this higher temperature m/z = 17 feature
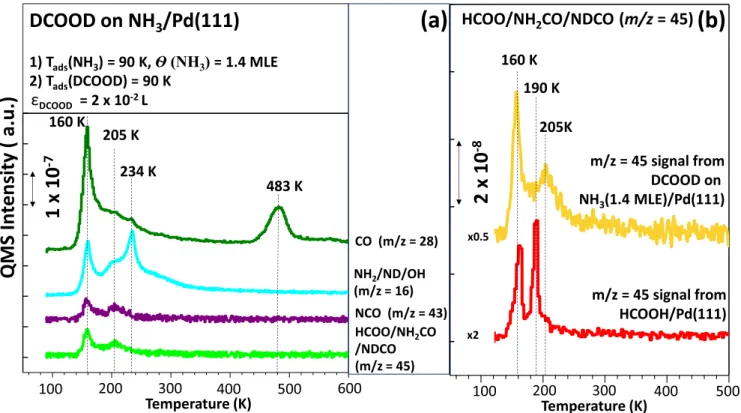
Figure 9.(a) DCOOD adsorption (εDCOOD= 2× 10⁻²L at 90 K) on Pd(111), which was initially exposed to 1.4 MLE of NH3: m/z = 28, 16, 43, and 45 desorption channels. (b) Comparison of m/z = 45 TPD desorption channels of HCOOH/Pd(111) with the m/z = 45 desorption channel of DCOOD/Pd(111) TPRS in the presence of 1.4 MLE of NH3.
The Journal of Physical Chemistry C Article
DOI:10.1021/acs.jpcc.9b08707
significantly increases as a function of increasing NH3coverage, while its desorption maximum shifts from 274 to 232 K, which is also in line with the behavior of submonolayer chemisorbed NH3species (i.e.,α1state) present inFigure 1.
3.3.2. Effect of NH3 on Water (D2O, DHO, and H2O) Production. As can be seen fromFigure 3a, the TPRS data for θNH3= 0.1 MLE yield a noticeably smaller m/z = 20 (D2O) signal at 190 K with respect to that of the DCOOD/Pd(111) data given inFigure 2a. This comparison reveals that functionalizing the Pd(111) surface withθNH3= 0.1 MLE NH3suppresses the D2O formation (i.e., hinders the dehydration pathway (2)). The overall effect of NH3 coverage on the suppression of water formation can be seen more clearly inFigures 4a−4d.Figure 4d also shows the same trend in a semiquantitative fashion via the integrated m/z = 20 (D2O) TPRS signal intensities for various NH3coverages given as a histogram. (SeeFigure S2for a list of the particular integration temperature intervals used in the construction of the histograms given in the main text.)
Figure 4a shows that the m/z = 20 (D2O) TPRS signal at 165 K becomes narrower and the D2O desorption signal at 190 K continuously attenuates with increasing NH3coverages within 0−1.0 MLE. However, at higher NH3coverages (i.e.,θNH3= 1.4 MLE), the D2O desorption signal at 190 K starts to broaden again. Therefore, it is apparent that the DCOOD dehydration pathway (and thus, D2O formation) is suppressed as a function of NH3 coverage within 0−1.0 MLE, while higher NH3 coverages start to weaken this effect.
A quite similar trend is also visible for the desorption of other water species (DOH and H2O) presented inFigures 4b and4c. In addition, new m/z = 20, 19, and 18 desorption features also become discernible at 233 K forθNH3= 1.0−1.4 MLE (Figures
4a−4c). Since the desorption temperatures of these features perfectly overlap with the NH3desorption maxima observed in
Figures 3d−3e, we believe that these new m/z = 20, 19, and 18 desorption features inFigures 4a−4c can be attributed to ND3, ND2H, and NDH2species, respectively, as well as other species containing amine functionalities, as will be discussed insection 3.3.6.
3.3.3. Effect of NH3 on CO2 Production. On the Pd(111) surface, the influence of NH3on CO2formation from FA reveals an opposite behavior as compared to the formation of the water species. It can be seen inFigures 3and5a that the m/z = 44 (CO2) TPRS signals located at ca. 190 K (that are due to FA decomposition and catalytic dehydrogenation) become broader and stronger with increasing ammonia coverage, suggesting a boost in catalytic CO2production. Since the production trends of CO2(Figure 5b) and D2O (Figure 4d) as a function of NH3 coverage reveal opposite behaviors, it can be argued that NH3 facilitates FA dehydrogenation and enhances hydrogen production selectivity while hindering FA dehydration.
Furthermore, it can also be seen inFigure 5a that the presence of even a very low coverage of NH3(i.e., 0.1 MLE) leads to a positive shift (from 190 to 197 K) in CO2 desorption temperatures, which may be linked to the stabilization of the FA decomposition intermediates by adsorbed NH3species. At higher NH3coverages (i.e., 0.4 MLE), a new high-temperature CO2desorption signal appears at 216 K, suggesting the presence of a different strongly bound intermediate (possibly a formate species stabilized by its interaction with NH3), which is not present in the case of the DCOOD/Pd(111) system (Figure 2a). The stabilizing effect of ammonia on the decomposition intermediate is in accordance with the stabilizing effects of (2 ×
2)-oxygen on Pd(111) as well as sodium oxide overlayers and K on Pd(100) surfaces.12,14,16 Comparing the TPRS data in
Figures 3−6also suggests that during NH3-facilitated DCOOD dehydrogenation on Pd(111), various desorbing species (along with their isotopically labeled derivatives) leave the surface in the following order: (i) water species at ca. 190 K, (ii) CO2at 197−216 K, (iii) NH3 species at 232−274 K, (iv) hydrogen species at 305−360 K, and (v) CO species at >485 K.
The presence of the deuterated ammonia species (ND2H and NDH2) in Figure 4a and the broadening of the m/z = 46 (DCOO) desorption signal (Figure S3) can be considered as an indication of DCOOD deprotonation assisted by NH3 on Pd(111), since it was also reported in the literature that Lewis/ Brønsted basic functional groups deprotonate the acidic proton of FA.12,18,34Thus, it is likely that some of the adsorbed NH3 species on Pd(111) may also exist in a protonated form such as ammonium cations during the FA decarboxylation process. Therefore, the stabilization of the FA decomposition inter-mediate could be associated with the ammonium formation, as the ammonium cation can act as a counterion to stabilize the negatively charged formate species. Thus, the origin of the CO2 desorption signal appearing at 197−215 K inFigures 3and5a can be tentatively ascribed to the decomposition of an ammonium-formate ion pair (i.e., [NDH3]+−[DCOO]−) on Pd(111).
Former computational studies emphasized the importance of having the right reaction intermediate in order to drive FA decomposition toward dehydrogenation. Some of these former DFT studies predicted that, even though the formation of the carboxyl (−COOH) intermediate is less favorable than the formation of a formate (HCOO−) intermediate on the Pd(111) surface,−COOH also forms on the Pd(111) surface along with the formate species.54,59Furthermore,−COOH can yield either FA dehydration or dehydrogenation, while the HCOO− intermediate predominantly leads to dehydrogenation on Pd(111).54 These findings, along with current and former experimental studies,12,18suggest that D2O formation during catalytic FA decomposition on Pd(111) is suppressed in the presence NH3 due to the stabilization of the formate intermediate.
Figures 3−7show that enhancement in FA dehydrogenation capability of Pd(111) increases with increasing NH3coverages within 0.1−1.0 MLE, while higher NH3coverages result in the weakening of this effect. It is likely that at extremely high NH3 coverages, ammonia starts to block active sites on the Pd(111) surface and leads to poisoning.
3.3.4. Effect of NH3on D2Production. As it can be seen from
Figures 6a and7a, the m/z = 4 (D2) desorption signals obtained during FA decomposition on Pd(111) in the presence of NH3 show a matching pattern with that of the m/z = 44 (CO2) desorption channel (Figures 5a and 5b). In other words, D2 production increases with increasing NH3coverage up to 1.0 MLE, enhancing the dehydrogenation and suppressing the dehydration processes.
In contrast to the corresponding CO2desorption signals, the presence of NH3on the Pd(111) surface shifts the D2desorption temperature toward lower temperatures (Figure 6a). The decrease in the D2 desorption temperature as a result of the NH3functionalization of Pd(111) is quite important, since it suggests that the enhanced hydrogen production selectivity is also accompanied by a lowered activation energy for molecular hydrogen production from FA. It should be noted that such a favorable case is not commonly observed for the interaction of The Journal of Physical Chemistry C
DOI:10.1021/acs.jpcc.9b08707
FA with various functionalized Pd surfaces. Similar to ammonia, other co-adsorbates are also capable of increasing the formate stability on various Pd surfaces. In contrast to adsorbates such as Na, K, and O (which lead to an increase in H2 desorption temperature),12,14,16NH3decreases the desorption energy of H2 by decreasing the desorption temperature.
The contribution ofθNH3= 0.1 MLE ammonia coverage to the D2formation reaction rate constant can roughly be estimated by using the basic TPD models.60The rate of desorption during a TPD experiment can be estimated as follows:
R T k d d m θ βθ = − = (3)
where θ is the coverage, k is the Arrhenius desorption rate constant,β is the linear heating rate (in K/s), and m is the desorption order. Hence, the desorption rate of D2from the clean Pd(111) surface (eq 4) and the desorption rate of D2from theθNH3= 0.1 MLE ammonia-functionalized Pd(111) surface (eq 5) can be written as T k m 1 1 1 11 θ βθ −Δ Δ = (4) T k m 2 2 2 22 θ βθ −Δ Δ = (5)
For both cases, it can readily be assumed that the D2 formation/desorption is a recombinative process so that m1= m2= 2. While eqs 4and5cannot provide direct information about the rate constants k1and k2(since absolute D2coverages are not known for either of these cases), dividingeq 4byeq 5
removes the necessity of having knowledge about the absolute D2coverages. In other words, the ratio of the integrated m/z = 4 (D2) TPRS signals can be used instead of the corresponding ratio of absolute coverages. Also, note that ineqs 4and5,Δθ = θ, since initial D2coverage on the surface is zero in all cases. After these modifications, the ratio of the rate constants for D2 desorption on DCOOD/Pd(111) (k1) and D2desorption on NH3-functionalized DCOOD/Pd(111) (k2) can be expressed as follows: k k T T 1 2 2 2 1 1 θ θ = Δ Δ (6)
where ΔT1 and ΔT2 are the corresponding temperature differences between the beginning and ending temperatures of the relevant D2 desorption signals in the TPRS data. For instance, on the clean Pd(111) surface, D2desorption due to DCOOD adsorption takes place within 234−532 K, whereas on theθNH3= 0.1 MLE ammonia-functionalized Pd(111) surface, D2desorption takes place within 243−446 K. After plugging in the required parameters intoeq 6, the relative ratio of the rate constants can be found as
k
k 0.7
1 2
≈
This crude estimation predicts that the presence ofθNH3= 0.1 MLE ammonia on Pd(111) enhances the catalytic D2formation rate from DCOOD by a factor of 3/7 (or by 43%).
Furthermore, a computational study of Nilekar et al. reported that the magnitude of the diffusion barrier of the atomic or molecular species on transition-metal single crystal surfaces can be estimated by taking ca. 12% of the corresponding adsorption
energies of such species on the same surface.61Figure 6a clearly shows that functionalizing the Pd(111) surface withθNH3= 0.1 MLE of ammonia decreases the D2desorption temperature from 325 to 311 K, which also corresponds to a decrease in the adsorption energy of D2on Pd(111) upon NH3 functionaliza-tion; this is concomitant to an increase in the surface diffusion rate of atomic D species on Pd(111) in the presence of ammonia. Hence, it can be argued that ammonia has an additional positive contribution to the dehydrogenation rate of FA by increasing the mobility of D atoms on the Pd(111) surface, which results in a simultaneous stabilization of the formate intermediate and a decrease in the D2 desorption temperature, where this increase in the mobility can be associated with the hopping of D atoms via a hydrogen-bonding network created by the surface ammonia species or decreased adsorption energy of D atoms on Pd sites.
3.3.5. Effect of NH3on DH and H2Production. As can be seen fromFigure 7b, DH formation from DCOOD follows the same trend with D2 and CO2 formation as a function of increasing ammonia coverage on Pd(111), while the integrated TPRS intensities of m/z = 2 (H2) given inFigure 7c follows a somewhat different trend (most likely due to the contributions to this signal from background H2). On clean Pd(111), DCOOD adsorption leads to DH desorption at 335 K and H2 desorption at 322 K (Figure 2a), whereas on the ammonia-functionalized Pd(111) surface, both DH and H2desorption take place at ca. 315 K (Figure 6b,c). The decrease in the desorption temperatures of different hydrogen species in the FA dehydrogenation of Pd(111) upon NH3 functionalization demonstrates the favorable effect of ammonia. Similar to D2 formation (Figure 6a), the desorption temperatures of DH (Figure 6b) and H2(Figure 6c) do not change further when the ammonia coverage is varied within 0.1−1.0 MLE, which suggest that the formation of all hydrogen species share similar intermediates and mechanistic routes.
3.3.6. Effect of NH3on CO Production.Figure 8presents the integrated m/z = 28 (CO) TPRS signal for FA decomposition on Pd(111) functionalized with various coverages of NH3. These signals are obtained by integrating the high temperature CO signals located at T > 470 K. Since ammonia suppresses the FA dehydration path, it can be expected that CO desorption should also be suppressed along with water desorption. However, as can be seen from theFigure 8, unlike the D2O data given in Figure 4d, CO formation does not decrease monotonically as a function of increasing ammonia coverage.
In order to explain this unexpected behavior, the data given in
Figure 9 can be considered. In addition to the desorption of molecular species due to noncatalytic processes at 160 K,Figure 9a shows that in the presence of an initial ammonia coverage of 1.4 MLE, the DCOOD adsorption on Pd(111) leads to additional−NH2and CO desorption signals at 234 K. Since molecular CO desorbs at much higher temperatures from the Pd(111) surface, the CO desorption at 205 K along with the m/z = 16 (−NH2), 43 (−NCO), and 45 (NCH2O) desorption signals observed at 205 K can be assigned to species containing both amine and carbonyl functionalities. We tentatively assign this species to formamide (i.e., NH2CHO and/or its deuterated analogues). Note that the m/z = 16 desorption signal cannot be attributed to methane (CH4) formation as it is not an expected product of catalytic FA decomposition on Pd(111). Also, the m/ z = 16 (−NH2) peak occurring at 234 K inFigure 9a can readily be assigned to the desorption of chemisorbed NH3 from the Pd(111) surface. The control experiments provided inFigure 9b
The Journal of Physical Chemistry C Article
DOI:10.1021/acs.jpcc.9b08707
also support the argument that the m/z = 45 signal observed in
Figure 9a cannot be attributed to the HCOO (formyl/formate) species but rather due to the formamide-related species. As can be seen in the lower m/z = 45 desorption profile (i.e., red spectrum) in Figure 9b, which was obtained for HCOOH/ Pd(111) in the absence of ammonia, this TPD profile shows an entirely different desorption maximum (190 vs 205 K), with a different line shape and a dissimilar signal width as opposed to the corresponding signal obtained in the presence of 1.4 MLE of ammonia (upper spectrum inFigure 9b).
The formation of the amide species can also explain the complex CO production trend observed in Figure 8, since amidation products are known to suppress CO formation.62 Moreover, amidation products could also be responsible for the initial decrease in CO2formation when the Pd(111) surface is covered withθNH3= 0.1 MLE of ammonia, as can be seen from
Figure 5b. Therefore, it can be argued that ammonia functionalization can also prevent poisoning of the Pd(111) active sites by CO via inhibition of CO formation through amidation reactions.
4. CONCLUSION
In this study, the effect of a typical Brønsted base (i.e., NH3) on the deuterated formic acid (DCOOD) dehydrogenation on a Pd(111) surface was investigated. Our results indicate that functionalizing the Pd(111) surface with ammonia suppressed the FA dehydration pathway while enhancing the dehydrogen-ation pathway. The enhanced FA dehydrogendehydrogen-ation activity and selectivity of the ammonia-functionalized Pd(111) surface were attributed to the facilitation of the FA deprotonation and stabilization of the decomposition intermediate (i.e., formate) via formation of ammonium counterions on the surface. Furthermore, currentfindings also suggest that the presence of a H-bonded ammonia network on the Pd(111) surface increases the hydrogen atom mobility and decreases the activation energy for molecular hydrogen desorption. In addition, it was found out that in the presence of NH3, catalytic FA decomposition on Pd(111) also leads to amidation reactions resulting in the formation of surface species (possibly formamide, NH2CHO) whose production hinders the adsorption of CO on the Pd(111) active sites and prevents poisoning of the catalytic active sites by the strongly bound chemisorbed CO species. It was also observed that enhancement of the FA dehydrogenation on Pd(111) with NH3is weakened at extremely high coverages of ammonia (e.g., 1.4 MLE) due to the poisoning of the Pd(111) active sites by NH3.
■
ASSOCIATED CONTENT*
S Supporting InformationThe Supporting Information is available free of charge on the
ACS Publications websiteat DOI:10.1021/acs.jpcc.9b08707. H2 and CO TPD profiles obtained after the NH3 adsorption on clean Pd(111) as a function of increasing NH3coverages; CO desorption channel of a blank TPD obtained from a clean Pd(111) surface; temperature intervals that were used to obtain integrated TPD/TPRS signals, which were utilized in the construction of the histograms presented; and DCOO/HCOOH desorption channel for DCOOD adsorption (εDCOOD= 2× 10⁻²L at 90 K) on Pd(111), which was initially exposed to 0.8, 1, and 1.4 MLE of NH3(PDF)
■
AUTHOR INFORMATION Corresponding Author *E-mail:[email protected]. ORCID Yusuf Kocak:0000-0003-4511-1321 Emrah Ozensoy:0000-0003-4352-3824 NotesThe authors declare no competingfinancial interest.
■
ACKNOWLEDGMENTSE.O. acknowledges the scientific collaboration with the TARLA project founded by the Ministry of Development of Turkey (project code: DPT2006K-120470). The authors are grateful to Prof. Mehmet Erbudak (ETH Zurich) for his invaluable assistance with the UHV experimental setup. The authors also acknowledge Dr. Mustafa Karatok (Harvard University) for their fruitful discussions about the experimental data and Mete Duman (UNAM-National Nanotechnology Center, Bilkent University) for his assistance with graphic design and illustrations.
■
REFERENCES(1) Moriarty, P.; Honnery, D. Ecosystem Maintenance Energy and the Need for a Green EROI. Energy Policy 2019, 131, 229−234.
(2) Abe, J. O.; Popoola, A. P. I.; Ajenifuja, E.; Popoola, O. M. Hydrogen Energy, Economy and Storage: Review and Recommenda-tion. Int. J. Hydrogen Energy 2019, 44 (29), 15072−15086.
(3) Allsopp, M. W.; Vianello, G. Ullmann’s Encyclopedia of Industrial Chemistry; Wiley Online Library: 2012.
(4) Eppinger, J.; Huang, K. W. Formic Acid as a Hydrogen Energy Carrier. ACS Energy Letters 2017, 2 (1), 188−195.
(5) Moret, S.; Dyson, P. J.; Laurenczy, G. Direct Synthesis of Formic Acid from Carbon Dioxide by Hydrogenation in Acidic Media. Nat. Commun. 2014, 5 (1), 4017.
(6) Ikemiya, N.; Natsui, K.; Nakata, K.; Einaga, Y. Long-Term Continuous Conversion of CO2 to Formic Acid Using Boron-Doped Diamond Electrodes. ACS Sustainable Chem. Eng. 2018, 6 (7), 8108− 8112.
(7) Valentini, F.; Kozell, V.; Petrucci, C.; Marrocchi, A.; Gu, Y.; Gelman, D.; Vaccaro, L. Formic Acid, a Biomass-Derived Source of Energy and Hydrogen for Biomass Upgrading. Energy Environ. Sci. 2019, 12, 2646.
(8) Ozensoy, E.; Meier, D. C.; Goodman, D. W. Polarization Modulation Infrared Reflection Absorption Spectroscopy at Elevated Pressures: CO Adsorption on Pd(111) at Atmospheric Pressures. J. Phys. Chem. B 2002, 106 (36), 9367−9371.
(9) Ozensoy, E.; Min, B. K.; Santra, A. K.; Goodman, D. W. CO Dissociation at Elevated Pressures on Supported Pd Nanoclusters. J. Phys. Chem. B 2004, 108, 4351−4357.
(10) Ozensoy, E.; Vovk, E. I. In-Situ Vibrational Spectroscopic Studies on Model Catalyst Surfaces at Elevated Pressures. Top. Catal. 2013, 56 (15−17), 1569−1592.
(11) Ozensoy, E.; Wayne Goodman, D. Vibrational Spectroscopic Studies on CO Adsorption, NO Adsorption CO + NO Reaction on Pd Model Catalysts. Phys. Chem. Chem. Phys. 2004, 6, 3765−3778.
(12) Davis, J. L.; Barteau, M. A. Reactions of Carboxylic Acids on the Pd(111)-(2× 2)O Surface: Multiple Roles of Surface Oxygen Atoms. Surf. Sci. 1991, 256 (1−2), 50−66.
(13) Jorgensen, S. W.; Madix, R. J. Active Oxygen on Group VIII Metals: Activation of Formic Acid and Formaldehyde on Pd(100). J. Am. Chem. Soc. 1988, 110 (2), 397−400.
(14) Egawa, C.; Doi, I.; Naito, S.; Tamaru, K. Adsorption of Methanol, Formaldehyde and Formic Acid on Pd(100) Surfaces Modified by a Sodium and Sodium Oxide Overlayer. Surf. Sci. 1986, 176 (3), 491− 504.
The Journal of Physical Chemistry C
DOI:10.1021/acs.jpcc.9b08707
(15) Kovács, I.; Kiss, J.; Solymosi, F. On the Role of Adsorbed Formate in the Oxidation of C1 Species on Clean and Modified Pd(100) Surfaces. Vacuum 2017, 138, 152−156.
(16) Solymosi, F.; Kovács, I. Adsorption and Reaction of HCOOH on K-Promoted Pd(100) Surfaces. Surf. Sci. 1991, 259 (1−2), 95−108.
(17) Solymosi, F.; Kiss, J.; Kovács, I. Adsorption of HCOOH on Rh(111) and Its Reaction with Preadsorbed Oxygen. Surf. Sci. 1987, 192 (1), 47−65.
(18) Houtman, C.; Barteau, M. A. Reactions of Formic Acid and Formaldehyde on Rh(111) and Rh(111)-(2× 2)O Surfaces. Surf. Sci. 1991, 248 (1−2), 57−76.
(19) Solymosi, F.; Kiss, J.; Kovacs, I. Adsorption and Decomposition of Formic Acid on Potassium-Promoted Rhodium(111) Surfaces. J. Phys. Chem. 1988, 92 (3), 796−803.
(20) Avery, N. R.; Toby, B. H.; Anton, A. B.; Weinberg, W. H. Decomposition of Formic Acid on Ru(001): An EELS Search for a Formic Anhydride Intermediate. Surf. Sci. 1982, 122 (1), L574−L578. (21) Sun, Y. K.; Weinberg, W. H. Catalytic Decomposition of Formic Acid on Ru(001): Transient Measurements. J. Chem. Phys. 1991, 94 (6), 4587−4599.
(22) Avery, N. R. Adsorption of Formic Acid on Clean and Oxygen Covered Pt(111). Appl. Surf. Sci. 1982, 11−12, 774−783.
(23) Columbia, M. R.; Thiel, P. A. The Reaction of Formic Acid with Clean and Water-Covered Pt(111). Surf. Sci. 1990, 235 (1), 53−59.
(24) Silbaugh, T. L.; Karp, E. M.; Campbell, C. T. Energetics of Formic Acid Conversion to Adsorbed Formates on Pt(111) by Transient Calorimetry. J. Am. Chem. Soc. 2014, 136 (10), 3964−3971. (25) Ying, D. H. S.; Robert, J. M. Thermal Desorption Study of Formic Acid Decomposition on a Clean Cu(110) Surface. J. Catal. 1980, 61 (1), 48−56.
(26) Bowker, M.; Rowbotham, E.; Leibsle, F. M.; Haq, S. The Adsorption and Decomposition of Formic Acid on Cu{110}. Surf. Sci. 1996, 349 (2), 97−110.
(27) Yao, Y.; Zaera, F. Adsorption and Thermal Chemistry of Formic Acid on Clean and Oxygen-Predosed Cu(110) Single-Crystal Surfaces Revisited. Surf. Sci. 2016, 646, 37−44.
(28) Sims, J. J.; Ould Hamou, C. A.; Réocreux, R.; Michel, C.; Giorgi, J. B. Adsorption and Decomposition of Formic Acid on Cobalt(0001). J. Phys. Chem. C 2018, 122 (35), 20279−20288.
(29) Barteau, M. A.; Bowker, M.; Madix, R. J. Acid-Base Reactions on Solid Surfaces: The Reactions of HCOOH, H2CO, and HCOOCH3 with Oxygen on Ag(110). Surf. Sci. 1980, 94 (2−3), 303−322.
(30) Yu, W. Y.; Mullen, G. M.; Flaherty, D. W.; Mullins, C. B. Selective Hydrogen Production from Formic Acid Decomposition on Pd-Au Bimetallic Surfaces. J. Am. Chem. Soc. 2014, 136 (31), 11070−11078.
(31) Shustorovich, E.; Bell, A. T. An Analysis of Formic Acid Decomposition on Metal Surfaces by the Bond-Order-Conservation-Morse-Potential Approach. Surf. Sci. 1989, 222 (2−3), 371−382.
(32) Zhang, S.; Metin, Ö.; Su, D.; Sun, S. Monodisperse AgPd Alloy Nanoparticles and Their Superior Catalysis for the Dehydrogenation of Formic Acid. Angew. Chem., Int. Ed. 2013, 52 (13), 3681−3684.
(33) Mazumder, V.; Sun, S. Oleylamine-Mediated Synthesis of Pd Nanoparticles for Catalytic Formic Acid Oxidation. J. Am. Chem. Soc. 2009, 131 (13), 4588−4589.
(34) Mori, K.; Dojo, M.; Yamashita, H. Pd and Pd-Ag Nanoparticles within a Macroreticular Basic Resin: An Efficient Catalyst for Hydrogen Production from Formic Acid Decomposition. ACS Catal. 2013, 3 (6), 1114−1119.
(35) Zhou, X.; Huang, Y.; Xing, W.; Liu, C.; Liao, J.; Lu, T. High-Quality Hydrogen from the Catalyzed Decomposition of Formic Acid by Pd-Au/C and Pd-Ag/C. Chem. Commun. 2008, 30, 3540−3542.
(36) Tedsree, K.; Li, T.; Jones, S.; Chan, C. W. A.; Yu, K. M. K.; Bagot, P. A. J.; Marquis, E. A.; Smith, G. D. W.; Tsang, S. C. E. Hydrogen Production from Formic Acid Decomposition at Room Temperature Using a Ag-Pd Core-Shell Nanocatalyst. Nat. Nanotechnol. 2011, 6 (5), 302−307.
(37) Ke, F.; Wang, L.; Zhu, J. An Efficient Room Temperature Core-Shell AgPd@MOF Catalyst for Hydrogen Production from Formic Acid. Nanoscale 2015, 7 (18), 8321−8325.
(38) Choi, B. S.; Song, J.; Song, M.; Goo, B. S.; Lee, Y. W.; Kim, Y.; Yang, H.; Han, S. W. Core-Shell Engineering of Pd-Ag Bimetallic Catalysts for Efficient Hydrogen Production from Formic Acid Decomposition. ACS Catal. 2019, 9 (2), 819−826.
(39) Bulut, A.; Yurderi, M.; Karatas, Y.; Say, Z.; Kivrak, H.; Kaya, M.; Gulcan, M.; Ozensoy, E.; Zahmakiran, M. MnOx-Promoted PdAg Alloy Nanoparticles for the Additive-Free Dehydrogenation of Formic Acid at Room Temperature. ACS Catal. 2015, 5 (10), 6099−6110.
(40) Bi, Q. Y.; Lin, J. D.; Liu, Y. M.; He, H. Y.; Huang, F. Q.; Cao, Y. Dehydrogenation of Formic Acid at Room Temperature: Boosting Palladium Nanoparticle Efficiency by Coupling with Pyridinic-Nitrogen-Doped Carbon. Angew. Chem., Int. Ed. 2016, 55 (39), 11849−11853.
(41) Jiang, Y.; Fan, X.; Chen, M.; Xiao, X.; Zhang, Y.; Wang, C.; Chen, L. AuPd Nanoparticles Anchored on Nitrogen-Decorated Carbon Nanosheets with Highly Efficient and Selective Catalysis for the Dehydrogenation of Formic Acid. J. Phys. Chem. C 2018, 122 (9), 4792−4801.
(42) Jin, M.; Zhang, H.; Xie, Z.; Xia, Y. Palladium Nanocrystals Enclosed by {100} and {111} Facets in Controlled Proportions and Their Catalytic Activities for Formic Acid Oxidation. Energy Environ. Sci. 2012, 5 (4), 6352−6357.
(43) Yadav, M.; Akita, T.; Tsumori, N.; Xu, Q. Strong Metal-Molecular Support Interaction (SMMSI): Amine-Functionalized Gold Nanoparticles Encapsulated in Silica Nanospheres Highly Active for Catalytic Decomposition of Formic Acid. J. Mater. Chem. 2012, 22, 12582−12586.
(44) Van Hardeveld, R. M.; Van Santen, R. A.; Niemantsverdriet, J. W. The Adsorption of NH3 on Rh(111). Surf. Sci. 1996, 369 (1−3), 23− 25.
(45) Kay, B. D.; Lykke, K. R.; Creighton, J. R.; Ward, S. J. The Influence of Adsorbate-Absorbate Hydrogen Bonding in Molecular Chemisorption: NH3, HF, and H2O on Au(111). J. Chem. Phys. 1989, 91, 5120.
(46) Fisher, G. B. The Electronic Structure of Two Forms of Molecular Ammonia Adsorbed on Pt(111). Chem. Phys. Lett. 1981, 79 (3), 452−458.
(47) Karatok, M.; Vovk, E. I.; Koc, A. V.; Ozensoy, E. Selective Catalytic Ammonia Oxidation to Nitrogen by Atomic Oxygen Species on Ag(111). J. Phys. Chem. C 2017, 121 (41), 22985−22994.
(48) Netzer, F. P.; Madey, T. E. Interaction of NH3 with Oxygen-Predosed Ni(111). Surf. Sci. 1982, 119 (2−3), 422−432.
(49) Rodriguez, J. A.; Kevin Kuhn, W.; Truong, C. M.; Wayne Goodman, D. A FT-IRAS Study of Ammonia Adsorbed on Ru(0001). Surf. Sci. 1992, 271 (3), 333−339.
(50) Sälli, E.; Martiskainen, S.; Halonen, L. Computational Study of the Vibrational Structure of the Ammonia Molecule Adsorbed on the Fcc (111) Transition Metal Surfaces. J. Phys. Chem. C 2012, 116 (28), 14960−14969.
(51) Bulushev, D. A.; Ross, J. R. H. Vapour Phase Hydrogenation of Olefins by Formic Acid over a Pd/C Catalyst. Catal. Today 2011, 163 (1), 42−46.
(52) Mikawa, Y.; Jakobsen, R. J.; Brasch, J. W. Infrared Evidence of Polymorphism in Formic Acid Crystals [6]. J. Chem. Phys. 1966, 45, 4750.
(53) McBride, F.; Omer, A.; Clay, C. M.; Cummings, L.; Darling, G. R.; Hodgson, A. Strain Relief and Disorder in Commensurate Water Layers Formed on Pd(111). J. Phys.: Condens. Matter 2012, 24 (12), 124102.
(54) Scaranto, J.; Mavrikakis, M. Density Functional Theory Studies of HCOOH Decomposition on Pd(111). Surf. Sci. 2016, 650, 111− 120.
(55) Wang, Y.; Qi, Y.; Zhang, D.; Liu, C. New Insight into the Decomposition Mechanism of Formic Acid on Pd(111): Competing Formation of CO2and CO. J. Phys. Chem. C 2014, 118 (4), 2067− 2076.
(56) Zheng, T.; Stacchiola, D.; Saldin, D. K.; James, J.; Sholl, D. S.; Tysoe, W. T. The Structure of Formate Species on Pd(1 1 1) Calculated
The Journal of Physical Chemistry C Article
DOI:10.1021/acs.jpcc.9b08707
by Density Functional Theory and Determined Using Low Energy Electron Diffraction. Surf. Sci. 2005, 574 (2−3), 166−174.
(57) Kiskinova, M. P.; Bliznakov, G. M. Adsorption and Coadsorption of Carbon Monoxide and Hydrogen on Pd(111). Surf. Sci. 1982, 123 (1), 61−76.
(58) Erley, W.; Wagner, H. Absolute CO Coverage: Direct Comparison between the (111) and (110) Faces of Ni, Pd, and 300 K. J. Chem. Phys. 1980, 72, 2207.
(59) Herron, J. A.; Scaranto, J.; Ferrin, P.; Li, S.; Mavrikakis, M. Trends in Formic Acid Decomposition on Model Transition Metal Surfaces: A Density Functional Theory Study. ACS Catal. 2014, 4 (12), 4434−4445.
(60) Redhead, P. A. Thermal Desorption of Gases. Vacuum 1962, 12 (4), 203−211.
(61) Nilekar, A. U.; Greeley, J.; Mavrikakis, M. A Simple Rule of Thumb for Diffusion on Transition-Metal Surfaces. Angew. Chem., Int. Ed. 2006, 45 (42), 7046−7049.
(62) Sridhar, M.; Van Bokhoven, J. A.; Kröcher, O. Effect of Ammonia on the Decomposition of Ammonium Formate over Au/TiO2 under Oxidizing Conditions Relevant to SCR: Enhancement of Formic Acid Decomposition Rate and CO2 Production. Appl. Catal., A 2014, 486, 219−229.
The Journal of Physical Chemistry C
DOI:10.1021/acs.jpcc.9b08707