32
AN EARLY PREDICTION AND DIAGNOSIS OF SEPSIS
IN INTENSIVE CARE UNITS:
AN UNSUPERVİSED MACHINE LEARNING MODEL
Zehra Nur CANBOLAT, Management Information System, İstanbul Medipol University/Turkey, [email protected] ( https://orcid.org/0000-0001-8359-5713)
*Gökhan Silahtaroğlu, Management Information System, İstanbul Medipol University/Turkey, [email protected] ( https://orcid.org/0000-0001-8863-8348)
Received: 06.11.2019, Accepted: 10.02.2020
*Corresponding author Research Article DOI:10.22531/muglajsci.643554 Abstract
Sepsis infection, which is one of the most important causes of death in intensive care units, is seen as a severe global health crisis. If an early diagnosis of sepsis infection cannot be made, and treatment is not started rapidly, septic shock may result in multiple organ failure and death is almost inevitable. Therefore, it is vital to establish an early diagnosis and start the treatment at once. This study aims to accomplish a new model of unsupervised machine learning using lactate and Ph laboratory test values, which are considered to be important parameters to diagnose sepsis infection. The data used in the study have been obtained from MIMIC-III international clinical database. Unsupervised machine learning has been performed via the Fuzzy-C algorithm along with validity indexes like Xie Beni on patients’ data diagnosed sepsis and non-sepsis. The machine-generated ten labels at the end of the training session considering-designed validity indexes. The labelled cluster representatives have been reduced to two dimensions by Principal Component Analysis method in order to monitor the learning in a two-dimensional space. The study contributes to the literature by conducting unsupervised learning through two parameters (Lactate and Ph) and leading to multi-parameter studies. In addition, the study reports that there are five types of sepsis patterns in terms of Lactate and PH laboratory tests.
Keywords: Septic Infection, Unsupervised Learning, Fuzzy-C Means Clustering, Intensive Care Unit.
YOĞUN BAKIM HASTALARINDA SEPSİS ENFEKSİYONU TAHMİNİ: DENETİMSİZ MAKİNE ÖĞRENMESİ MODELİ Özet
Yoğun bakım servislerinde yaşanan ölümlerin en önemli sebeplerinden biri olan sepsis enfeksiyonu ciddi bir küresel sağlık krizi olarak görülmektedir. Sepsis enfeksiyonunun erken teşhisi yapılamaz ve hızla tedaviye başlanmaz ise çoklu organ yetmezliğine ve ölüme neden olabilmektedir. Bu nedenle hızlı sepsis tanısı ve tedavisi hayati önem taşımaktadır. Bu çalışmada amaç, sepsis enfeksiyonunun gelişimini etkileyen önemli parametrelerden olan laktat ve Ph değerlerini kullanarak yeni bir denetimsiz makine öğrenmesi modeli gerçekleştirmektir. Çalışma kapsamında kullanılan veriler MIMIC-III klinik veri tabanından elde edilmiştir. Çalışma genelinde sepsis tanısı konmuş ve sepsis tanısı konmamış hastalar üzerinde Bulanık-C ortalamalar algoritması ile denetimsiz makine öğrenmesi gerçekleştirilmiştir. Makine sepsis olan ve olamayan hastaları beşi sepsis pozitif, beşi sepsis negatif olacak şekilde 10 ayrı etiketle işaretlemiştir. Etiketlenen küme temsilcileri öğrenmenin monitorize edilebilmesi için Temel Bileşenler Analizi yöntemiyle iki boyuta indirgenmiştir. Çalışma, iki parametre özelinde (laktat ve Ph) değerlendirilerek denetimsiz öğrenme gerçekleştirmiş olması ve çok parametreli çalışmalara öncülük etmesi açısından literatüre katkı sağlamaktadır. Ayrıca, çalışma Lactat ve Ph değerleri bakımından beş ayrı kümede hasta bulunduğunu rapor etmektedir.
Anahtar Kelimeler: Sepsis Enfeksiyonu, Denetimsiz Makine Öğrenmesi, Bulanık C-Ortalamalar, Yoğun Bakım Ünitesi. Cite
Canbolat Z. N., Silahtaroğlu G., (2020). An Early Prediction and Diagnosis of Sepsis in Intensive Care Units: An Unsupervised Machine Learning Model, Mugla Journal of Science and Technology, 6(1), 32-40.
33 1. Introduction
Artificial intelligence, which has become very popular in the health industry, has been used by health centers to make a diagnosis and start the treatment via intelligent decision-making systems based on machine learning. It is expected that by 2025, there will be a severe digitalization and data explosion in the field of health. Some of these will come alive thanks to the IoT systems which consist of one trillion sensors connected to the internet, mobile applications which are integrated with a human body, social media text data, and the expansion of personalized health services [1]. Today, many different structured, and unstructured data are being studied in the field of health. Sound, image, laboratory, device data, and sensors are some of them. In those studies, it was aimed to reach the diagnosis through patient complaints[2], laboratory tests data[3], pathology reports [4], images [5] and even sounds [6]. All these attempts and created models yielded satisfying results.
Sepsis infection, which is one of the most important causes of deaths in intensive care units, is seen as a severe global health crisis. Sepsis affects 27 to 30 million people each year and kills 7 to 9 million people [7]. Sepsis is an increasingly common cause of morbidity and mortality, especially in elderly, immunocompromised and critically ill patients. Sepsis has also been reported to be the most common cause of death in the non-coronary the intensive care units [4]. If an early diagnosis of sepsis infection cannot be made and treatment is not started rapidly, it may cause septic shock, multiple organ failure and finally death [5]. Sepsis infection is a common cause of high mortality and most survivors experience long-term morbidity, too. A recent study found that sepsis was the cause of 26% of the mortality in hospitals [6]. Prediction of sepsis and early detection of sepsis provides faster treatment and reveals better results. However, the diagnosis of sepsis is usually possible only very few hours before the patients are at a high risk of mortality. The predictive accuracy of the available tools is poor and the diagnosis is based on time-consuming laboratory results [7]. Because sepsis is a fatal disease, it has to be detected within hours and the treatment should be started at once. However, there are often minutes between the appearance of symptoms which are needed for diagnosis and reaching the highest risk level of death. Therefore, it is crucial to predict the disease before it truly shows itself. In the recent studies, some important parameters that trigger sepsis infection have been determined. Lactate and Ph laboratory test parameters are two important ones among those 57 determined in a study [8]. Permanent increases in lactate for 24 hours have been reproted to be associated with mortality as high as 89% [9]. Callaway et al. retrospectively examined the relationship between venous lactate levels and mortality in 588 normotensive trauma
patients admitted to the emergency departments. In the study where the cutoffs value of lactate is 2.5mmol, it has been found that any rise in lactate level increases mortality [14]. In a study conducted by Vandromme et al., 2.413 trauma patients were examined. When the normotensive capillary and venous lactate values of the patients were examined, it was found that the values of lactate level 2.5 mmol and above are more effective than the systolic blood pressure value for predicting mortality. Trauma patients with systolic blood pressure of 90-110 mm Hg were included in this study [15]. Dede et al. examined 114 patients whose mean age, APACHE II score, SOFA score, lactate value and pH value were found to be significantly correlated with mortality (P <0.05). Blood lactate value is as important as scoring systems used in intensive care unit for determining the prognosis of patients [16]. In another study performed for severe sepsis, arterial, central venous and peripheral venous blood gases, the relationship between pH, partial oxygen pressure (PO2), partial carbon dioxide pressure (PCO2), base deficit (BA) and bicarbonate (HCO3) values were examined. In severe sepsis arterial, central venous and peripheral venous blood gas values and significant correlation were determined for pH, PCO2, PO2, BA and HCO3 [17]. In their study, Nguyan et al. included 111 patient data (59 males and 52 females). They collected their data for one year and analyzed them. A statistically significant difference was found between survivors and deaths in terms of septic shock, platelet, prothrombin time, albumin, total bilirubin, lactate and lactate clearance. In the multiple comparison of multivariate logistic regression modeling, only lactate clearance was found to be significantly associated with a decrease in mortality. It was observed that for each 10% increase in lactate clearance caused approximately 11% decrease in the probability of death [18].
On the other hand, intensive care scoring systems are widely used to predict recovery from disease and to evaluate the severity of the situaiton. They are also used to choose the right treatment, standardize patients to participate in clinical trials, and compare the performance of intensive care units [19]. Commonly used scoring systems in sepsis infection are Sofa and Apache. However, due to the poor predictive accuracy of the available tools and the time taken to make the diagnosis, the researchers have turned to different systems. In a study aimed at developing an artificial intelligence algorithm for an early prediction of sepsis, 27,527 cases were examined. Using an artificial intelligence based sepsis expert algorithm, the detection of sepsis was possible 4 hours before it occurred with AUROC = 0.82 and the sensitivity = 85% [12]. RoS (Sepsis Risk Score) was found to be significantly sensitive when it is compared with that of QSOFA [20]. As it is seen, clinical trials are underway to evaluate both traditional and innovative therapies in the medication of sepsis. Yet, there is not a final solution to the problem. In this study, a novel unsupervised
34 machine learning model has been trained with the parameters affecting sepsis infection in order to predict sepsis and sepsis risks. In this context, Fuzzy C-Means algorithm has been used.
In literature, supervised machine learning algorithms have been used to detect hidden patterns behind diseases. Random Forests, Artificial Neural Networks, Support Vector Machines and Logistic Regression are widely used.
As it is mentioned above, it is reported that using supervised learning algorithms can predict sepsis. On the other hand, it is also reported that sepsis starts and turns into a fatal situation in minutes. Thus, in practice even it is predicted, it is sure that the sepsis has already started. Unfortunately, what has been done in literature so far is to predict a very fast developing disease with already known parameters. Therefore, these approaches are not applicable in practice. That’s why they are not used in intensive care units and most importantly, sepsis is still an unsolvable health problem. Consequently, two approaches may be adapted to predict sepsis: One is predicting vital signs and laboratory tests which are the indications of sepsis. That means instead of using sepsis as a class variable, and other pioneer indicators should be taken as class variable(s). Those values may be predicted one by one or a new pattern of multiple variables may be used as class variable. The prediction of those pioneer signs or indicators may shed light to possible sepsis.
The second approach is to use unsupervised methods. Without using labels as Sepsis or Non-Sepsis, patients may be clustered (in a time series manner). After clustering, labels are added to see whether Sepsis and Non-Sepsis patients are justly separated. The unsupervised training will go on until Sepsis and Non-Sepsis cases are detached from each other, in other words they are in true separate clusters.
This study employs the second approach. Since it is quite possible that Sepsis and Non-Sepsis cases may overlap, Fuzzy C-Means algorithm has been utilized. Also, Xie Beni, partition coefficient and partition entropy, which are part of Fuzzy-C means have been applied to measure the quality of outputs.
Dimension reduction has been performed using principal component analysis (PCA) in order to visualize patients with or without sepsis. The data used in the study have been obtained from the MIMIC-III v1.4 version of the international clinical database created by MIMIC-III (Medical Information Mart for Intensive Care) belongs to years between 2001-2012. MIMIC-III is a large database containing information about patients admitted to intensive care units. There are 38,597 adults and 7,870 newborn data in general [21].
2. Material and Methods
The purpose of this study is to perform a new model of unsupervised machine learning using lactate and Ph
values, which are important parameters affecting the development of sepsis infection. The data used in this study have been obtained from the international clinical database named MIMIC-III. Fuzzy C-means unsupervised machine learning algorithm has been performed on the data of patients who were diagnosed as sepsis positive and sepsis negative. The reason for the use of the FCM algorithm in the study is because there is not a strict line separating those patients. In some cases, Ph and lactate values show no difference between sepsis and non-sepsis patients. This reveals that there is fuzziness in terms of Ph and lactate for sepsis diagnosis.
2.1. Fuzzy C- Means Algorithm
Fuzzy C-means (FCM) is a clustering algorithm which divides data into two or more clusters. This method, which is frequently used in pattern recognition, was developed by Dunn in 1973 [22] and improved by Bezdek in 1981 [23]. FCM relies on minimizing the following objective function:
𝐽𝑚 = 𝑁𝑖=1 𝐶𝑗 =1𝑢𝑖𝑗𝑚 𝑥𝑖− 𝑐𝑗 2
, 1≤m<∞ (1)
In the equation cj represents the cluster centers. Uij is a matrix which shows the probability of each record being a member of each created cluster. m is for fuzziness. When m = 1, there will be almost no fuzziness. However, as it raises fuzziness will increase too. For most datasets m=2 works well. In our study, we have also used m= 2.
𝑢𝑖𝑗 = 1 𝑥 𝑖−𝑐𝑗 𝑥 𝑖−𝑐𝑘 2 𝑚 −1 𝑐 𝑘=1 , 𝑐𝑗 = 𝑢𝑖𝑗𝑚 𝑁 𝑖=1 .𝑥𝑖 𝑢𝑖𝑗𝑚 𝑁 𝑖=1 (2)
FCM is also a recursive algorithm as many other ML algorithms. It iterates until there is no or very little change in uij matrix. Equation (2) calculates uij and cj values during each iteration.
A pseudo code for FCM is as follows:
1. Start an arbitrary 𝑈 = 𝑢𝑖𝑗 matrix, 𝑈(0)
2. DO UNTIL 𝑈(𝑘+1)− 𝑈(𝑘) < Ꜫ Calculate 𝐶(𝑘)= 𝑐 𝑗 , 𝑈(𝑘) 𝑐𝑗 = 𝑢𝑖𝑗𝑚 𝑁 𝑖=1 .𝑥𝑖 𝑢𝑖𝑗𝑚 𝑁 𝑖=1 Update 𝑈𝑘, 𝑈(𝑘+1) by 𝑢𝑖𝑗 = 1 𝑥 𝑖−𝑐𝑗 𝑥 𝑖−𝑐𝑘 2 𝑚 −1 𝑐 𝑘 =1 (3) 3. LOOP
35 Since U membership matrix is generated randomly, each run of the FCM algorithm may result in different minimums [24]. When iteration ends, these values can be rounded to 0 or 1 by defuzzification. Then, the data elements are assigned to the cluster with the highest degree of membership, eliminating fuzziness, and then the clustering process is terminated. Fuzzy FCM allows objects to belong to two or more clusters rather than only one.
In order to assess the quality and robustness of generated clusters, FCM exercise indexes like Xie Beni, Partition Entropy and Partition Coefficient [25]. These indexes are developed especially for FCM. All of them was developed for FCM algorithm, so it can be said that they are parts of FCM.
2.1.1. Xie Beni index
The Xie Beni index generates a value by calculating the compactness of each cluster and the fuzzy decomposition. The lower the value is, the better the clustering quality is.
𝑋𝐵 = 𝑈𝑖𝑗 2 𝑥 𝑗− 𝑐𝑖 𝑚 𝑁 𝑗 𝐾 𝑖 /𝑁 𝑚𝑖𝑛𝑖≠𝑗 𝑐𝑖− 𝑐𝑗 𝑚 (4)
The numerator of the above equation calculates the fuzzy distinction between clusters, while the denominator refers to the internal compactness of the clusters.
Uij in the equation represents the degree of membership
for each Cj cluster. The Fuzzy C-means algorithm does
not assign each record to only one cluster. Due to the concept of fuzziness, each record has got a certain degree of membership for each produced cluster. That’s why it creates a membership matrix (Uij). Higher Xie
Beni values indicate better clustering. 2.1.2. Partition Coefficient
This parameter is calculated using only the membership matrix. Although it provides information about fuzziness, it is criticized in the literature because it does not take the relationship between clusters and data into account. The partition coefficient is calculated as follows: 𝑃𝐶 = 1 𝑁 𝑈𝑖𝑗 2 𝑛 𝑗 =1 𝑐 𝑖=1 (5) If the PC function converges to 1.0, fuzziness and clustering are good. Lower PC values indicate a poor clustering.
2.1.3. Partition Entropy
This function depends on Shanon’s entropy. It calculates fuzziness using Uij matrix, too. If the function converges to -1.0, fuzziness and clustering are good. Higher function values indicate that clustering results are poor. PE is calculated with the equation below (6):
𝑃𝐸 =
1
𝑁
𝑈
𝑖𝑗 𝑛 𝑗 =1 𝑐 𝑖=1log
2𝑈
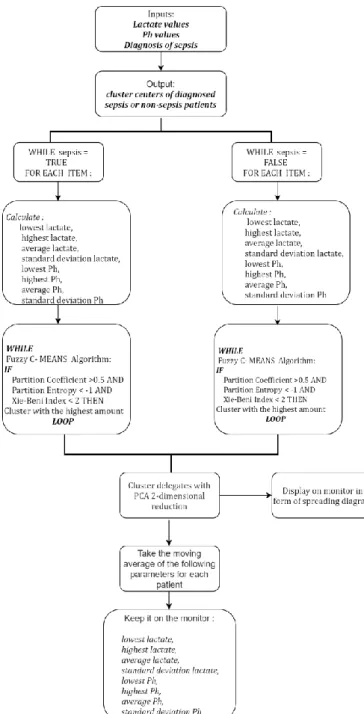
𝑖𝑗 (6)An unsupervised machine learning algorithm model has been developed throughout the study as it is shown in Figure 1. Fuzzy C-Means algorithm has been run separately on two groups of patients’ data in as depicted in the figure. In order to form cluster centers, maximum, minimum, mean and variations of Ph and Lactate parameters are evaluated separately, and the validity of the clusters is measured using partition coefficient, partition entropy and Xie Beni index. Finally, the established model has been visualized in two dimensions by reducing the size by means of PCA. The number of clusters for each group of data are determined according to the results of Xie Beni, partition coefficient and partition entropy index results: When partition, coefficient is bigger than 0.5 and partition entropy is less than -1 and Xie Index value is less than 2, the maximum number of clusters is chosen as the final cluster amount. So, though we give a rule set to determine the number of clusters, the model may be considered as a whole unsupervised learning model which decides the number of clusters and the members of each cluster with a probability value.
36 Figure 1. Unsupervised Machine Learning Algorithm Used in the Model.
3. Findings
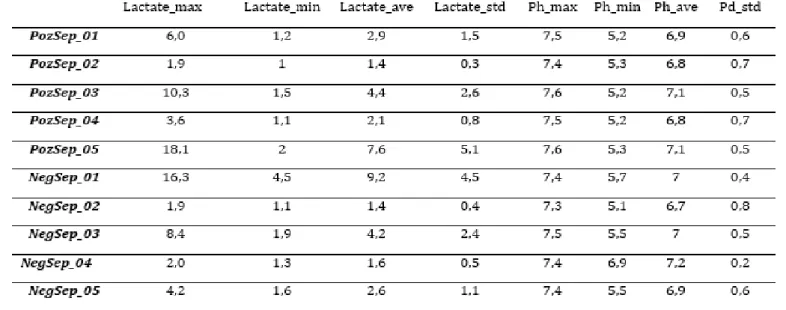
Intensive care patients’ data taken from MIMIC-III international clinical database have been used in the study. Lactate and Ph data have been converted into eight separate variables:
the lowest, the highest, average and standard deviation
This is done for both laboratory results (Ph and Lactate) depending on duration of stays of patients. The machine has been trained with 27,321 non-sepsis patients and
1,657 sepsis patients in the intensive care unit whose lactate and Ph values were transformed as mentioned above. KNIME program was used for data analysis. In the analysis, the model was trained separately for each patient group. Data were divided into training and testing.
Figure 2. The model of the study for sepsis diagnosed patients.
Figure 3. The model of the study for non-sepsis diagnosed patients.
m = 2 was used as fuzzyness Various cluster numbers have been tried and 5 is determined as the optimum cluster number considering partition entropy, partition coefficient and Xei-Beni index values shown in Table 1. The model of the study is shown in Figure 2 and Figure 3.
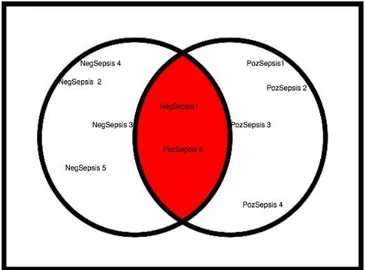
As a result of these two learning activities, the representatives of the 10 different clusters created by the machine are shown in Table 3. The distances of these cluster representatives to each other in the Euclidean space is shown in Figure 4. In the Figure, clusters labelled NegativeSepsis represent non- sepsis patients as PositiveSepsis means the patients diagnosed sepsis.
37 Table 1. Clusters of Patients Diagnosed with Sepsis
Number of
clusters Partition Entropy Xie Beni Index Coefficient Partition
2 -0.26 0.34 0.84
3 -0.5 0.64 0.71
4 -0.69 0.9 0.61
5 -0.88 1.28 0.53
6 -0.92 1.33 0.48
After that, for 27.321 patients who are not diagnosed sepsis, various cluster numbers have been tried with the Fuzzy C-Means algorithm and these group patients are also divided into 5 clusters as a result of the coefficient and index values shown in Table 2. At this stage, when the entropy is less than -1 and the partition coefficient is less than 0.5, the number of clusters 5 is preferred. The Xie-Beni index value is acceptable with 1.24 (<2), while the cluster number is 5.
Table 2. Clusters of Non-Sepsis Patients
Table 3. Cluster Centers Learned with Fuzzy C-Means
Figure 4 depicts that clusters labelled NegativeSepsis1 and PositiveSepsis5 are very close to each other. Furthermore, the NegativeSepsis3 and PositiveSepsis3 clusters are very close to the fuzzy area. In this case, it may be considered that this fuzziness is one of the reasons why clinicians do not use lactate and Ph values in some cases for the diagnosis of sepsis and in some cases, they can do so.
Number of
clusters Partition Entropy Xie Beni Index Coefficient Partition
2 -0.25 0.33 0.85
3 -0.58 0.86 0.65
4 -0.81 1.55 0.53
5 -0.94 1.33 0.50
38 Figure 4. Clusters in Euclidean Space.
Cluster centers representing clusters have been reduced from eight dimensions to two by PCA to be able to visualize the distance between the clusters and to integrate them with a monitoring system that can be used in intensive care units. PCA has created a two-dimension data set with a 79% accuracy. However, this representation strength is 99% when it is reduced to three dimensions. In this study, since the sepsis monitoring can be shown in two dimensions, 21% loss of representation is accepted. However, at the end of the study it was seen that prediction accuracy is acceptable. The cluster representatives represented by two new vectors are visualized in a scatter diagram to obtain a prototype of a possible patient monitor (Figure 5). In Figure 5, SN represents non-sepsis patients’ region, SP represents patients diagnosed sepsis and ND no decision.
Figure 5. Monetarization of cluster centers. Figure 4 shows that cluster centers representing patients diagnosed sepsis are generally far from cluster representatives who are not diagnosed sepsis. However, the above-mentioned clusters are quite close to each other. The purpose of the PCA dimension reduction was to observe different patterns between patients diagnosed sepsis and not. In this case, when a new patients’ similar data is mapped on the monitor it will be possible to see how much the new patient is close to
sepsis or non-sepsis areas. A prototype version of a patient sepsis positive (SP) is shown in Figure 6. Here it is seen that the patient moves to the SN region and heads to the SP region in terms of lactate and Ph values. Here, it is important to stress that the two-dimensional cluster visualization is in time series format. Patients’ data are to be updated every certain unit of time. After treatment in SP region, s/he leaves the SP regions and travels into no decision zone.
Figure 6. Traverse of a sepsis positive patient. 4. Conclusion
In this study, a new unsupervised learning model has been performed for the prediction of sepsis infection which is known as the cause of death in intensive care units. In the present study, in addition to the lactate test results, which are considered to be of primary importance in the diagnosis of sepsis (based on the opinions of the clinicians and the literature studies,) the Ph parameter accompanying the lactate was also used. MIMIC-III international clinical database, Intensive care patient data were used in the study. Lactate and Ph data were converted into eight separate variables as the lowest, highest, average and variance (standard deviation) for each patient, whatever the duration of stay is. The machine was trained with non-sepsis 27,321 patients and 1,657 sepsis diagnosed patients in the intensive care units whose lactate and PH values were transformed as mentioned above. This training was conducted separately for each patient group using Fuzzy C-means algorithm. Afterwards, dimension reduction was performed using principal component analysis (PCA) to visualize patients with or without sepsis on a monitor. In this way, it is seen that ten different clusters which are generated by the fuzzy C-means algorithm seem generally differentiated from each other. Nevertheless, it is difficult to make this distinction in some cases. Difficulty or delay in physicians making a proper diagnosis for sepsis may also result from this fuzziness.
Classification algorithms (Decision Tree, Random Forest, Naive Bayes etc.) were generally used in machine learning studies on health issues in the
39 literature. This is also true for sepsis diagnosis. In this sense, two different types of studies can be seen in literature: The first one is the studies which directly predict sepsis with multiple laboratory tests and bedside device data. In other studies, data were converted into time series format and prediction was done. Both studies are not applicable in intensive care units because predicting sepsis directly does not gain enough time to cure sepsis. The solution is either predicting sepsis indicators (not sepsis itself) or using unsupervised learning methods in time series format and structure new patients’ data in the same way to observe whether they are getting closer to sepsis clusters.
The latter one has been applied in this study. The clustering results have also been converted into two-dimensional space by PCA to display data as sepsis and non-sepsis on a monitor. When unlabeled single patient’s data were also mapped onto this visualization, it was possible to see whether the patient’s situation was moving to sepsis zone.
The model used in the study includes two parameters (Ph and lactate). There are many different parameters associated with sepsis infection, and these can vary from patient to patient depending on living conditions, genetic information, and life history. In this study, since a fully automated system was not achieved, processes were carried out separately and combined manually. Therefore, it was not possible to put together and analyze more than two parameters. In the future studies, the number of variables should be increased by taking the opinions of physicians.
5. References
[1] The Global Competitiveness Report 2017-2018 | World Economic Forum.
[2] Silahtaroğlu, G. and Yılmaztürk, N. (2019) Data analysis in health and big data: A machine learning medical diagnosis model based on patients’ complaints. Communications in
Statistics - Theory and Methods, Taylor & Francis. 1–10.
https://doi.org/10.1080/03610926.2019.16227 28
[3] Yadav, P., Steinbach, M., Kumar, V. and Simon, G. (2018) Mining electronic health records (EHRs): A survey. ACM Comput. Surv.
https://doi.org/10.1145/3127881
[4] Kocbek, S., Cavedon, L., Martinez, D., Bain, C., Manus, C. Mac, Haffari, G. et al. (2016) Text mining electronic hospital records to automatically classify admissions against disease: Measuring the impact of linking data sources. Journal of Biomedical Informatics, 64. https://doi.org/10.1016/j.jbi.2016.10.008 [5] de Bruijne, M. (2016) Machine learning
approaches in medical image analysis: From detection to diagnosis. Med. Image Anal. https://doi.org/10.1016/j.media.2016.06.032 [6] Sakar, B.E., Isenkul, M.E., Sakar, C.O., Sertbas, A.,
Gurgen, F., Delil, S. et al. (2013) Collection and analysis of a Parkinson speech dataset with multiple types of sound recordings. IEEE Journal of Biomedical and Health Informatics,.
https://doi.org/10.1109/JBHI.2013.2245674 [7] Sepsis — Global Sepsis Alliance.
[8] Bone, R. C., Balk, R. A., Cerra, F. B., Dellinger, R. P., Fein, A. M., Knaus, W. A., ... & Sibbald, W. (1992) Definitions for sepsis and organ failure and guidelines for the use of innovative therapies in sepsis. Chest, 101, 1644–55.
https://doi.org/10.1378/chest.101.6.1644 [9] Com, I. (2018) (No Title).
[10] Szakmany, T., Lundin, R.M., Sharif, B., Ellis, G., Morgan, P., Kopczynska, M. et al. (2016) Sepsis prevalence and outcome on the general wards and emergency departments in Wales: Results of a multi-centre, observational, point prevalence study. PLoS ONE,.
https://doi.org/10.1371/journal.pone.0167230 [11] Lovejoy, C.A., Buch, V. and Maruthappu, M.
(2019) Artificial intelligence in the intensive care unit. Crit. Care.
https://doi.org/10.1186/s13054-018-2301-9 [12] Nemati, S., Holder, A., Razmi, F., Stanley, M.D.,
Clifford, G.D. and Buchman, T.G. (2018) An Interpretable Machine Learning Model for Accurate Prediction of Sepsis in the ICU. Critical Care Medicine,.
https://doi.org/10.1097/CCM.00000000000029 36
[13] Broder, G., Science, M.W.- and 1964, undefined. Excess lactate: an index of reversibility of shock in human patients. ScienceSciencemagOrg,. [14] Callaway, D.W., Shapiro, N.I., Donnino, M.W.,
Baker, C. and Rosen, C.L. (2009) Serum lactate and base deficit as predictors of mortality in normotensive elderly blunt trauma patients. Journal of Trauma - Injury, Infection and Critical Care, 66, 1040–4.
https://doi.org/10.1097/TA.0b013e3181895e9 e
[15] Vandromme, M.J., Griffin, R.L., Weinberg, J.A., Rue, L.W. and Kerby, J.D. (2010) Lactate is a better predictor than systolic blood pressure for determining blood requirement and mortality: could prehospital measures improve trauma triage? Journal of the American College of Surgeons, 210, 861–7, 867–9.
https://doi.org/10.1016/j.jamcollsurg.2010.01. 012
[16] Dede, G., Şahan, L., Dede, B. and Demirbilek, S. Araştırma Makalesi Kan Laktat Seviyesi Yoğun Bakım Hastalarında Mortaliteyi Tahmin Etmede
40 Ne Kadar Etkilidir? Blood Lactate Levels
Intensive Care Patients Mortality Estimating, How much?
[17] Ağır Sepsiste Santral Venöz, Arteriyel ve Periferik Venöz Kan Gazı Değerlerinin
Karşılaştırılması | Makale | Türkiye Klinikleri. [18] Nguyen, H.B., Rivers, E.P., Knoblich, B.P.,
Jacobsen, G., Muzzin, A., Ressler, J.A. et al. (2004) Early lactate clearance is associated with improved outcome in severe sepsis and septic shock. Critical Care Medicine,.
https://doi.org/10.1097/01.CCM.0000132904.3 5713.A7
[19] Bouch, C.D. and Thompson, J.P. (2008) Severity scoring systems in the critically ill. Continuing Education in Anaesthesia, Critical Care and Pain, Oxford University Press. 8, 181–5.
https://doi.org/10.1093/bjaceaccp/mkn033 [20] Delahanty, R.J., Alvarez, J.A., Flynn, L.M., Sherwin,
R.L. and Jones, S.S. (2019) Development and Evaluation of a Machine Learning Model for the Early Identification of Patients at Risk for Sepsis. Annals of Emergency Medicine, Mosby Inc. 73, 334–44.
https://doi.org/10.1016/j.annemergmed.2018.1 1.036
[21] Johnson, A.E.W., Pollard, T.J., Shen, L., Lehman, L.W.H., Feng, M., Ghassemi, M. et al. (2016) MIMIC-III, a freely accessible critical care database. Scientific Data, Nature Publishing Groups. 3.
https://doi.org/10.1038/sdata.2016.35 [22] Dunn, J.C. (1973) A fuzzy relative of the
ISODATA process and its use in detecting compact well-separated clusters. Journal of Cybernetics,.
https://doi.org/10.1080/01969727308546046 [23] Bezdek, J.C., Ehrlich, R. and Full, W. (1984) FCM:
The fuzzy c-means clustering algorithm. Computers and Geosciences,.
https://doi.org/10.1016/0098-3004(84)90020-7
[24] Flores-Sintas, A., Cadenas, J., Systems, F.M.-F.S. and and 1999, undefined. Membership functions in the fuzzy C-means algorithm. Elsevier,. [25] Xie, X.L. and Beni, G. (1991) A validity measure
for fuzzy clustering. IEEE Transactions on Pattern Analysis and Machine Intelligence, 13, 841–7. https://doi.org/10.1109/34.85677