European Journal of Educational Research
Volume 7, Issue 3, 707 - 714.
ISSN: 2165-8714 http://www.eu-jer.com/
Turkish Adaptation of Math and Me Survey: A Validity and Reliability
Study
Meral Cansiz Aktas *
Ordu University, TURKEY
Sanem Tabak Ordu University, TURKEY
Received: May 14, 2018 ▪ Revised: July 10, 2018 ▪ Accepted: July 18, 2018
Abstract: This research aims to complete Turkish adaptation, validity and reliability studies for the Math and Me Survey developed
by Adelson and McCoach for use in determining the students’ attitudes towards mathematics in the transition from primary school to middle school. Within the scope of validity and reliability studies for the scale, data gathered from 1169 primary school students had item analysis, exploratory factor analysis and confirmatory factor analysis performed. In line with this, 18 items from the original scale were translated to Turkish and item equivalence between the original English and Turkish translation was ensured. During item analysis to determine the construct validity of the scale, an item with low item total correlation value was removed from the scale. The Cronbach alpha coefficient was calculated as .93. The Cronbach alpha coefficients from the scale subdimensions of Enjoyment and Self-Perception were calculated as .91 and .88. The confirmatory factor analysis results for the scale revealed perfect fit with the construct determined in the exploratory factor analysis results. Thus, the Math and Me survey can be said to be a valid and reliable tool for use in Turkish culture.
Keywords: Attitudes towards mathematics, elementary students, scale adaptation.
To cite this article: Cansiz Aktas, M., & Tabak, S. (2018). Turkish adaptation of math and me survey: A validity and reliability study.
European Journal of Educational Research, 7(3), 707-714. doi: 10.12973/eu-jer.7.3.707
Introduction
In mathematics education, affect is one of the research areas investigating the interplay between cognitive and emotional aspects (Evans, Hannula, Zan & Brown, 2006). Emotions, attitudes and beliefs which are used to describe affect play an important role in mathematic learning and teaching processes (McLeod, 1992). Although research about attitudes has the longest history within the field of affect, there is no consensus about the definition of attitude in the literature (Di Martino & Zan, 2011). For example, Leavy, Hourigan and Carroll (2015) defined attitude as “…. a predisposition that is learned in order to respond in a consistent way, either in a favorable or unfavorable manner, toward a specific object…” (p. 512) depicting attitude generally as the result of three basic features of consistency, predispositions and learning. However, there are different definitions for attitudes towards mathematics. For example, Ma & Kishor (1997) defined attitude toward mathematics as “…. an aggregated measure of a liking or disliking of mathematics, a tendency to engage in or avoid mathematical activities, a belief that one is good or bad at mathematics, and a belief that mathematics is useful or useless….” (p. 27). Lin and Huang (2016) made the definition as “… one’s feelings toward mathematics, based on his/her beliefs about mathematics…” (p. 196).
When definitions of attitudes toward mathematics are investigated, it appears students’ affective characteristics related to mathematics learning are at the forefront in a general sense. At this point, many affective factors related to attitudes to mathematics may be sub-factors of this attitude. According to Tobias (1993), factors comprising attitudes to mathematics include form of perception of mathematics, belief in the benefits of mathematics, belief and self-confidence about being successful at mathematics, interest in mathematics, enjoyment derived from solving mathematical problems and experiences gained during mathematics learning (cited; Arici, 2013).
Studies dealing with students’ attitudes to mathematics have received noteworthy attention for more than forty years and studies have shown a strong correlation between mathematics success and various domains of attitudes (Lim & Chapman, 2013). This situation has resulted in the development of many scales at national and international level to measure students’ attitudes towards mathematics.
*Corresponding author:
Meral Cansiz Aktas, Ordu University, Faculty of Education, Ordu, Turkey. Email: [email protected]
At the national level, scales about attitudes to mathematics have been developed for middle school (Baykul, 1990; Nazlicicek & Ertkin, 2002; Onal, 2013; Uzel, 2007), high school (Baykul, 1990; Erol, 1989; Ural, 2007) or undergraduate level students (Askar, 1986; Duatepe & Cilesiz, 1999). At primary school level, Haciomeroglu (2017) performed validity and reliability studies about developing an attitude to mathematics scale.
When attitude to mathematics scales are examined at the international level, Lim and Chapman (2013) stated that the scales available to measure attitudes to mathematics of students were either old or only had validity and reliability studies performed in western cultures. They noted complaints by the many researchers about not finding an appropriate scale to use in research.
When the literature is investigated, one of the most commonly used scales is the Fennema-Seherman Mathematics Attitude Scale (Fennema&Sherman, 1976) (Adelson & McCoach, 2011; Tabuk &Haciomeroglu, 2015). Comprising 9 subscales and 108 items with a 5-point Likert type, this scale was developed to measure attitudes to mathematics of middle school and high school students. The Attitudes Toward Mathematics Inventory (Tapia, 1996; Tapia & Marsh, 2004) is another commonly used attitude scale. Comprising 4 subscales and 40 items, this scale was developed to measure high school students’ attitudes towards mathematics. Lim and Chapman (2013) applied the ATMI to 1601 participants in Singapore to develop a shortened form comprising 4 subscales and 19 items.
Adelson and McCoach (2011) stated most of the developed and commonly-used scales were not appropriate for young students in terms of reading level, appropriateness of questions and format. They stated most researchers commonly used scales without validity studies for middle school students. Hence, they noted the need for a scale to use in determining attitudes about mathematics of elementary school students and developed the Maths and Me survey.
Introduction of Maths and Me Survey
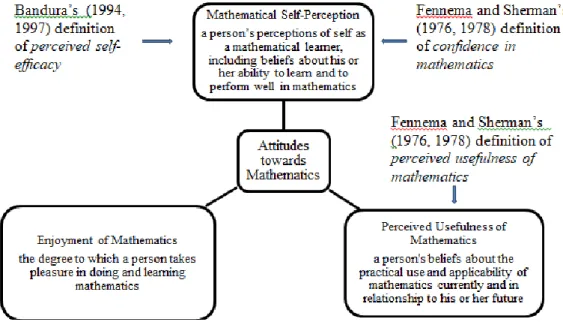
Maths and Me (Adelson, 2006) is an attitude scale developed with the aim of measuring primary school students attitudes towards mathematics. In the initial development stage of the scale, the aim was to measure three types of attitude related to mathematics (Figure 1). The definitions mentioned in Adelson & McCoach (2011, pp.226) are given below.
Figure 1. The Definitions of Three Types of Attitudes towards Mathematics
The psychometric properties of the scale were completed and the results of the analyses stated the Maths and Me Survey comprised two sub factors of Enjoyment of Mathematics and Mathematical Self-Perception. The Enjoyment of Mathematics subscale measures the degree of pleasure a student gains from learning or doing mathematics. Students with high points for this subscale like mathematics and enjoy games, puzzles and problems related to mathematics. Students with low points for this subscale do not like mathematics, find it boring and do not enjoy playing games and puzzles or solving problems related to mathematics. The Mathematical Self-Perceptions subscale comprises 8 items and measures perceptions of a student’s ability to show good performance skills in mathematical learning and mathematics. Students receiving high points on this subscale believe they are skilled in understanding mathematics and solving mathematical problems. Students receiving low points on this subscale believe mathematics is difficult and confusing and do not believe they have the ability to understand mathematics or to do mathematics (Adelson & McCoach, 2011).
Why Maths and Me Survey?
Firstly, it is noteworthy that the definitions of Bandura’s (1994, 1997) perceived self-efficacy and Fennema and Sherman’s (1976, 1978) confidence in learning mathematics were taken as a foundation for the development of the scale (cited: Adelson & McCoach, 2011). Mathematical self-perception involves perceptions of the student about ability to learn and do mathematics. It includes the self-concept and self-efficacy of students related to mathematics. This concept is generally stated as the belief of students about doing mathematics as individuals learning mathematics (Shen & Talavera, 2003; Valentine, DuBois & Cooper, 2004). Student enjoyment in learning and doing mathematics and thus the use of mathematics in daily life is associated with the confidence in learning mathematics concepts (Adelson & McCoach, 2011).
Considering the limitations explained above of the available scales at national and international level, it was considered the Maths and Me Survey (Adelson, 2006) could be used to determine students’ attitudes towards mathematics in elementary level (K3-K6) and the decision was made to perform Turkish adaptation studies. One of the general aims of mathematics education in Turkey is to develop positive attitudes about mathematic lessons among students. Both primary school and middle school mathematic lesson teaching programs emphasize the correlation between success and attitude. Additionally, at national level, there appears to be only one research with validity and reliability studies performed for the determination of attitudes of primary school students’ about mathematics, only for 4th class primary school students (Haciomeroglu, 2017). Considering these points, the present research performs validity and reliability studies for elementary students (3rd-6th) and will contribute to filling a gap in the literature in determining attitudes to mathematics of students at this level.
Method
Study Group
The study group in this research was determined with the random sampling method of simple random sampling. The study group consists of 1169 primary school students attending primary schools in Ordu provincial center. The study group comprised 588 girls (50.3%) and 581 boys (49.7%).
Procedure
Within the scope of this study, the aim was to investigate the psychometric properties related to the construct validity of the Turkish form of the Math and Me Survey. Firstly, the total points obtained by individuals in the study group from the Math and Me scale had Z test applied. According to Z test results, all data were determined to be between -3 and +3. Later all items had Cronbach alpha analysis applied and the effects on the whole scale were assessed (Table 1). In line with this, the decision was made to include all 18 times on the scale in the analysis.
Table 1. Cronbach Alpha Values for Scale Items
Item Mean if item is
deleted Variance if item is deleted Corrected item total correlation Cronbach Alpha if item is deleted
1 70.04 128.93 .682 .90 2 69.74 128.21 .727 .90 3 69.92 129.21 .703 .90 4 69.85 126.18 .640 .90 5 70.49 129.18 .575 .90 6 69.78 131.06 .544 .91 7 69.98 127.63 .641 .90 8 71.83 143.40 -.037 .93 9 70.15 127.86 .550 .91 10 69.74 127.12 .740 .90 11 69.88 127.92 .653 .90 12 70.31 126.48 .674 .90 13 69.64 130.05 .589 .90 14 69.83 129.70 .570 .91 15 70.15 133.60 .397 .91 16 69.90 125.32 .777 .90 17 70.27 126.97 .690 .90 18 69.83 126.33 .723 .90
In the next stage, item analysis was performed. With the aim of testing the perceptions, feelings, thoughts and attitudes of individuals as a result of a variety of experiences, the statements in the scale tools should be consistent with each other. Item analysis determines deficiencies in the scale tool and completes some adjustments (Sencan, 2005). Item total correlation and the differences between the upper and lower 27% groups were investigated with the aim of
completing item analysis of the Turkish form of the Math and Me Survey. A scan of the relevant literature determined .30 as cut-off point for item total correlation (Field, 2013).
Finally, within the scope of this study confirmatory factor analysis was applied to the construct validity of the Turkish form of the Math and Me survey. Confirmatory factor analysis was performed with the aim of determining how consistent the data from the Turkish adaptation is to the factors in the original scale. Confirmatory factor analysis is interpreted as very functional for the aim of determining to degree of consistency between the factors formed based on a concept and the real (true) data (Kline, 2011). To assess the level of fit of the model in this study the RMSEA (Root Mean Square Error of Approximation), GFI (Goodness of Fit Index CFI), IFI (Incremental Fit Index (Comparative Fit Indices), NFI (Normed Fit Index), NNFI (Non-Normed Fit Index), RFI (Relative Fit Index), AGFI (Adjusted Goodness of Fit Index), SRMR (Standardized Root Mean Square Residual), and were used. In the relevant literature, for the GFI, IFI, NFI, NNFI, RFI and AGFI values of .90 and above are acceptable, while value of .95 and above are stated to be perfect fit. Additionally, RMSEA and SRMR values of .05 or less are accepted as perfect fit (Kline, 2011; Tabachnick and Fidell, 2007).
Results
Study 1: Linguistic Validity
During Turkish adaptation of the scale, the Turkish translation was completed by the researchers and checked by five experts in the English language and necessary corrections made. The scale was presented to two lecturers in the field of mathematics education and four Masters’ students for opinions. After corrections and recommendations, the scale was examined by a lecturer in Turkish language and given its final form. Additionally, with the aim of determining the compliance between the Turkish and English scales, the Turkish and English forms of the scale were implemented with a one-week interval to 20 people in 11th class attending an Anatolian High School with teaching fully in English. The correlation between the two scales was calculated with the Pearson Correlation method (r=.809, p<.001). To determine whether the scale could be understood by the target students, six students were chosen from each elementary level (3rd-6th) and the scale was read and opinions given before another round of corrections. After linguistic validity studies of the scale, the scale was applied to 1169 students attending primary schools in Ordu provincial center with the aim of performing reliability and factor analysis.
Study 2: Item analysis and Exploratory Factor Analysis Item Analysis
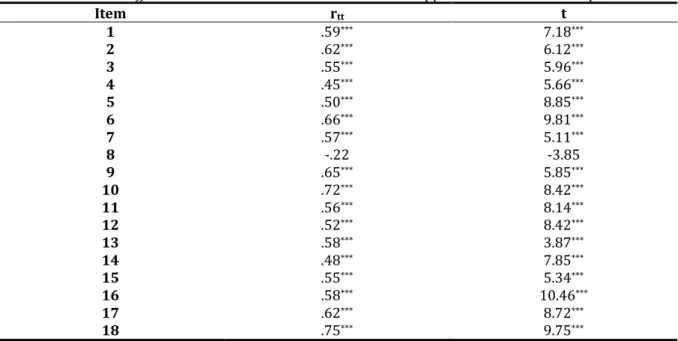
For item analysis, two different procedures were applied. The first investigated the mean difference in total points obtained by the lower 27% and upper 27% groups. The independent t-test results determined significant differences between the lower and upper 27% groups. Later, the item total correlations of the scale were investigated with .30 determined as item total correlation cut-off point. When assessing this cut-off point, the decision was made to leave all items in the item pool. Linked to this the item total correlation coefficient varied between .45 and .72 (Table 2). As the T value for the 8th item on the scale was not significant (t= -3.85, p>.001), the decision was made to remove it from the scale.
Table 2. Differences in Item Total Correlations between Upper and Lower 27% Groups
Item rtt t 1 .59*** 7.18*** 2 .62*** 6.12*** 3 .55*** 5.96*** 4 .45*** 5.66*** 5 .50*** 8.85*** 6 .66*** 9.81*** 7 .57*** 5.11*** 8 -.22 -3.85 9 .65*** 5.85*** 10 .72*** 8.42*** 11 .56*** 8.14*** 12 .52*** 8.42*** 13 .58*** 3.87*** 14 .48*** 7.85*** 15 .55*** 5.34*** 16 .58*** 10.46*** 17 .62*** 8.72*** 18 .75*** 9.75***
Exploratory Factor Analysis
Exploratory factor analysis (EFA) aims to reach a small number of definable significant constructs from many variables (Buyukozturk, 2007). In EFA, an item on the scale not included within a defined factor is linked to the high loading value showing the correlation with this factor. Items with high load values for each factor are called items measuring the construct defined by the factor. Item factor load values are generally selected to be .45 and above. However, for low numbers of items in practice, factor load values of .30 appear to be acceptable (Kline, 2011). The Kaiser-Meyer-Olkin (KMO) test was applied to show whether the suitability of data set to apply factor analysis for the scale and the KMO value was found to be .95 (KMO>.70). The KMO value, a criterion for sufficiency of the sample size, is accepted as an indicator of whether the sample size is sufficient. Additionally, for factor analysis, the distribution of the population should be normal. In analysis completed at the end of the study, the Bartlett test was found to be significant (χ2=10334.23; p<.001). The significant Bartlett coefficient is an indicator that the distribution in the population is normal (Tavsancil, 2002). In this sense, this value is accepted as a marker of the normality of the distribution.
Factor analysis studies began with 17 items. The results of the EFA observed the scale had two factors with eigenvalues larger than 1. The eigenvalues of these two factors, explained variance values and total variance values are given in Table 3.
Table 3. Findings Related to Factors Obtained in Factor Analysis
Factor Eigen value Variance percentage Total variance percentage
Enjoyment 5.33 31.35 31.35
Self-perception 4.74 27.92 59.27
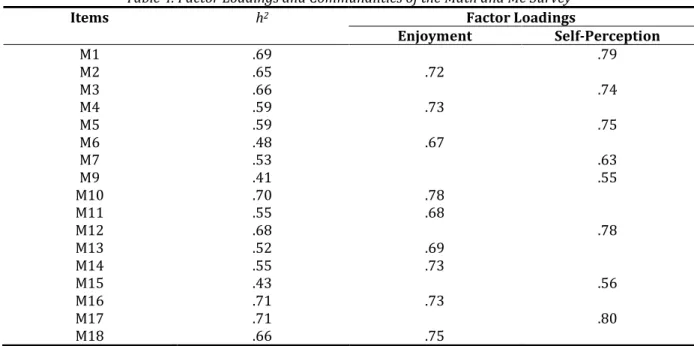
When Table 3 is investigated, the total of the two factors with eigen values greater than 1 were collected and it was observed that these factors explained 59.27% of the total variance. The factor structure of items on the scale are presented in Table 4.
Table 4. Factor Loadings and Communalities of the Math and Me Survey
Items h2 Factor Loadings
Enjoyment Self-Perception M1 .69 .79 M2 .65 .72 M3 .66 .74 M4 .59 .73 M5 .59 .75 M6 .48 .67 M7 .53 .63 M9 .41 .55 M10 .70 .78 M11 .55 .68 M12 .68 .78 M13 .52 .69 M14 .55 .73 M15 .43 .56 M16 .71 .73 M17 .71 .80 M18 .66 .75
According to EFA results, “Enjoyment” comprises 9 items in the first factor translated into Turkish, with item factor load values varying from .75 to .67 and explaining 31.35% of total variance. “Self-perception” has 8 items for the second factor translated into Turkish, with item factor load values varying from .80 to .55 and explaining 27.92% of total variance. Accordingly, the variance amount explained by the two factors is 59.27%. The common variance amount explained by each item in the factors varied from .70 to .41.
Study 3: Confirmatory Factor Analysis and Reliability
To investigate the construct validity of the Turkish form of the Math and Me Survey, confirmatory factor analysis was used. The Lisrel 8.51 program was used to analyze the factor construct of the scale at an advanced level. The two-factor model was tested with confirmatory factor analysis (CFA). The modification indices (7-5, 4-1, 8-7) showing consistency with the conceptual construct were used.
According to the results of confirmatory factor analysis, the model may be stated to show good fit; X2 = 49.75, p<.001; X2/sd= 5.73; RMSEA = .06; CFI = .95; IFI = .96; GFI = .94; AGFI = .92; NFI = .94; NNFI = .95; SRMR = .03; RFI = .94. The
Figure 2: Path Diagram for the Two-Factor Model
According to Figure 2, t-value estimation showed that all parameter estimates for the paths in the model were statistically significant. Parameter estimates were all statistically significant at the level of .001.
Reliability
Within the scope of study 2, finally the internal consistency measures of the final Turkish form of the Math and Me Survey were assessed. The internal consistency coefficients of the whole scale and sub-factors were measured with the Cronbach alpha value. In line with this, the internal consistency coefficient of the Turkish form of the Math and Me Survey was calculated as .93. A scale tool with internal consistency coefficient of .90 and above is reliable at perfect level according to the relevant literature (Creswell, 2002). Accordingly, with internal consistency coefficient of .93 confirms that the Math and Me Survey is a reliable scale tool for the Turkish sample.
When the Cronbach alpha internal consistency coefficients for the sub-factors of the scale are investigated, the internal consistency coefficient related to the “Enjoyment” subscale was .91, while the internal consistency coefficient for the “Self-Perception” subscale was calculated as .88. In line with this, the internal consistency coefficient of the “Enjoyment” subscale is at perfect level, while the internal consistency coefficient for the “Self-Perception” subscale is at good level.
Conclusion and Discussion
This study investigated the psychometric properties of the Turkish adaptation of the Math and Me Survey developed by Adelson and McCoach (2011) for primary school students by performing validity and reliability studies. In line with the aim of the research, three different studies were completed. Study 1 investigated the linguistic validity of the Turkish adaptation of the scale tool, Study 2 performed item analysis and exploratory factor analysis while Study 3 investigated confirmatory factor analysis and reliability analysis. The original scale comprising 18 items was translated into Turkish, item equivalency between original English and Turkish translation was ensured and later it was applied to 1169 students. During item analysis to determine the construct validity of the survey, one item (item 8) was removed from the survey and the remaining 17 items were found to separate into the original two independent factors.
The differentiation of items was shown by the difference between mean item points for the upper 27% point interval and the lower 27% point interval. The t- test results were significant for all items apart from one item. The Cronbach alpha internal consistency coefficient calculated for the sub-factors of the scale were .91 for “Enjoyment” and .88 for “Self-Perception” and .93 for the whole scale. In conclusion, the two factors in the original scale developed by Adelson and McCoach (2011) and the two factors determined in this research were observed to comply in terms of names and content.
The results obtained in this research showed the Turkish adaptation of the Math and Me Survey developed by Adelson and McCoach (2011) is valid and reliable. Accordingly, the Math and Me Survey is a scale tool comprising two factors,
with 17 items and a four-point Likert type. One item on the scale is given inverse points (item 6). A minimum of 8 points and maximum of 40 points may be obtained from the scale. Students obtaining high points on the Enjoyment of Mathematics subscale like mathematics and enjoy games, puzzles and problems related to mathematics. However, students with low points on this subscale do not like mathematics, find it boring and do not enjoy games, puzzles and problems related to mathematics. Students obtaining high points on the Mathematical Self-Perceptions subscale believe they have the ability to understand mathematics and to solve mathematical problems. However, students with low points on this subscale believe mathematics is difficult and confusing and do not believe they have the ability to understand or do mathematics. Considering these it can be used to determine attitudes towards mathematics in elementary level (K3-K6) in Turkish culture. On the other hand, repetition of this study with different study groups will provide the opportunity to more clearly reveal the validity and reliability of the scale tool.
References Adelson, J. L. (2006). Math and Me Survey. Unpublished instrument.
Adelson, J. L., & McCoach, D. B. (2011). Development and psychometric properties of the math and me survey: Measuring third through sixth graders’ attitudes toward mathematics. Measurement and Evaluation in Counselling
and Development, 44(4), 225-247.
Arici, O. (2013). Ogretmen goruslerine gore ogrencilerin matematik dersine yonelik tutumlarini etkileyen faktorlerin olceklenmesi calismasi ⦋A scaling study for the factors affect the attitudes of students towards maths lesson according to the views of teachers⦌. Ege Journal of Education, 14(2), 25-40.
Askar, P. (1986). Matematik dersine yonelik tutumu olcen likert-tipi bir olcegin gelistirilmesi [Development of a Likert-type mathematics attitude scale]. Education and Science, 11(62), 31-36.
Baykul, Y. (1990). Ilkokul besinci siniftan lise ve dengi okullarin son siniflarina kadar matematik ve fen derslerine karsi
tutumda gorulen degismeler ve ogrenci secme sinavindaki basari ile iliskili oldugu dusunulen bazi faktorler ⦋The
change in attitude towards mathematics and sciences observed in students from the fifth grade to the end of high school and factors that are related to success in the students selection examinations⦌. Ankara: OSYM Yayinlari. Buyukozturk, S. (2007). Sosyal Bilimler Icin Veri Analizi El Kitabi [Handbook of Data Analysis in Social Sciences]. Ankara:
Pegem A Yayincilik.
Creswell, J. W. (2002). Educational Research: Planning, Conducting, and Evaluating Quantitative and Qualitative
Research. New Jersey: Merrill Prentice Hall.
Di Martino, P., & Zan, R. (2011). Attitude towards mathematics: a bridge between beliefs and emotions. ZDM, 43(4), 471–482.
Doepken, D., Lawsky, E., & Padwa, L. (1993). Modified Fennema-Sherman attitude scales. Paper presented at the Woodrow Wilson Gender Equity in Mathematics and Science Congress, Princeton, in June, 1993.
Duatepe, A., & Cilesiz, S. (1999). Matematik tutum olcegi gelistirilmesi [Development of a scale attitudes towards mathematics]. Hacettepe University Journal of Education, 16-17, 45-52.
Erol, E. (1989). Prevalence and correlates of math anxiety in Turkish high school students (Unpublished master’s thesis). Bogazici University, Istanbul, Turkey.
Evans, J., Hannula, M., Zan, R., & Brown, L. (2006). Affect in mathematics education—Exploring theoretical frameworks.
Educational Studies in Mathematics, (Special Issue), 63(2).
Fennema, E., & Sherman, J. A. (1976). Fennema-Sherman mathematics attitude scale: instruments designed to measure attitudes toward the learning of mathematics by females and males. Journal for Research in Mathematics
Education, 7(5), 324-326.
Field, A. (2013). Discovering statistics using IBM SPSS (4th ed.). London: Sage Publications.
Haciomeroglu, G. (2017). Matematige yonelik tutum olcegi kisa formunun gecerlik ve guvenirlik calismasi [Reliability and validity study of the attitude towards mathematics instruments short form]. Journal of Computer and
Education Research, 5(9), 84-99.
Kline, R. B. (2011). Principles and Practice of Structural Equation Modeling. New York, NY: Guilford.
Leavy, A., Hourigan, M., & Carroll, C. (2015). Exploring the impact of reform mathematics on entry-level pre-service primary teachers attitudes towards mathematics. International Journal of Science and Mathematics Education, 15, 509-526.
Lim, S. Y., & Chapman, E. (2013). Development of a short form of the attitudes toward mathematics inventory.
Educational Studies in Mathematics, 82, 145-164.
Lin, S. H., & Huang, Y.C. (2016). Development and application of a Chinese version of the short attitudes toward mathematics inventory. International Journal of Science and Mathematics Education, 14(1), 193-216.
Ma, X., & Kishor, N. (1997). Assessing the relationship between attitude toward mathematics and achievement in mathematics: A meta-analysis. Journal for Research in Mathematics Education, 28(1), 26–47.
McLeod, D. B. (1992). Research on affect in mathematics education: A reconceptualization. In D. G. Grouws (Ed.),
Handbook of research on mathematics teaching and learning (pp.575-596). New York: McMillan.
Mulhern, F., & Rae, G. (1998). Development of a shortened form of the Fennema-Sherman Mathematics Attitude Scale.
Educational and Psychological Measurement, 58, 295-306.
Nazlicicek, N., & Erktin, E. (2002). Ilkogretim matematik ogretmenleri icin kisaltilmis matematik tutum olcegi [Attitude towards mathematics instruments short form for elementary school mathematics teachers]. 5th National Science
and Mathematics Education Congress Proceedings, 860-865.
Onal, N. (2013). Ortaokul ogrencilerinin matematik tutumlarina yonelik olcek gelistirme calismasi [A study on the development of a middle school students’ attitudes towards mathematics scale]. Elementary Education Online, 12(4), 938-948.
Shen, C., & Talavera, O. (2003). The Effects of Self Perception on Students' Mathematics and Science Achievement in 38
Countries Base on TIMSS 1999 Data. Retrieved May 25, 2016 from http://ideas.repec.org/p/boc/asug03/08.html.
Sencan, H. (2005). Sosyal ve davranissal olcumlerde guvenirlik ve gecerlik [Reliability and validity in social and behavioral measurement]. Ankara: Seckin Yayincilik.
Tabachnick, B. G., & Fidell, L. S. (2007). Using multivariate statistics (5th ed.). New York: Pearson.
Tabuk, M., & Haciomeroglu, G. (2015). Turkish adaptation of attitude towards mathematics instrument. Journal of
Theory and Practice in Education, 11(1), 245−260.
Tapia, M. (1996). The attitudes toward mathematics instrument. Paper presented at the annual meeting of the Mid-South Educational Research Association, Tuscaloosa, USA, 6−8 November 1996.
Tapia, M., & Marsh, G. E. (2004). An instrument to measure mathematics attitudes. Academic Exchange Quarterly, 8(2), 16−21.
Tavsancil, E. (2002). Tutumlarin Olculmesi ve Spss ile Veri Analizi [Analysis of Attitudes and Data Analysis with SPSS], Ankara: Nobel Yayincilik.
Ural, A. (2007). Isbirlikli ogrenmenin matematikteki akademik basariya, kaliciliga, matematik ozyeterlilik algisina ve
matematige karsi tutuma etkisi [The effect of cooperative learning on mathematics academic achievement,
retention, mathematics self-efficacy and attitudes towards mathematics] (Unpublished doctoral dissertation). Gazi University, Ankara, Turkey.
Uzel, D. (2007). Gercekci Matematik Egitimi (RME) destekli egitimin ilkogretim 7. sinif matematik ogretiminde ogrenci
basarisina etkisi [The effect of the education supported by realistic mathematics education on students
achievement in mathematics teaching of primary school 7th class] (Unpublished doctoral dissertation). Balikesir
University, Balikesir, Turkey.
Valentine, J.C, DuBois, D.L, & Cooper, H. (2004). The relations between self-beliefs and academic achievement: A systematic review. Educational Psychologist, 39, 11.