Criticality of sustainable Research and Development-led Growth in EU: The
role of Renewable and Non-Renewable Energy
Nezir KOSEa
a İstanbul Aydin University
School of Applied Sciences,
Department of Management Information Sciences, Kucukcekmece, İstanbul, Turkey
E-mail: [email protected]
Festus Victor BEKUN a, b, 1
a Faculty of Economics Administrative and Social sciences,
Istanbul Gelisim University, Istanbul, Turkey
b
Department of Accounting, Analysis and Audit School of Economics and Management South Ural State University, 76, Lenin Aven.,
Chelyabinsk, Russia 454080. E-mail: [email protected]
Andrew Adewale ALOLAa, b, c
aFpaculty of Economics Administrative and Social sciences,
Istanbul Gelisim University, Istanbul, Turkey.
bDepartment of Accounting, Analysis and Audit
School of Economics and Management South Ural State University, 76, Lenin Aven.,
Chelyabinsk, Russia 454080
cAviola Consult ltd, Nigeria.
E-mail: [email protected]
1
Abstract
The path to sustainable economic growth and development has preoccupied most economies and the European Union member countries is no exception. Thus, the current study is aimed at revisiting the energy-induced growth by disaggregating energy consumption into (renewable and non-renewable energy consumption) as means of growth. Also, the role of research and development (R&D) in the attainment of sustainable growth in the panel of European Union (EU) countries over the period 1997-2014 is examined. Accordingly, the preliminary investigation revealed a significant evidence of cointegration in the panel of estimated variables. The study also expectedly suggests that 1 percent increase in non-renewable energy consumption, renewable energy consumption and R &D in the long-run is responsible for a respective increase of 0.60 percent, 0.13 percent and 0.05 in the panel countries growth. Furthermore, the causality evidence from renewable energy consumption to economic growth is not only significant but is observed in more countries than the causality from non-renewable energy consumption to economic growth. Thus, it implies that the commitment to sustainable growth and climate actions of the EU countries is fact yielding desirable outcome. Similarly, research development is observed to play a significant and causality impact on the economic growth of the panel countries. In general, the study posits an interesting and a potentially-effective policy outlook and economic perspective for the bloc countries.
1. Introduction
The past years of economic downturn did not spear the European Union (EU) countries from a tumultuous economic performance, but the bloc’s economy had since returned to path of gradual and stable growth in recent time. In returning the economy of the EU to the path of growth, an accommodative monetary and expansionary fiscal policy in addition to the global economy outlook has played significant impact leading to robust a growth since 2017 (The Organization for Economic Co-operation and Development, OECD, 2018). Specifically, in spite of the global uncertainties in the current year (2019), growth has been forecasted for the real Gross Domestic Product (GDP) growth in all the EU member states (European Commission, EC, 2019a). The European Commission report forecasted a continuous trajectory expansion of the EU economy that is mostly inspired by increased domestic demand even beyond the year 2019. In spite of the significant and negative impact of the external environment on the member states of the EU and the export-oriented sectors had not affected the critical growth experienced from the region’s domestic demand. This translates that the domestically-inspired innovations amidst increased energy consumption and economic oriented policies are crucial to the resilient growth experienced by the EU member states.
Importantly, the forecasted GDP growth of 1.5% for 2020 in the euro area (1.7% in EU27) against the 1.2% growth expected for 2019 amidst unemployment and stronger wage growth dynamics is reportedly hinged on the oil price developments. In extant studies, evidence has revealed the perspective of energy-led growth hypothesis of the EU area and for specific countries of the block (European Commission, EC, 2019b). (Ozturk & Acaravci,2010; Tang & Shahbaz, 2011; Caraiani, Lungu & Dascălu, 2015; Ozturk & Acaravci,2013; Asongu et al.,2016;Hasanov, Bulut & Suleymanov, 2017; Alola, Yalçiner, Alola & Saint Akadiri, 2019). In
spite of the commitment of the EU to cut its energy consumption by 20%, the earlier evidence suggested that gross inland energy consumption within the EU-28 in 2015 attained 1627 million tonnes of oil equivalent (Mtoe) (European Commission, 2018). However, the European Commission (2018) reported that the EU Member State’s gross inland consumption mainly depends on the energy portfolio, the availability of primary energy sources, and the economy structure.
In tandem with the above motivation highlight, the current study examines the research development-led growth in the panel of selected EU countries over the period 1997-2014 with new perspective to the extant literature. This study contributes in two front to the frontier of knowledge. First, in terms of scope by disaggregating energy consumption into renewable and non-renewable energy consumption in the growth model. This is to capture partial impact of both indicators impact on economic growth for EU bloc investigated. This study also incorporates research and expenditure to the fitted growth model to circumvent for omitted variable bias, which previous studies fail to address. Previously considering the earlier revelations from the energy-leg growth hypothesis literature. Only few studies exist for the theme by like that of (Zafar et al.2019; Freimane & Bāliņa, 2016) for Asia-Pacific Economic Cooperation countries (APEC) European countries respectively. Moreover, the current study seeks to add more insight since it incorporated research development in the growth model especially for the case of the European Union countries. Second, on methodology front, the current study is conduct in a panel framework by pooling both time series and panel dimension together. The results from panel estimators are more powerful, consistent than single countries studies given the strength from combining both time series and cross-sectional dimension of panel estimators Baltagi et al (2005). The present study employs recent and updated panel techniques that ameliorate for
cross-sectional dependency and heterogeneity in the panel investigated. For instance in order to investigate the direction for causality flow the novel methodology of Emirmahmutoğlu and Kose (2011) causality approach is employed in a novel style to further provide policy intuition from the pairwise relationship estimates of the concern variables.Thus, studies of this sort is timely and worthwhile to the energy-growth literature.
The rest of the sections are presented as follow. Section 2 presents related literature. Subsequently the data description and estimation techniques employed are presented in section 3. The results and interpretations are discussed in section 4 while section 5 offers concluding remarks with policy implications and recommendation for future study.
2. Literature Review
The section concentrates on stylized review of related studies on the theme and variables under consideration.
Recent statistics from the United State energy information Administration (EIA, 2018) has identified energy consumption as key catalyst for economic expansion across economies either developed, emerging or developing. Since the seminal study of Kraft and Kraft (1978) for the case of United States where one-way causal relationship is observed from GNP to energy and neutrality causality between energy and GNP. The study validates the role of energy consumption to gross national product over the study period. There exist well-documented studies in the extant literature on the nature of causality flow between the energy, economic growth and other macroeconomic indicators with diverse econometrics procedure. The extant literature can be divided into four groups in terms of causality direction. (i) Conservative hypothesis (ii) Growth-induced hypothesis (iii) feedback hypothesis and (iv) Neutrality
hypothesis2 . The study of Kraft and Kraft (1978) was an ushering of several other studies like see ( Alola, 2019; Alola et al., 2019; Bekun et al., 2019; Balsalobre-Lorente et al., 2019; Asumadu-Sarkodie & Owusu, 2017; Asongu et al.,2017). More recently, bulk of the literature has also investigated into the environmental Kuznets Curve hypothesis (EKC). The EKC theme conceptualize the trade-off relationship between income growth and environmental degradation (Katircioglu et al., 2018; Sinha et al., 2017 Adedoyin et al., 2019).
In a recent and related study, Zafar, Shahbaz, Hou & Sinha (2019) examined the influence of research and development on economic growth amidst the impact of renewable and non-renewable energy consumption. By considering the case of 16 Asia-Pacific Economic Cooperation Countries (APEC), Zafar, Shahbaz, Hou & Sinha (2019) employed investigated the long-run output elasticities for both panel and individual countries over the period 1990-2015. In expectation, the study implies that research and development in the panel countries is potentially significant to to cause economic growth especially in the long-run. The study provided the reason for the research and development-growth nexus as innovations, the transition in technology and energy use (the change from obsolete technology to new technology and effective production pathways. In regard to country basis, the study noted that the impact of research and development on economic growth is positive and significant for Canada, Chile, China, Japan, New Zealand, Peru, Russia, Thailand, and the United States. In addition, the renewable and non-renewable energy contribution to economic growth in the panel of examined countries is observed to be positive and significant.
2
For brevity, details into the energy literature interested reader can see the studies of Ozturk (2010) literature survey and study of Bekun and Agboola (2019).
Furthermore, Freimane and Bāliņa (2016) examined the contributory role of research and development expenditure on the economic expansion of the panel of European Union (EU) member states over the period 2000-2013. Accordingly, the impact of research and development on the gross domestic product per person employed in the panel countries is observed to be positive and significant. In retrospect, while the 10% increase in research and development intensity is observed to be responsible for 0.2% in the short-run economic growth, the impact in the long-run is observed to cause about 0.9% permanent increase in the GDP per person employed. Interestingly, the study found that the impact of R&D on GDP growth in the new EU member states is lower as compared to that of the old member states. Specifically, only four (4) of the new EU member countries experience an increasing growth of 1% in response to the increase in research and development innovations. Additionally, this observation was only noticeable during the 2000-2013 period and with Greece (an old member states) equally experience a low response of GDP to the increasing impact of research and development.
Moreover, the study of the relationship between energy sources vis-à-vis mainly renewable and non-renewable and economic growth has been sporadically considered in extant literature (Suárez, Prieto & Fernández, 2013; Tang & Tan, 2013; Shahbaz, Rasool, Ahmed & Mahalik, 2016; Alola & Yildirim, 2019; Zappa, Junginger & van den Broek, 2019). While Shahbaz, Rasool, Ahmed and Mahalik (2016) examined the role of biomass energy consumption in the economic growth of the panel of BRICS (Brazil, Russia, India, China, and South Africa) countries, Alola and Yildirim (2019) considered the role of renewable energy consumption by sectors in the growth of household income. Indicatively, Shahbaz, Rasool, Ahmed and Mahalik (2016) observed that biomass energy consumption stimulates economic expansion in the panel of BRICS countries especially in the long-run. The study further noted that the impact of biomass
energy consumption on the economy of the BRICS countries is being enhanced by capital increments and trade openness. Similarly, Alola and Yildirim (2019) strongly maintained that there is a significant impact of renewable energy consumption by sectors (especially from residential and consumption, electric and power, and industrial and transportation) on rather the disposable income. In this case, the real disposable income is being considered in lieu of the GDP for the United States, thus the study offers significant policy suggestions.
3. Data Description and Methodological Procedure
The present study examines the relationship between energy consumption decomposed into renewable and non-energy consumption, research and development and economic growth in a balance setting using annual frequency data from 1997-2014 for selected EU countries3. To this end, panel econometrics methodology is employed to operationalize the relationship over the outlined variables4. The empirical route of this study follows four path namely (a) First, preliminary tests of basic statistics and correlation analysis of underlined variables (b) test of unit root properties of the variables with ADF and Im, Pesaran and Shin (2003) unit root test . This is pertinent to circumvent for spurious and avoidance of working with variables integrated in order 2. (c) Investigation of equilibrium relationship among the series under review via Pesaran et al., (1999) and finally (d) detection of causality analysis with the recent and novel methodology of Emirmahmutoglu and Kose (2011), the techniques is unique with the ability to be produce country-specific causality statistic as well as capture slope heterogeneity in panel data.
The methodology is robust in heterogeneous mixed panel under cross sectional dependency. As earlier mentioned, the current study adopts the Emirmahmutoglu and Kose (2011) methodology
3 The countries were constrained based on data availability. The countries include Austria, Belgium, Bulgaria,
Cyprus, Denmark, Finland, France, Germany, Greece, Ireland, Italy, Netherland, Portugal, Spain, Sweden, and United Kingdom.
that is an extension and improvement of Toda and Yamamoto (1995), which uses the level VAR model with extra dmax lags to test Granger causality between variables in heterogeneous mixed panels. Thus this test can be applied to panels for stationary, non-stationary, cointegrated and non-cointegrated series. The Emirmahmutoğlu and Kose (2011) extended the LA-VAR heterogeneous mixed panel Granger causality can be presented as:
, = + ∑ , , + ∑ , , + , (1) , = + ∑ , , + ∑ , , + ,
(2)
Here the subscript i represents the individual cross-sectional dimension while t denotes time period. Also, means the lag and, depicts the maximum integration order of the outlined variables. For this study, , , i= 1,2, …N indicate GDP on the other hand, , , i= 1,2, …N
means to R-D, REN and NREN5. Granger noncausality hypothesis for the panel is tested by using the Fisher statistic that is defined as follow:
= −2 ( )
where is the probability corresponding to the individual modified Wald statistic. The Fisher statistic has an asymptotic chi-square distribution with 2N degrees of freedom. The probability values for panel statistics are derived from bootstrap distributions, this methodology considers the cross-section dependency.
<Insert Table 1>
5
The functional relationship that conceptualized the nexus between the outlined variables follows after the studies of (Zafar et al.,2019; Nguyen & Kakinaka, 2019;Wei et al.,2019). The functional form is expressed as:
( , , )
GDP f NREN NREN RD (3)
, 1 , 2 , 3 , ,
i t i t i t i t i t
LnGDP LnNREN LnREN LnRD (4)
Where, denotes intercept terms while the ' s are partial slope coefficients to be estimated
while the represents the stochastic term i t,
4. Empirical Results, Interpretations and Discussion
This section of this study dwells on interpretation of empirical outcome with corresponding stylized intuitive discussion. The section set off with preliminary discussion of basic summary statistics that comprises of averages, maximum, minimum, measures of dispersion like standard deviation, coefficient of variation as well as symmetric nature of the underlined variables as reported by kurtosis, skewedness, normality test by Jarque- Bera statistics. Subsequently, Pearson correlation matrix analysis is conducted to investigate the one to one relationship between the variables outlined in Table 1. Statistical significant relationship exists between economic growth and energy consumption (renewable and non-renewable energy) and also research and development6.
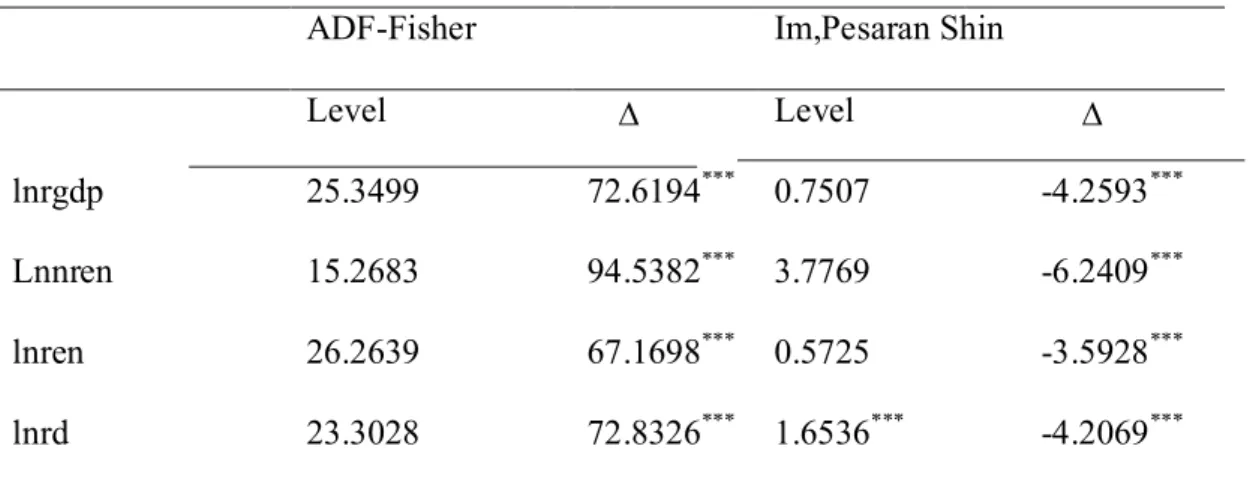
The need for stationarity test in econometrics literature is crucial to examine the maximum order of integration of variables as well as aid in avoid working with series integrated to order 2 ~ I(2) and my extension spurious inferences. Thus, the current study conducts unit root test as reported in Table 2. The result presents the outlined variables are integrated of order 1. Next step
6
For the want of space, the results of summary statistics and correlation analysis can be made available upon request.
investigation of the equilibrium relationship among the interest variables as reported by the Pedroni and Johansen fisher cointegration test with null of no cointegration in Table 3. The both cointegration tests are in harmony, both test statistics traces long-run equilibrium relationship between the variables over the period under review7.
<Insert Table 2> <Insert Table 3> <Insert Table 3> <Insert Table 4> <Insert Table 5a> <Insert Table 5b>
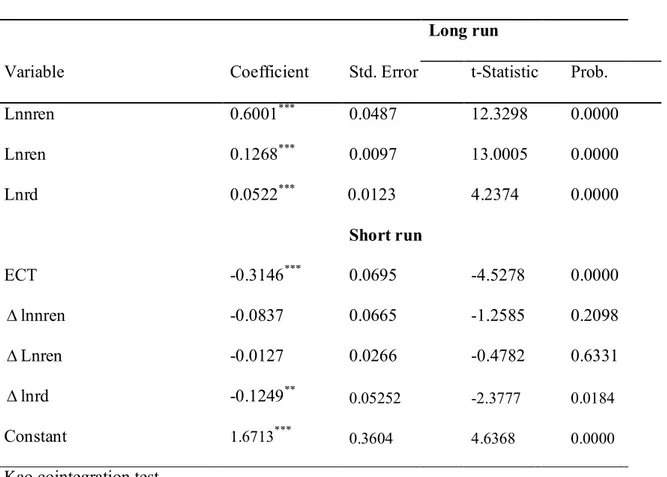
The need to explore the magnitude of long-run coefficients among the variables under review inform the use of Pesaran’s ARDL-PMG method. The results simultaneously report both short and long run dynamics rendered in Table 4. The error correction term (ECT) that declare the speed of convergence between the variable satisfactory pass the 1% statistical significant level. The result reports that 31.4% speed of adjustment to the equilibrium path by the variables in case of disequilibrium by the contribution of the regressors (renewable and non-renewable energy consumption, research and development) on an annual basis. Empirical results from the long run regression shows an inverse relationship between non-renewable energy consumption and economic growth in the short run. That is a 1% increase in nonrenewable energy consumption, the consumption of fossil fuel sources decreases economic output by 0.3146%. Contrary in the long run, we observe a statistical positive relationship between renewable energy sources and
7
The Pedroni cointegration test is in harmony with Johansen fisher cointegration test. Results of Johansen fisher cointegration test can be made available upon request.
economic growth. This outcome is in line and consistent with the finding of Zafar et al.,(2018) for Asia-Pacific Economic Cooperation (APEC) countries. Similarly, for renewable energy consumption in the short run a negative nexus exist with economic growth while a positive relationship is seen between both variables. These outcomes are instructive for policymakers and environmental scientist in EU countries investigated. We observe that much is required as we see a positive tie between energy consumption and economic growth. This is consistent with the preposition of the United State Energy Information Agency (EIA, 2018). However, there is need for caution as consumption of non-renewable energy consumption has its environmental implication(s) for the environment. This is because non-renewable energy consumption trigger increase carbon dioxide emissions that increase pollutant emissions is the environment. Thus, the need for a paradigm shift to cleaner (renewables) like hydro, wind, biomass and solar energy sources are timely and encouraged. This is position has been advocated in the literature by studies of Emir and Bekun (2019) for the case of Romanian, Alola (2019) for USA, Alola and Alola (2018) for coast Mediterranean countries, Bekun et al (2019b) for Selected EU countries, Bekun et al (2019a) for South Africa, and Shahbaz, Khan and Tahir (2013) for the case of China. Furthermore, we see that the level of country’s research and development (R&D) trigger economic growth. This is insightful as the need to increase innovation of R& D increases in EU member countries economic growth in the long run over our sampled period. This is in agreement with the finding of Zafar et al (2018). The policy deduction from the study empirical finding is that EU member countries are enjoined to strength her growth indicators such as been identified in this study (Energy consumption, R&D). Thus, government administrators in EU should intensify more energy sources especially renewables and R& D in efficient energy consumption, technology to trigger increase economic growth. However, there is need for
caution on the economic growth trajectory of EU countries for the quality of the environment. This is in order not to reach the desired economic growth at the jeopardy of the environment as outline by the environmental Kuznets hypothesis (Shahbaz & Shina, 2019).
To further compliment the above results and to achieve the desired study objective, the result from the Emirmahmutoglu and Kose (2011) causality as indicated in Table 5 posits an interesting outlook. Accordingly, the causality from GDP to NREN for Austria, Bulgaria and Finland is significant and uni-directional. However, there is a significant bi-directional causality from NREN to GDP in Netherland while the causality from NREN to GDP in the United Kingdom is uni-directional. The results obtained are insightful and it clearly depicts the EU-member states strides to decoupling energy consumption (fossil fuel base) from economic growth in the strides for increase economic output. However, few member state need to intensify their commitment to attain the green environment targets. To further buttress the laudable strides of |EU member state on their energy target, the current study observe causality running from renewable energy consumption to economic growth for Bulgaria, Germany, Netherland and Portugal. This is very indicative for energy specialist and policymakers to sustain the current momentum and encourage other member’s countries to the sustainability of the green growth powered by renewable energy consumption. This results is consistent with the study of Bekun et al (2019) for selected EU countries and Alola, (2019) for the United States. The present study also validated the research induced growth hypothesis as we observed R&D has predictability power for economic growth in Austria, Cyrus, Denmark. This is also true for the study of Zafar et al (2018) for Asian- Pacific Economic cooperation countries. Thus, the relevant policymakers in these investigated countries are encouraged to formulate and design energy blueprint that is capable of fostering production of renewables which in turn translates into increase share of renewable
energy in their energy mix. Also the need to encourage innovation as it regards to R&D expenditure should be encouraged in the EU countries investigated over the sampled period for higher economic growth. This is in order to achieve the sustainable development Goals (SGD’s)
5. Concluding Remarks
The importance of energy consumption over the years has grown. This is credit to its positive socioeconomic impact on economy and attainment of the sustainable development goals (SDG’s). The presents study complements the already existing energy literature on the nexus between energy consumption and economic growth. This study extends the body of knowledge by disaggregation of energy consumption into renewable and non-renewable energy consumption as well as incorporating research and development in the model. The incorporated research and development variable is justified considering the EU’s 3 percent target of the share of R&D in GDP expenditure by 2020. Additionally, the incorporated R&D is essential in the model as a means of controlling for the omitted variable bias in the econometric setting.
By exploring the nexus between the outlined variables, a mixed panel lag augmented vector autoregressive methodology advanced by Emirmahmutoglu and Kose (2011) is used to detect the direction of causality between the variables. Additionally, the Pesaran’s ARDL-PMG method that account for both the short-run and long-run estimations for the panel of EU countries over the period 1997-2014 provided concise and significant results. For instance, the result opined that there exists a positive impact of non-renewable energy consumption, renewable energy consumption and research and development on the economy of the panel EU-member countries. Although these examined growth factors present an undesirable impact in the short-run, the aforementioned positive long-run impact is significant, thus presenting a policy oversight to the stakeholders in the bloc. Importantly, the positive of energy consumption on economic growth is
expected especially for the estimated case of the EU countries. This proposition aligns with the position of United State Energy Information Agency (EIA, 2018). However, caution should be put in place in the consumption of nonrenewable energy sources, given the environmental implication(s) of consumption of fossil fuel based energy. Furthermore, empirical piece of evidence also lend support to the R&D-induced economic growth for the EU countries as opined by Goel et al (2008) for the case of the United State.
In recent time, the economic policy of the EU countries has been reprioritized and are more inclusive. Specifically, members are being encouraged to increase the gross domestic expenditure on R&D as a percentage GDP (R&D intensity) to meet the 3% target by 2020. Learning from the current study, the policymakers of these investigated panel countries could further formulate, design energy and advance workable blueprint to foster production of renewables via R&D, thus translating into increase share of renewable energy and a diversified energy portfolio. Also, the need to encourage sector-wide innovations as it regards the R&D expenditure should be further advanced in the investigated EU countries. Lastly, the bloc’s policies especially toward attaining the Sustainable Development Goals (SGDs) could be further revised to accommodate the R&D expenditure targets of these economies.
References
Adedoyin, F. F., Gumede, M. I., Bekun, F. V., Etokakpan, M. U., & Balsalobre-lorente, D. (2019). Modelling coal rent, economic growth and CO2 emissions: Does regulatory quality matter in BRICS economies?. Science of The Total Environment, 136284.
Alola, A. A. (2019). The trilemma of trade, monetary and immigration policies in the United States: Accounting for environmental sustainability. Science of The Total Environment, 658, 260-267.
Alola, A. A., & Alola, U. V. (2018). Agricultural land usage and tourism impact on renewable energy consumption among Coastline Mediterranean Countries. Energy & Environment, 29(8), 1438-1454.
Alola, A. A., Yalçiner, K., Alola, U. V., & Saint Akadiri, S. (2019). The role of renewable energy, immigration and real income in environmental sustainability target. Evidence from Europe largest states. Science of The Total Environment, 674, 307-315.
Alola, A. A., & Yildirim, H. (2019). The renewable energy consumption by sectors and household income growth in the United States. International Journal of Green Energy, 1-8.
Asumadu-Sarkodie, S., &Owusu, P. A. (2017). A multivariate analysis of carbon dioxide emissions, electricity consumption, economic growth, financial development, industrialization, and urbanization in Senegal. Energy Sources, Part B: Economics, Planning, and Policy, 12(1), 77-84.
Asongu, S., El Montasser, G., & Toumi, H. (2016). Testing the relationships between energy consumption, CO 2 emissions, and economic growth in 24 African countries: a panel ARDL approach. Environmental Science and Pollution Research, 23(7), 6563-6573. Asongu, S. A., Le Roux, S., & Biekpe, N. (2017). Environmental degradation, ICT and inclusive
development in Sub-Saharan Africa. Energy Policy, 111, 353-361.
Baltagi, B. H., E. Bratberg and T. H. Holmås (2005) ‘A Panel Data Study of Physicians’ Labor Supply: The Case of Norway’, Health Economics, 14: 1035–45.
Bekun, F. V., &Agboola, M. O. (2019). Electricity consumption and economic growth nexus: evidence from Maki cointegration. Engineering Economics, 30(1), 14-23.
Bekun, F. V., Alola, A. A., &Sarkodie, S. A. (2019). Toward a sustainable environment: Nexus between CO2 emissions, resource rent, renewable and nonrenewable energy in 16-EU countries. Science of the Total Environment, 657, 1023-1029.
Bekun, F. V., Emir, F., & Sarkodie, S. A. (2019). Another look at the relationship between energy consumption, carbon dioxide emissions, and economic growth in South Africa. Science of the Total Environment, 655, 759-765.
Balsalobre-Lorente, D., Driha, O. M., Bekun, F. V., &Osundina, O. A. (2019). Do agricultural activities induce carbon emissions? The BRICS experience. Environmental Science and Pollution Research, 1-17.
Caraiani, C., Lungu, C. I., & Dascălu, C. (2015). Energy consumption and GDP causality: A three-step analysis for emerging European countries. Renewable and Sustainable Energy
Reviews, 44, 198-210.
European Commission, EC (2018). Archive: Consumption of Energy.
https://ec.europa.eu/eurostat/statistics-explained/index.php?title=Archive:Consumption_of_energy. (Accessed 10 September 2019).
European Commission, EC (2019a). Economic Forecast Documents.
https://ec.europa.eu/info/business-economy-euro/economic-performance-and- forecasts/economic-forecasts/spring-2019-economic-forecast-growth-continues-more-moderate-pace_en. (Accessed 10 September 2019).
European Commission, EC, (2019b). European Economic Forecast. Spring 2019.
https://ec.europa.eu/info/business-economy-euro/economic-performance-and- forecasts/economic-forecasts/spring-2019-economic-forecast-growth-continues-more-moderate-pace_en. (Accessed 10 September 2019).
Emir, F., & Bekun, F. V. (2019). Energy intensity, carbon emissions, renewable energy, and economic growth nexus: new insights from Romania. Energy & Environment, 30(3), 427-443.
Emirmahmutoglu, F., & Kose, N. (2011). Testing for Granger causality in heterogeneous mixed panels. Economic Modelling, 28(3), 870-876.
Energy Information Administration (EIA), 2018.available at https://www.eia.gov/ (access date 08.09.2019).
Freimane, R., & Bāliņa, S. (2016). Research and development expenditures and economic growth in the EU: A panel data analysis. Economics and Business, 29(1), 5-11.
Goel, R.K., Payne, J.E., Ram, R., 2008. R&D expenditures and US economic growth: A disaggregated approach. Journal of Policy Modeling, 30(2), 237–250.
Hasanov, F., Bulut, C., & Suleymanov, E. (2017). Review of energy-growth nexus: A panel analysis for ten Eurasian oil exporting countries. Renewable and Sustainable Energy
Reviews, 73, 369-386.
Im, K. S., M. H. Pesaran and Y. Shin (2003) ‘Testing for Unit Roots in Heterogeneous Panels’, Journal of Econometrics, 115: 53–74. doi.org/10.1016/S0304-4076(03)00092-7.
Katircioglu, S., Katircioglu, S., & Kilinc, C. C. (2018). Investigating the role of urban development in the conventional environmental Kuznets curve: evidence from the globe. Environmental Science and Pollution Research, 25(15), 15029-15035.
Nguyen, K. H., & Kakinaka, M. (2019). Renewable energy consumption, carbon emissions, and development stages: Some evidence from panel cointegration analysis. Renewable Energy, 132: 1049-1057. doi.org/10.1016/j.renene.2018.08.069
Ozturk, I., & Acaravci, A. (2013). The long-run and causal analysis of energy, growth, openness and financial development on carbon emissions in Turkey. Energy Economics, 36, 262-267.
Ozturk, I. (2010). A literature survey on energy–growth nexus. Energy policy, 38(1), 340-349. Ozturk, I., & Acaravci, A. (2010). CO2 emissions, energy consumption and economic growth in
Turkey. Renewable and Sustainable Energy Reviews, 14(9), 3220-3225.
Pesaran, M. H., Shin, Y., & Smith, R. P. (1999). Pooled mean group estimation of dynamic heterogeneous panels. Journal of the American Statistical Association, 94(446), 621-634. doi.org/10.1080/01621459.1999.10474156.
Shahbaz, M., Khan, S., & Tahir, M. I. (2013). The dynamic links between energy consumption, economic growth, financial development and trade in China: fresh evidence from multivariate framework analysis. Energy economics, 40, 8-21.
Shahbaz, M., Rasool, G., Ahmed, K., & Mahalik, M. K. (2016). Considering the effect of biomass energy consumption on economic growth: fresh evidence from BRICS region.
Renewable and Sustainable Energy Reviews, 60, 1442-1450.
Shahbaz, M., & Sinha, A. (2019). Environmental Kuznets curve for CO2 emissions: a literature survey. Journal of Economic Studies, 46(1), 106-168.
Sinha, A., Shahbaz, M., & Balsalobre, D. (2017). Exploring the relationship between energy usage segregation and environmental degradation in N-11 countries. Journal of Cleaner Production, 168, 1217-1229.
Suárez, I., Prieto, M. M., & Fernández, F. J. (2013). Analysis of potential energy, economic and environmental savings in residential buildings: Solar collectors combined with microturbines. Applied energy, 104, 128-136.
Tang, C. F., & Shahbaz, M. (2011). Revisiting the electricity consumption-growth nexus for Portugal: evidence from a Multivariate framework analysis.
Tang, C. F., & Tan, E. C. (2013). Exploring the nexus of electricity consumption, economic growth, energy prices and technology innovation in Malaysia. Applied Energy, 104, 297-305.
The Organization for Economic Co-operation and Development, OECD (2018). EA and EU Economic Snapshot. https://www.oecd.org/economy/euro-area-and-european-union-economic-snapshot/ (Accessed 10 September 2019)
Wei, Y., Li, Y., Liu, X., & Wu, M. (2019). Sustainable development and green gross domestic product assessments in megacities based on the emergy analysis method—A case study of Wuhan. Sustainable Development.
Zafar, M. W., Shahbaz, M., Hou, F., & Sinha, A. (2019). From nonrenewable to renewable energy and its impact on economic growth: the role of research & development expenditures in Asia-Pacific Economic Cooperation countries. Journal of cleaner production, 212, 1166-1178.
Zappa, W., Junginger, M., & van den Broek, M. (2019). Is a 100% renewable European power system feasible by 2050? Applied energy, 233, 1027-1050.
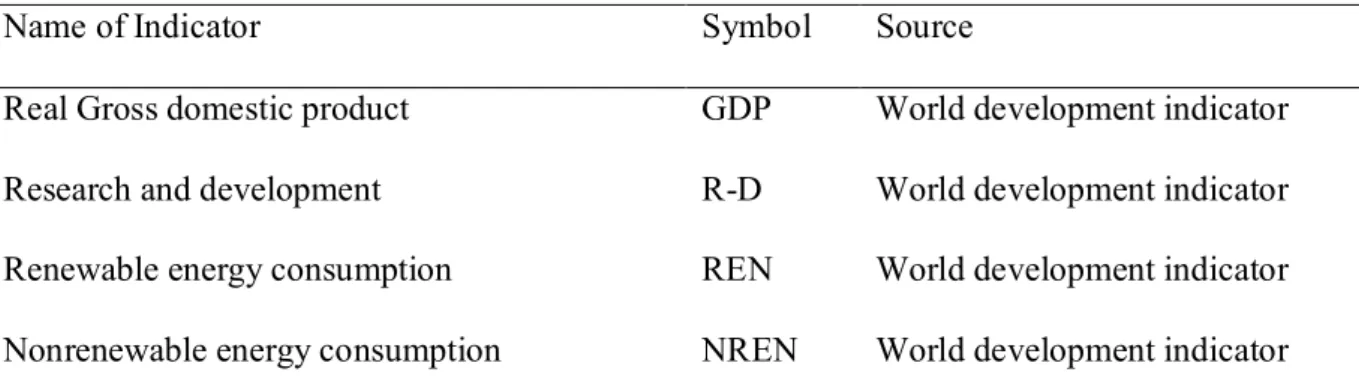
Table 1: Summary of data under consideration
Name of Indicator Symbol Source
Real Gross domestic product GDP World development indicator Research and development R-D World development indicator Renewable energy consumption REN World development indicator Nonrenewable energy consumption NREN World development indicator
Note: As earlier mentioned all data were source from world development indicators. Economic growth is measured
in (US$ constant 2010), renewable energy consumption in (% of total final energy consumption).Also nonrenewable energy in oil equivalent in Kg while research and development as percentage of GDP.
Table 2: Unit root results
ADF-Fisher Im,Pesaran Shin
Level Level lnrgdp 25.3499 72.6194*** 0.7507 -4.2593*** Lnnren 15.2683 94.5382*** 3.7769 -6.2409*** lnren 26.2639 67.1698*** 0.5725 -3.5928*** lnrd 23.3028 72.8326*** 1.6536*** -4.2069***
Note: The superscripts ***. **,* indicates 0.01, 0.05 and 0.10 statistical rejection respectively while
represents first difference. The fitted model for the unit root accounts for both individual intercept and trend.
Table 3: Pedroni cointegration test results Alternative hypothesis: Common AR coefs. (within-dimension)
Stat Prob. W.Stat Prob.
Panel v-Statistic 4.5202*** 0.0000 -0.4205 0.6630 Panel rho-Statistic 2.7092*** 0.9966 3.7058 0.9999 Panel PP-Statistic -0.3307 0.3704 -0.7277 0.2334 Panel ADF-Statistic -1.3539* 0.0879 -5.8398*** 0.0000
Alternative hypothesis: individual AR coefs. (between-dimension) Group rho-Statistic 4.5232 1.0000
Group PP-Statistic -1.5914 0.0558*
Group ADF-Statistic -3.2960 0.0005*** Note: The superscripts ***. **,* indicates 0.01, 0.05 and 0.10 statistical rejection respectively
Table 4: Pooled mean group with dynamic autoregressive distributed lag (PMG-ARDL(2, 1, 1, 1) Model: lngdp=f(lnnren,lnren,lnrd)
Long run
Variable Coefficient Std. Error t-Statistic Prob.
Lnnren 0.6001*** 0.0487 12.3298 0.0000 Lnren 0.1268*** 0.0097 13.0005 0.0000 Lnrd 0.0522*** 0.0123 4.2374 0.0000 Short run ECT -0.3146*** 0.0695 -4.5278 0.0000 lnnren -0.0837 0.0665 -1.2585 0.2098 Lnren -0.0127 0.0266 -0.4782 0.6331 lnrd -0.1249** 0.05252 -2.3777 0.0184 Constant 1.6713*** 0.3604 4.6368 0.0000
Kao cointegration test
t-Stat Prob.
ADF -2.9933*** 0.0014
Residual variance 0.000825
HAC variance 0.001288
Table 5a: The causality test result by Emirmahmutoglu and Kose (2011)
from nren to gdp from gdp to nren from ren to gdp from gdp to ren from rd to gdp from gdp to rd Country Lag Wald
p_valu e
La g Wald
p_valu
e Country Lag Wald p_valu
e Lag Wald p_valu
e Country Lag Wald p_valu e Lag Wald p_valu e 1 1 0.715 0.398 1 4.469 0.035 1 1 0.606 0.436 1 1.495 0.221 1 3 6.287 0.098 3 6.526 0.089 2 1 0.033 0.856 1 0.954 0.329 2 3 0.733 0.865 3 6.501 0.090 2 1 0.369 0.544 1 0.817 0.366 3 1 0.000 0.987 1 2.891 0.089 3 3 9.112 0.028 3 19.04 5 0.000 3 1 0.549 0.459 1 0.041 0.840 4 2 0.374 0.829 2 5.965 0.051 4 1 1.360 0.244 1 2.497 0.114 4 2 21.51 2 0.000 2 1.335 0.513 5 1 0.010 0.922 1 0.492 0.483 5 1 0.001 0.978 1 0.003 0.954 5 1 4.534 0.033 1 4.16 2 0.041 6 1 2.789 0.095 1 3.352 0.067 6 1 3.536 0.060 1 2.097 0.148 6 2 1.266 0.531 2 5.43 7 0.066 7 1 0.449 0.503 1 1.623 0.203 7 1 0.088 0.766 1 0.063 0.802 7 1 0.308 0.579 1 0.579 0.447 8 1 1.797 0.180 1 1.584 0.208 8 2 8.257 0.016 2 2.320 0.313 8 1 0.017 0.897 1 4.54 2 0.033 9 3 2.220 0.528 3 2.348 0.503 9 2 0.009 0.996 2 5.938 0.051 9 2 0.873 0.646 2 1.163 0.559 10 1 0.047 0.829 1 0.027 0.868 10 2 0.490 0.783 2 0.157 0.924 10 2 0.561 0.756 2 3.881 0.144 11 1 1.919 0.166 1 2.105 0.147 11 3 3.459 0.326 3 30.56 8 0.000 11 1 0.914 0.339 1 0.870 0.351 12 3 27.413 0.000 3 9.373 0.025 12 3 14.63 7 0.002 3 41.11 9 0.000 12 3 0.576 0.902 3 7.18 8 0.066 13 1 0.006 0.940 1 0.355 0.552 13 3 18.18 0 0.000 3 5.957 0.114 13 1 1.216 0.270 1 1.431 0.232 14 1 0.155 0.694 1 0.798 0.372 14 1 0.049 0.825 1 1.635 0.201 14 1 0.272 0.602 1 3.00 3 0.083 15 1 0.255 0.614 1 0.289 0.591 15 1 0.022 0.882 1 2.008 0.157 15 1 0.247 0.619 1 0.040 0.841 16 3 7.220 0.065 3 2.424 0.489 16 2 1.150 0.563 2 4.051 0.132 16 1 0.018 0.893 1 1.058 0.304
Panel Statistics Panel Statistics Panel Statistics
Fisher Test Stat 49.251 51.491 Fisher Test Stat 58.829 12
2 Fisher Test Stat 46.933 52 Bootstra p Critical Values 1% 119.80 4 111.28 6 Bootstra p Critical Values 1% 184.43 19 0 Bootstra p Critical Values 1% 94.574 96 5% 78.740 77.897 5% 85.611 87 5% 70.280 71. 8 10 % 65.283 65.682 10 % 70.711 73 10 % 60.877 62. 3
Table 5b: The causality test result by Emirmahmutoglu and Kose (2011)
from rd to nren from nren to rd from ren to nren from nren to ren from rd to ren from ren to rd Country Lag Wald
p_valu
e Lag Wald p_valu
e Country Lag Wald p_valu
e Lag Wald p_valu
e Country Lag Wald p_valu e Lag Wald p_valu e 1 3 6.406 0.093 3 6.433 0.092 1 2 9.206 0.010 2 4.062 0.131 1 2 0.518 0.772 2 1.678 0.432 2 1 2.305 0.129 1 1.590 0.207 2 3 2.627 0.453 3 8.381 0.039 2 1 3.109 0.078 1 0.000 0.985 3 1 0.063 0.801 1 0.161 0.688 3 1 0.237 0.626 1 0.939 0.333 3 1 2.640 0.104 1 0.213 0.644 4 1 0.027 0.869 1 0.180 0.671 4 1 2.443 0.118 1 1.068 0.301 4 2 11.67 2 0.003 2 4.535 0.104 5 1 0.058 0.809 1 0.004 0.952 5 1 0.004 0.950 1 0.239 0.625 5 1 0.055 0.814 1 1.708 0.191 6 2 0.134 0.935 2 1.731 0.421 6 3 11.79 8 0.008 3 20.91 4 0.000 6 1 1.095 0.295 1 0.014 0.904 7 2 1.160 0.560 2 6.223 0.045 7 1 3.698 0.054 1 38.67 7 0.000 7 1 0.000 0.988 1 2.140 0.143 8 1 2.759 0.097 1 0.465 0.495 8 2 4.721 0.094 2 7.492 0.024 8 1 0.101 0.751 1 0.534 0.465 9 2 15.43 6 0.000 2 1.373 0.503 9 3 12.00 3 0.007 3 4.507 0.212 9 1 0.780 0.377 1 1.401 0.237 10 2 2.813 0.245 2 0.494 0.781 10 1 1.848 0.174 1 0.719 0.396 10 3 0.582 0.900 3 2.595 0.458 11 2 0.539 0.764 2 0.934 0.627 11 3 3.478 0.324 3 3.170 0.366 11 1 0.376 0.540 1 1.637 0.201 12 3 7.773 0.051 3 10.41 2 0.015 12 2 2.040 0.361 2 5.278 0.071 12 3 0.914 0.822 3 41.04 6 0.000 13 2 2.875 0.238 2 0.280 0.869 13 3 6.631 0.085 3 0.648 0.885 13 3 9.296 0.026 3 0.854 0.837 14 1 0.762 0.383 1 0.012 0.913 14 1 0.186 0.666 1 6.005 0.014 14 1 1.403 0.236 1 7.009 0.008 15 1 3.335 0.068 1 0.034 0.854 15 1 2.036 0.154 1 0.591 0.442 15 2 15.76 3 0.000 2 5.607 0.061 16 1 0.236 0.627 1 1.762 0.184 16 1 5.080 0.024 1 0.962 0.327 16 1 1.173 0.279 1 0.046 0.831
Panel Statistics Panel Statistics Panel Statistics
Fisher Test Stat 51.806 34.2
3 Fisher Test Stat 70.830 110 Fisher Test Stat 57.584
77.40 0 Bootstra p Critical Values 1% 98.555 92.9 4 Bootstra p Critical Values 1% 122.18 140 Bootstra p Critical Values 1% 112.78 101.5 5% 70.180 68.8 2 5% 79.636 81. 3 5% 75.490 70.59 10 % 61.629 60.5 5 10 % 67.548 69. 7 10 % 64.753 61.46
Note: Here 1=Austria=2, Belgium,3=Bulgaria, 4=Cyprus, 5= Denmark, 6= Finland,7= France,8= Germany,9= Greece, 10= Ireland, 11= Italy,12=