Full Terms & Conditions of access and use can be found at
http://www.tandfonline.com/action/journalInformation?journalCode=cira20
Download by: [Bilkent University] Date: 12 November 2017, At: 23:51
ISSN: 0269-2171 (Print) 1465-3486 (Online) Journal homepage: http://www.tandfonline.com/loi/cira20
Inflation Dynamics and its Sources in the Ottoman
Empire: 1586–1913
Hakan Berument & Asli Gunay
To cite this article: Hakan Berument & Asli Gunay (2007) Inflation Dynamics and its Sources in
the Ottoman Empire: 1586–1913, International Review of Applied Economics, 21:2, 207-245, DOI: 10.1080/02692170701189102
To link to this article: http://dx.doi.org/10.1080/02692170701189102
Published online: 29 Mar 2007.
Submit your article to this journal
Article views: 122
View related articles
ISSN 0269-2171 print; ISSN 1465-3486 online/07/020207-39 © 2007 Taylor & Francis DOI: 10.1080/02692170701189102
Inflation Dynamics and its Sources in the Ottoman
Empire: 1586–1913
HAKAN BERUMENT* & ASLI GUNAY**1
*Bilkent University, Ankara, Turkey, **Middle East Technical University, Ankara, Turkey Taylor and Francis Ltd
CIRA_A_218833.sgm 10.1080/02692170701189102 International Review of Applied Economics 0269-2171 (print)/1465-3486 (online) Original Article 2007 Taylor & Francis 21 2 000000April 2007 HakanBerument [email protected]
ABSTRACT This study examines the dynamics and determinants of inflation in the Otto-man Empire during the 1586–1913 period. There are two possible reasons for inflation: fiscal expansion and monetary expansion, which could be generated through the
debase-ment of local currency (Akçe). We used a set of political and structural variables in order
to explain the change in inflation dynamics. In particular, we considered the war years,
periods of Ottoman history that show different characteristics (the slow-down period, the
recession period and the break-up period) and the period of constitutional monarchy.
More-over, we tested whether the inflation process was the same for each sultan and whether each sultan’s behavior during the first year was different from the rest of his reign. The empirical evidence reported here suggests that war accelerated inflation as expected and fiscal
expan-sion rather than the debasement of the Akçe was the main reason for inflation. Moreover,
the slow-down, the recession and the break-up periods affected inflation positively; both
fiscal expansion and the debasement of the Akçe were seen in these three periods as sources
of inflation. While employing different inflationary policies during his reign, each sultan
accelerated inflation in the first year of his reign by the debasement of the Akçe or by fiscal
expansion. Last, the constitutional monarchy period had a significant positive effect on
inflation although fiscal expansion, rather than the debasement of the Akçe, was the source
of inflation during this period.
KEY WORDS: Inflation, debasement, fiscal expansion, Ottoman Empire. JEL CLASSIFICATIONS: E31, H11, H30
1. Introduction
This paper studies the dynamics and determinants of inflation in the Ottoman Empire during the 1586–1913 period. Even though the sources of inflation could be numerous, we will consider two possible reasons for inflation; monetary expansion as a result of the generation of seigniorage revenue by debasing the local currency (Akçe) and fiscal expansion. The reason for this concentration on Correspondence Address: Hakan Berument, Department of Economics, Bilkent University, 06800 Ankara, Turkey (Tel: +90-312-2662529; Fax: +90-312-2665140; E-mail: [email protected]).
monetary and fiscal variables is that other variables such as supply side shocks, which stem from weather conditions or trade restrictions, are unlikely to be persis-tent and are difficult to observe for a such a long period of time. We, then, used a set of political and structural variables in order to assess the interaction of inflation with these political variables.
We consider three main possible cases concerning the common notion of political intervention in an inflationary process. First, many wars were seen in the Ottoman period and financing a war means extra expenses. Hence, it could be interesting to examine the effects of war on the dynamics of inflation. Ferguson (1996) argues that war was inflationary in Germany during the First World War. Moreover, Bolbol (1999) finds that war was one of the main reasons for high infla-tion in Lebanon during the Civil War period. Similarly, our empirical results suggest that war accelerated inflation as was expected and fiscal expansion rather than the debasement of the Akçe was the source of inflation.
The second case is the theory of Partisan Political-Business Cycle (PBC), initi-ated by Hibbs (1977), which deals with characteristic differences in the economic policies of governments according to their constituencies. According to this line of thought, governments apply fiscal and monetary policies to favor their constituencies and economic outcomes such as the level of output and inflation. These variables fluctuate as a function of the ideology of the party in power so that they will be re-elected. For example, Alesina & Sachs (1988) show that the Republican Party in the USA has been relatively more concerned than the Democratic Party about inflation rather than output since the partisan theory suggests that Democratic voters will be more concerned about unemployment relative to inflation than Republican voters. Under the Democratic administra-tions, the deviation of output growth from the trend occurred mostly in the first half of the term, while the rate of growth of inflation was systematically different for the entire 4-year term. The Republican Party, however, tried to deviate infla-tion growth from the trend in the first half of their terms. That is, the real effects of new policies are stronger at the beginning of new administrations. Moreover, Alesina & Roubini (1992) show that elections and changes in government in 18 OECD economies affect inflation. They find that inflation tends to increase immediately after elections and long run partisan differences in the inflation rate are seen.
The Ottoman Empire was governed by sultans rather than political parties and there was no election system. Not all administrations had the same preferences regarding the level of inflation because not everybody was affected by inflation in the same way. The differences in the preferences of supporters caused the differences in the behavior of each sultan. Hence, different processes were observed after the accession to the throne of each new sultan. These processes represent attempts by the sultans to prevent rebellions by the soldiers and urban population. For example, the major constraint against the application of policies to overcome the unfavorable fiscal environment was the janissaries in Istanbul, special soldiers paid in the local currency (Akçe). For this reason, each sultan adopted different inflationary policies to gain the appreciation of his supporters and opponents in the first year of his reign. Therefore, we can examine how the Ottoman Empire shows the Partisan PBC by analysing each sultan’s inflationary acts. Our results suggest that each sultan’s reign showed different acceleration in inflation and policies for the debasement of the Akçe and fiscal expansion were the main sources of inflation. Moreover, each sultan increased inflation in his
sion.
We also took into account the different historical eras (the slow-down, the reces-sion and the break-up periods) in Ottoman history in order to see the waves of inflation and the sources of inflation during those periods because each era showed different social, economic and political characteristics. Our results show that the slow-down, the recession and break-up periods affected inflation posi-tively and the debasement of the Akçe or fiscal expansion were the main reasons for inflation.
The third case analyses the effects of the fractionalized governments (coalition or minority governments vs majority governments) on their inflationary policies. More fractionalized and more polarized governments (differences in ideological preferences) were seen in the constitutional monarchy period than in the absolute monarchy period. They faced greater difficulties in coordinating action over fiscal and monetary policies. Roubini & Sachs (1989) argue that it is more difficult for coalition governments to raise taxes and decrease government expenditures. Hence, a more fractionalized government causes higher budget deficits and inflation. Coalition is one of the main factors that leads to chronic and persistent inflation (Arce & Daniel, 1994). Minority parties and coalition governments are more constrained by electoral concerns, so they try to satisfy influential constitu-encies and special interests in order to be re-elected (Haynes & Stone, 1990). Hence, the debasement of the Akçe and fiscal expansion caused acceleration in inflation, resulting in unfavorable fiscal situations in the constitutional monarchy era. Our empirical evidence suggests that the period of constitutional monarchy had a posi-tively significant effect on inflation. However, anti-debasement acts rather than debasement were seen, and fiscal expansion was the main reason for increasing inflation in this period.
Pamuk (1997) argues that fiscal and monetary conditions in the Ottoman Empire emerged as the primary explanation for the debasement of the Akçe during the 17th century. The Ottomans faced severe fiscal pressures and struggled with rising military expenditures and the adverse consequences of inflation during this period. One of the main responses to this situation was currency debasement, which provided temporary financial relief but also contributed to a new momen-tum in price increases. Although the results of his study resemble ours, our research differs from his on three accounts. First, he did not focus on the dynamics of inflation analyses as deeply as we did; that is, he did not explain waves of infla-tion according to the important political structural variables. Second, Pamuk (1997) showed that inflation had adverse consequences on state finances. However, he only analysed the debasement of the Akçe as a source of state finances that caused inflation, whereas we also looked at the fiscal expansion as another main policy for inflation and examined the effects of fiscal expansion on inflation. Third, he examined only the 17th century for his debasement analyses, while we took into account the historical eras of the Ottoman Empire (the slow-down, the recession and the break-up periods) and the constitutional monarchy period in our analysis.
Our results show that debasement was one of the main reasons for the accelera-tion of inflaaccelera-tion in the 17th century, which confirms Pamuk’s (1997) results. However, we proposed that fiscal expansion was another main explanation for the variability of inflation during this period. This article provides evidence that the debasements were the results of fiscal difficulties and that the state benefited
in the short run. There was no such long-term strategy during this particular period. Similarly, when we analyse each sultan’s period separately, we can see that they did not follow the same policy although debasement occurred in all three historical eras in Ottoman history, but not during the period of constitutional monarchy.
This study extensively analyses inflation dynamics with the longest historical data series that is available for the Ottoman Empire. In addition, we examined the effects of different social and political situations on inflation movements. Therefore, these explanations may contribute to an understanding of why fiscal deterioration and inflation arose in the Ottoman Empire.
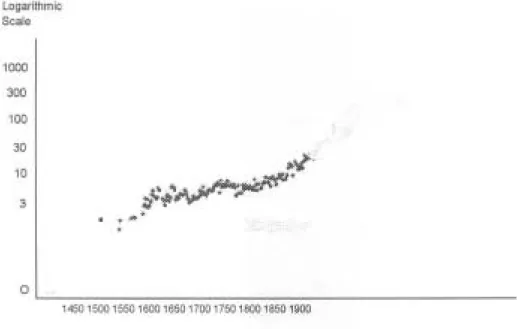
Before analysing the inflation dynamics, it might be useful to present a brief summary, focusing on the path of inflation over this period to throw light on Ottoman economic history. Pamuk (2000) analysed the monetary history of the Ottoman Empire and this study established the basic trends in prices in Ottoman history. Figure 1 shows the annual values of the overall price index, which combines the food prices obtained from the account books of pious foundations with the prices of non-food items. The vertical axis is given in log scale so that the slope of the line indicates the rate of change of nominal prices. These results indi-cate that prices increased approximately 300 fold between 1469 and the First World War. This overall increase corresponds to an average increase of 1.3% per year for the entire period.
Figure 1.Price index for Instanbul, 1469–1914 for Akçe: 1469 = 1.00.
The indices show that Istanbul experienced a significant wave of inflation from the late 16th century to the middle of the 17th century when prices showed a five-fold increase. This is the period usually associated with the Price Revolution of the 16th century, which has been the subject of one of the most enduring debates in European historiography and more recently in the
Figure 1. Price index for Instanbul, 1469–1914 for Akçe: 1469 = 1.00.
of silver, increased by more than 100% (and in some countries, by more than 200%) from the beginning of the 16th century to the middle of the 17th century has been well established and widely accepted (Braudel & Spooner, 1967). Evidence shows that after 1568 (and possibly even earlier) price increases were caused by an expansion in the money supply arising from the inflow of New World treasure into Spain (Schumpeter, 1954). After establishing that large increases in food and raw materials prices did take place, Barkan (1975) argued that these trends were imported into the Ottoman economy through trade with Europe via the Mediterranean. The indices also show, however, that a much stronger wave of inflation began late in the 18th century and lasted into the 1850s, during which time prices increased 12–15 fold. Most of the later increases were associated with debasements of the Akçe, which began in the 1780s and accelerated during the reign of Mahmud II (1808–1839). The highest rates of debasement of Akçe in Ottoman history took place during the reign of the reformist and centralizing sultan, Mahmud II. He was able to abolish the
janis-saries in 1826; therefore, a major constraint in the way of debasements of Akçe
was lifted. In contrast, the overall price level was relatively stable between 1650 and 1780 as well as from 1860 until the First World War.
The rest of this paper is organized as follows. The data is described in the second section. The methodology is discussed and empirical evidence is reported in the third section. The fourth section presents our conclusions.
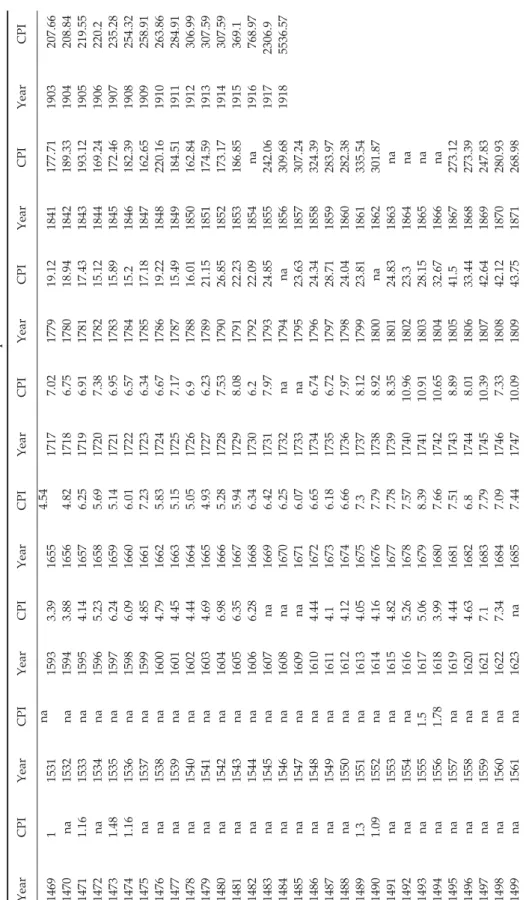
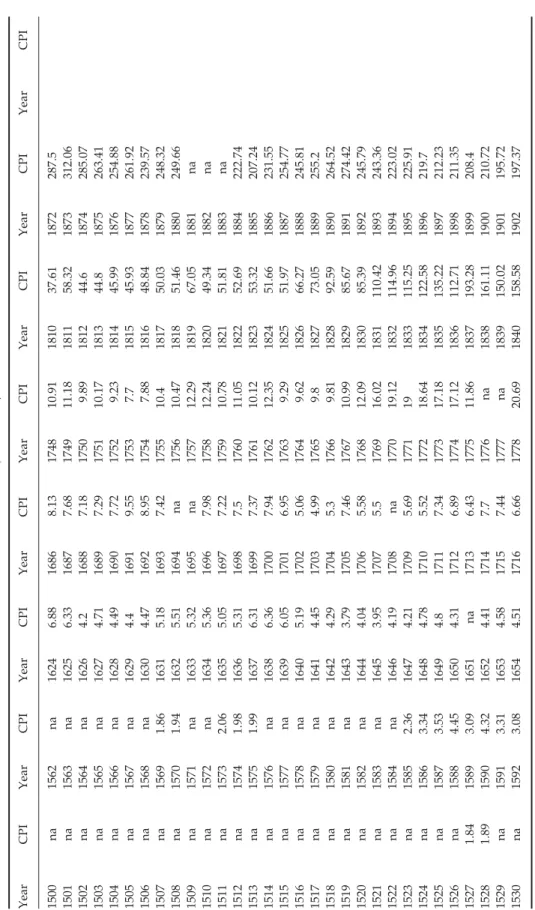
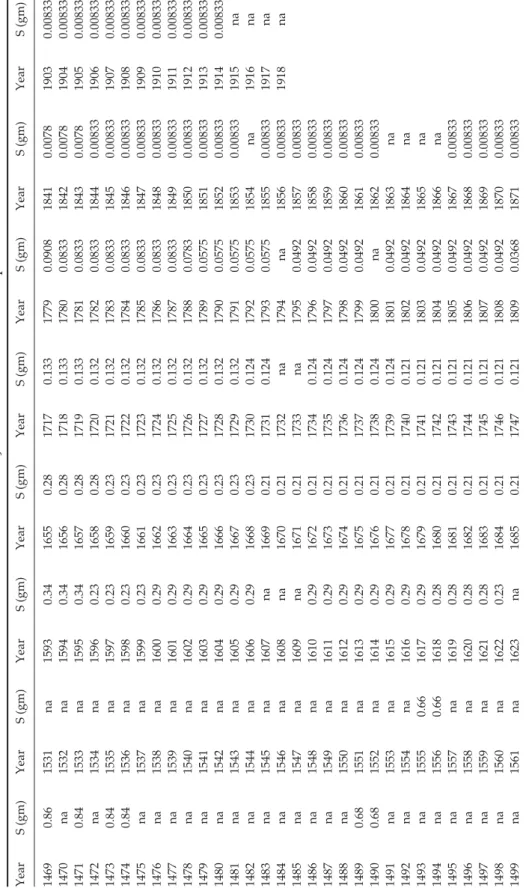
2. The Consumer Price Index for Istanbul 1469–1918
The data for the Consumer Price Index for Istanbul are the first of its type for the Middle East; in fact, for anywhere in the non-European world. It is considered to be the most detailed and reliable for these four and a half centuries (1469–1918). It was prepared by [Scedil] evket Pamuk and published by the Turkish State Institute of
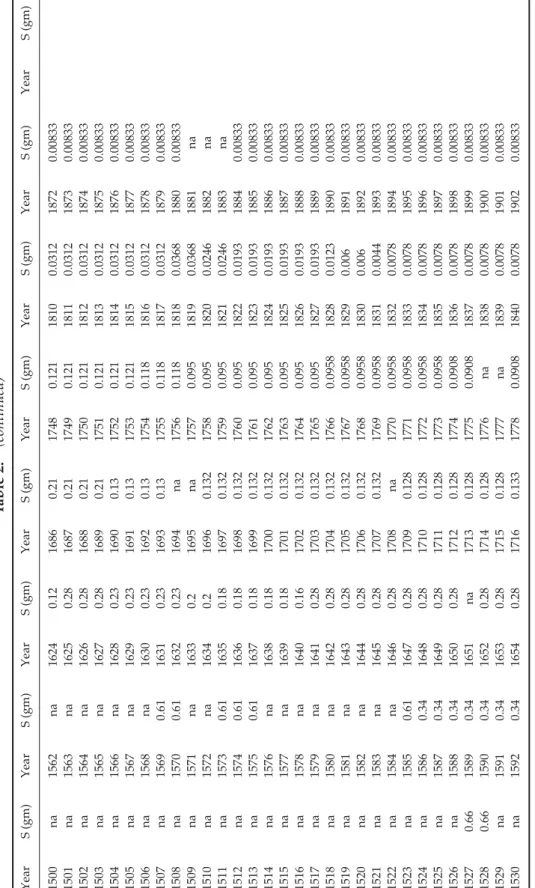
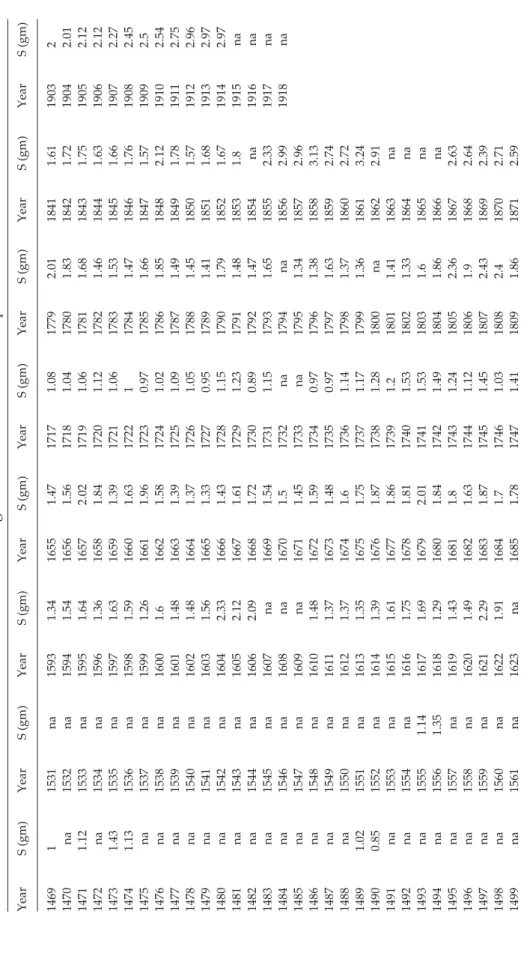
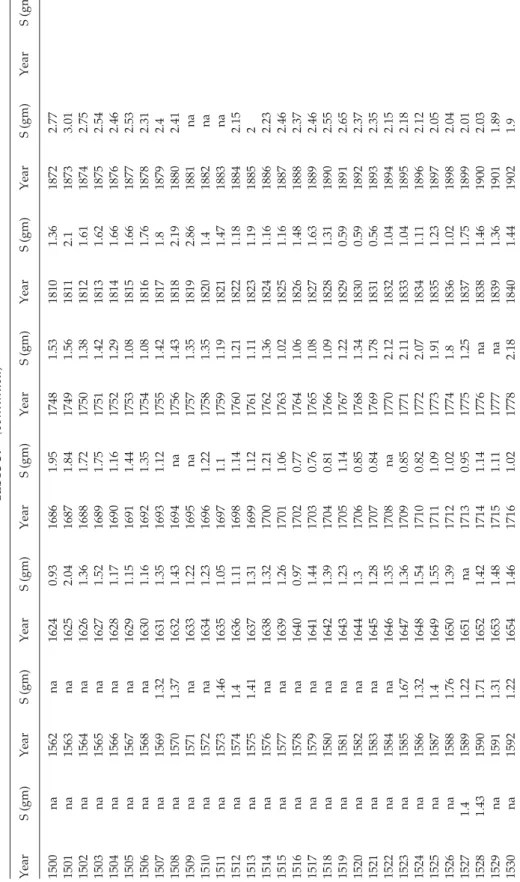
Statistics (SIS) in 2000. The data are available in Tables 1–3. Table 1 shows the Consumer Price Index, which combines the food prices obtained from the account books of pious foundations (vakif) with the prices of non-food items. Table 2 presents the annual silver content of the Akçe. Pamuk constructed price indices (expressed in grams of silver) which were obtained by multiplying the value of the price index by the silver content of the Ottoman currency for the same year. These indices are shown in Table 3.
The prices for Istanbul were calculated utilizing a large number of Ottoman archival documents. They were basically extracted from data on the prices of standard commodities: food and non-food items. Three separate price indices were constructed for food items according to the type of institution involved in consumption, whereas only one price index was constructed for the non-food items. One of the food price indices is based on the account books and prices paid by the many religious foundations, both large and small, and their soup kitchens (imaret). The second food price index is based on the account books of the Topkapi Palace kitchen. The third utilizes the officially established price ceilings (narh) for the basic items of consumption in the capital city: Istanbul.
Standard commodities were used for these price indices in order to mini-mize the effects of quality changes. Each of these food indices includes the prices of 10–12 main consumption items. These are as follows: flour, rice,
S ¸
T
able 1.
CPI values for the 1469–1918 period
Year CPI Year CPI Year CPI Year CPI Year CPI Year CPI Year CPI Year CPI 1469 1 1531 na 1593 3.39 1655 4.54 1717 7.02 1779 19.12 1841 177.71 1903 207.66 1470 na 1532 na 1594 3.88 1656 4.82 1718 6.75 1780 18.94 1842 189.33 1904 208.84 1471 1.16 1533 na 1595 4.14 1657 6.25 1719 6.91 1781 17.43 1843 193.12 1905 219.55 1472 na 1534 na 1596 5.23 1658 5.69 1720 7.38 1782 15.12 1844 169.24 1906 220.2 1473 1.48 1535 na 1597 6.24 1659 5.14 1721 6.95 1783 15.89 1845 172.46 1907 235.28 1474 1.16 1536 na 1598 6.09 1660 6.01 1722 6.57 1784 15.2 1846 182.39 1908 254.32 1475 na 1537 na 1599 4.85 1661 7.23 1723 6.34 1785 17.18 1847 162.65 1909 258.91 1476 na 1538 na 1600 4.79 1662 5.83 1724 6.67 1786 19.22 1848 220.16 1910 263.86 1477 na 1539 na 1601 4.45 1663 5.15 1725 7.17 1787 15.49 1849 184.51 1911 284.91 1478 na 1540 na 1602 4.44 1664 5.05 1726 6.9 1788 16.01 1850 162.84 1912 306.99 1479 na 1541 na 1603 4.69 1665 4.93 1727 6.23 1789 21.15 1851 174.59 1913 307.59 1480 na 1542 na 1604 6.98 1666 5.28 1728 7.53 1790 26.85 1852 173.17 1914 307.59 1481 na 1543 na 1605 6.35 1667 5.94 1729 8.08 1791 22.23 1853 186.85 1915 369.1 1482 na 1544 na 1606 6.28 1668 6.34 1730 6.2 1792 22.09 1854 na 1916 768.97 1483 na 1545 na 1607 na 1669 6.42 1731 7.97 1793 24.85 1855 242.06 1917 2306.9 1484 na 1546 na 1608 na 1670 6.25 1732 na 1794 na 1856 309.68 1918 5536.57 1485 na 1547 na 1609 na 1671 6.07 1733 na 1795 23.63 1857 307.24 1486 na 1548 na 1610 4.44 1672 6.65 1734 6.74 1796 24.34 1858 324.39 1487 na 1549 na 1611 4.1 1673 6.18 1735 6.72 1797 28.71 1859 283.97 1488 na 1550 na 1612 4.12 1674 6.66 1736 7.97 1798 24.04 1860 282.38 1489 1.3 1551 na 1613 4.05 1675 7.3 1737 8.12 1799 23.81 1861 335.54 1490 1.09 1552 na 1614 4.16 1676 7.79 1738 8.92 1800 na 1862 301.87 1491 na 1553 na 1615 4.82 1677 7.78 1739 8.35 1801 24.83 1863 na 1492 na 1554 na 1616 5.26 1678 7.57 1740 10.96 1802 23.3 1864 na 1493 na 1555 1.5 1617 5.06 1679 8.39 1741 10.91 1803 28.15 1865 na 1494 na 1556 1.78 1618 3.99 1680 7.66 1742 10.65 1804 32.67 1866 na 1495 na 1557 na 1619 4.44 1681 7.51 1743 8.89 1805 41.5 1867 273.12 1496 na 1558 na 1620 4.63 1682 6.8 1744 8.01 1806 33.44 1868 273.39 1497 na 1559 na 1621 7.1 1683 7.79 1745 10.39 1807 42.64 1869 247.83 1498 na 1560 na 1622 7.34 1684 7.09 1746 7.33 1808 42.12 1870 280.93 1499 na 1561 na 1623 na 1685 7.44 1747 10.09 1809 43.75 1871 268.98
T able 1. (continued) Year CPI Year CPI Year CPI Year CPI Year CPI Year CPI Year CPI Year CPI 1500 na 1562 na 1624 6.88 1686 8.13 1748 10.91 1810 37.61 1872 287.5 1501 na 1563 na 1625 6.33 1687 7.68 1749 11.18 1811 58.32 1873 312.06 1502 na 1564 na 1626 4.2 1688 7.18 1750 9.89 1812 44.6 1874 285.07 1503 na 1565 na 1627 4.71 1689 7.29 1751 10.17 1813 44.8 1875 263.41 1504 na 1566 na 1628 4.49 1690 7.72 1752 9.23 1814 45.99 1876 254.88 1505 na 1567 na 1629 4.4 1691 9.55 1753 7.7 1815 45.93 1877 261.92 1506 na 1568 na 1630 4.47 1692 8.95 1754 7.88 1816 48.84 1878 239.57 1507 na 1569 1.86 1631 5.18 1693 7.42 1755 10.4 1817 50.03 1879 248.32 1508 na 1570 1.94 1632 5.51 1694 na 1756 10.47 1818 51.46 1880 249.66 1509 na 1571 na 1633 5.32 1695 na 1757 12.29 1819 67.05 1881 na 1510 na 1572 na 1634 5.36 1696 7.98 1758 12.24 1820 49.34 1882 na 1511 na 1573 2.06 1635 5.05 1697 7.22 1759 10.78 1821 51.81 1883 na 1512 na 1574 1.98 1636 5.31 1698 7.5 1760 11.05 1822 52.69 1884 222.74 1513 na 1575 1.99 1637 6.31 1699 7.37 1761 10.12 1823 53.32 1885 207.24 1514 na 1576 na 1638 6.36 1700 7.94 1762 12.35 1824 51.66 1886 231.55 1515 na 1577 na 1639 6.05 1701 6.95 1763 9.29 1825 51.97 1887 254.77 1516 na 1578 na 1640 5.19 1702 5.06 1764 9.62 1826 66.27 1888 245.81 1517 na 1579 na 1641 4.45 1703 4.99 1765 9.8 1827 73.05 1889 255.2 1518 na 1580 na 1642 4.29 1704 5.3 1766 9.81 1828 92.59 1890 264.52 1519 na 1581 na 1643 3.79 1705 7.46 1767 10.99 1829 85.67 1891 274.42 1520 na 1582 na 1644 4.04 1706 5.58 1768 12.09 1830 85.39 1892 245.79 1521 na 1583 na 1645 3.95 1707 5.5 1769 16.02 1831 110.42 1893 243.36 1522 na 1584 na 1646 4.19 1708 na 1770 19.12 1832 114.96 1894 223.02 1523 na 1585 2.36 1647 4.21 1709 5.69 1771 19 1833 115.25 1895 225.91 1524 na 1586 3.34 1648 4.78 1710 5.52 1772 18.64 1834 122.58 1896 219.7 1525 na 1587 3.53 1649 4.8 1711 7.34 1773 17.18 1835 135.22 1897 212.23 1526 na 1588 4.45 1650 4.31 1712 6.89 1774 17.12 1836 112.71 1898 211.35 1527 1.84 1589 3.09 1651 na 1713 6.43 1775 11.86 1837 193.28 1899 208.4 1528 1.89 1590 4.32 1652 4.41 1714 7.7 1776 na 1838 161.11 1900 210.72 1529 na 1591 3.31 1653 4.58 1715 7.44 1777 na 1839 150.02 1901 195.72 1530 na 1592 3.08 1654 4.51 1716 6.66 1778 20.69 1840 158.58 1902 197.37
T
able 2.
Silver content in
Akçe
values for the 1469–1918 period
Year S (gm) Year S (gm) Year S (gm) Year S (gm) Year S (gm) Year S (gm) Year S (gm) Year S (gm) 1469 0.86 1531 na 1593 0.34 1655 0.28 1717 0.133 1779 0.0908 1841 0.0078 1903 0.00833 1470 na 1532 na 1594 0.34 1656 0.28 1718 0.133 1780 0.0833 1842 0.0078 1904 0.00833 1471 0.84 1533 na 1595 0.34 1657 0.28 1719 0.133 1781 0.0833 1843 0.0078 1905 0.00833 1472 na 1534 na 1596 0.23 1658 0.28 1720 0.132 1782 0.0833 1844 0.00833 1906 0.00833 1473 0.84 1535 na 1597 0.23 1659 0.23 1721 0.132 1783 0.0833 1845 0.00833 1907 0.00833 1474 0.84 1536 na 1598 0.23 1660 0.23 1722 0.132 1784 0.0833 1846 0.00833 1908 0.00833 1475 na 1537 na 1599 0.23 1661 0.23 1723 0.132 1785 0.0833 1847 0.00833 1909 0.00833 1476 na 1538 na 1600 0.29 1662 0.23 1724 0.132 1786 0.0833 1848 0.00833 1910 0.00833 1477 na 1539 na 1601 0.29 1663 0.23 1725 0.132 1787 0.0833 1849 0.00833 1911 0.00833 1478 na 1540 na 1602 0.29 1664 0.23 1726 0.132 1788 0.0783 1850 0.00833 1912 0.00833 1479 na 1541 na 1603 0.29 1665 0.23 1727 0.132 1789 0.0575 1851 0.00833 1913 0.00833 1480 na 1542 na 1604 0.29 1666 0.23 1728 0.132 1790 0.0575 1852 0.00833 1914 0.00833 1481 na 1543 na 1605 0.29 1667 0.23 1729 0.132 1791 0.0575 1853 0.00833 1915 na 1482 na 1544 na 1606 0.29 1668 0.23 1730 0.124 1792 0.0575 1854 na 1916 na 1483 na 1545 na 1607 na 1669 0.21 1731 0.124 1793 0.0575 1855 0.00833 1917 na 1484 na 1546 na 1608 na 1670 0.21 1732 na 1794 na 1856 0.00833 1918 na 1485 na 1547 na 1609 na 1671 0.21 1733 na 1795 0.0492 1857 0.00833 1486 na 1548 na 1610 0.29 1672 0.21 1734 0.124 1796 0.0492 1858 0.00833 1487 na 1549 na 1611 0.29 1673 0.21 1735 0.124 1797 0.0492 1859 0.00833 1488 na 1550 na 1612 0.29 1674 0.21 1736 0.124 1798 0.0492 1860 0.00833 1489 0.68 1551 na 1613 0.29 1675 0.21 1737 0.124 1799 0.0492 1861 0.00833 1490 0.68 1552 na 1614 0.29 1676 0.21 1738 0.124 1800 na 1862 0.00833 1491 na 1553 na 1615 0.29 1677 0.21 1739 0.124 1801 0.0492 1863 na 1492 na 1554 na 1616 0.29 1678 0.21 1740 0.121 1802 0.0492 1864 na 1493 na 1555 0.66 1617 0.29 1679 0.21 1741 0.121 1803 0.0492 1865 na 1494 na 1556 0.66 1618 0.28 1680 0.21 1742 0.121 1804 0.0492 1866 na 1495 na 1557 na 1619 0.28 1681 0.21 1743 0.121 1805 0.0492 1867 0.00833 1496 na 1558 na 1620 0.28 1682 0.21 1744 0.121 1806 0.0492 1868 0.00833 1497 na 1559 na 1621 0.28 1683 0.21 1745 0.121 1807 0.0492 1869 0.00833 1498 na 1560 na 1622 0.23 1684 0.21 1746 0.121 1808 0.0492 1870 0.00833 1499 na 1561 na 1623 na 1685 0.21 1747 0.121 1809 0.0368 1871 0.00833
T able 2. (continued) Year S (gm) Year S (gm) Year S (gm) Year S (gm) Year S (gm) Year S (gm) Year S (gm) Year S (gm) 1500 na 1562 na 1624 0.12 1686 0.21 1748 0.121 1810 0.0312 1872 0.00833 1501 na 1563 na 1625 0.28 1687 0.21 1749 0.121 1811 0.0312 1873 0.00833 1502 na 1564 na 1626 0.28 1688 0.21 1750 0.121 1812 0.0312 1874 0.00833 1503 na 1565 na 1627 0.28 1689 0.21 1751 0.121 1813 0.0312 1875 0.00833 1504 na 1566 na 1628 0.23 1690 0.13 1752 0.121 1814 0.0312 1876 0.00833 1505 na 1567 na 1629 0.23 1691 0.13 1753 0.121 1815 0.0312 1877 0.00833 1506 na 1568 na 1630 0.23 1692 0.13 1754 0.118 1816 0.0312 1878 0.00833 1507 na 1569 0.61 1631 0.23 1693 0.13 1755 0.118 1817 0.0312 1879 0.00833 1508 na 1570 0.61 1632 0.23 1694 na 1756 0.118 1818 0.0368 1880 0.00833 1509 na 1571 na 1633 0.2 1695 na 1757 0.095 1819 0.0368 1881 na 1510 na 1572 na 1634 0.2 1696 0.132 1758 0.095 1820 0.0246 1882 na 1511 na 1573 0.61 1635 0.18 1697 0.132 1759 0.095 1821 0.0246 1883 na 1512 na 1574 0.61 1636 0.18 1698 0.132 1760 0.095 1822 0.0193 1884 0.00833 1513 na 1575 0.61 1637 0.18 1699 0.132 1761 0.095 1823 0.0193 1885 0.00833 1514 na 1576 na 1638 0.18 1700 0.132 1762 0.095 1824 0.0193 1886 0.00833 1515 na 1577 na 1639 0.18 1701 0.132 1763 0.095 1825 0.0193 1887 0.00833 1516 na 1578 na 1640 0.16 1702 0.132 1764 0.095 1826 0.0193 1888 0.00833 1517 na 1579 na 1641 0.28 1703 0.132 1765 0.095 1827 0.0193 1889 0.00833 1518 na 1580 na 1642 0.28 1704 0.132 1766 0.0958 1828 0.0123 1890 0.00833 1519 na 1581 na 1643 0.28 1705 0.132 1767 0.0958 1829 0.006 1891 0.00833 1520 na 1582 na 1644 0.28 1706 0.132 1768 0.0958 1830 0.006 1892 0.00833 1521 na 1583 na 1645 0.28 1707 0.132 1769 0.0958 1831 0.0044 1893 0.00833 1522 na 1584 na 1646 0.28 1708 na 1770 0.0958 1832 0.0078 1894 0.00833 1523 na 1585 0.61 1647 0.28 1709 0.128 1771 0.0958 1833 0.0078 1895 0.00833 1524 na 1586 0.34 1648 0.28 1710 0.128 1772 0.0958 1834 0.0078 1896 0.00833 1525 na 1587 0.34 1649 0.28 1711 0.128 1773 0.0958 1835 0.0078 1897 0.00833 1526 na 1588 0.34 1650 0.28 1712 0.128 1774 0.0908 1836 0.0078 1898 0.00833 1527 0.66 1589 0.34 1651 na 1713 0.128 1775 0.0908 1837 0.0078 1899 0.00833 1528 0.66 1590 0.34 1652 0.28 1714 0.128 1776 na 1838 0.0078 1900 0.00833 1529 na 1591 0.34 1653 0.28 1715 0.128 1777 na 1839 0.0078 1901 0.00833 1530 na 1592 0.34 1654 0.28 1716 0.133 1778 0.0908 1840 0.0078 1902 0.00833
T
able 3.
CPI silver gram values for the 1469–1918 period
Year S (gm) Year S (gm) Year S (gm) Year S (gm) Year S (gm) Year S (gm) Year S (gm) Year S (gm) 1469 1 1531 na 1593 1.34 1655 1.47 1717 1.08 1779 2.01 1841 1.61 1903 2 1470 na 1532 na 1594 1.54 1656 1.56 1718 1.04 1780 1.83 1842 1.72 1904 2.01 1471 1.12 1533 na 1595 1.64 1657 2.02 1719 1.06 1781 1.68 1843 1.75 1905 2.12 1472 na 1534 na 1596 1.36 1658 1.84 1720 1.12 1782 1.46 1844 1.63 1906 2.12 1473 1.43 1535 na 1597 1.63 1659 1.39 1721 1.06 1783 1.53 1845 1.66 1907 2.27 1474 1.13 1536 na 1598 1.59 1660 1.63 1722 1 1784 1.47 1846 1.76 1908 2.45 1475 na 1537 na 1599 1.26 1661 1.96 1723 0.97 1785 1.66 1847 1.57 1909 2.5 1476 na 1538 na 1600 1.6 1662 1.58 1724 1.02 1786 1.85 1848 2.12 1910 2.54 1477 na 1539 na 1601 1.48 1663 1.39 1725 1.09 1787 1.49 1849 1.78 1911 2.75 1478 na 1540 na 1602 1.48 1664 1.37 1726 1.05 1788 1.45 1850 1.57 1912 2.96 1479 na 1541 na 1603 1.56 1665 1.33 1727 0.95 1789 1.41 1851 1.68 1913 2.97 1480 na 1542 na 1604 2.33 1666 1.43 1728 1.15 1790 1.79 1852 1.67 1914 2.97 1481 na 1543 na 1605 2.12 1667 1.61 1729 1.23 1791 1.48 1853 1.8 1915 na 1482 na 1544 na 1606 2.09 1668 1.72 1730 0.89 1792 1.47 1854 na 1916 na 1483 na 1545 na 1607 na 1669 1.54 1731 1.15 1793 1.65 1855 2.33 1917 na 1484 na 1546 na 1608 na 1670 1.5 1732 na 1794 na 1856 2.99 1918 na 1485 na 1547 na 1609 na 1671 1.45 1733 na 1795 1.34 1857 2.96 1486 na 1548 na 1610 1.48 1672 1.59 1734 0.97 1796 1.38 1858 3.13 1487 na 1549 na 1611 1.37 1673 1.48 1735 0.97 1797 1.63 1859 2.74 1488 na 1550 na 1612 1.37 1674 1.6 1736 1.14 1798 1.37 1860 2.72 1489 1.02 1551 na 1613 1.35 1675 1.75 1737 1.17 1799 1.36 1861 3.24 1490 0.85 1552 na 1614 1.39 1676 1.87 1738 1.28 1800 na 1862 2.91 1491 na 1553 na 1615 1.61 1677 1.86 1739 1.2 1801 1.41 1863 na 1492 na 1554 na 1616 1.75 1678 1.81 1740 1.53 1802 1.33 1864 na 1493 na 1555 1.14 1617 1.69 1679 2.01 1741 1.53 1803 1.6 1865 na 1494 na 1556 1.35 1618 1.29 1680 1.84 1742 1.49 1804 1.86 1866 na 1495 na 1557 na 1619 1.43 1681 1.8 1743 1.24 1805 2.36 1867 2.63 1496 na 1558 na 1620 1.49 1682 1.63 1744 1.12 1806 1.9 1868 2.64 1497 na 1559 na 1621 2.29 1683 1.87 1745 1.45 1807 2.43 1869 2.39 1498 na 1560 na 1622 1.91 1684 1.7 1746 1.03 1808 2.4 1870 2.71 1499 na 1561 na 1623 na 1685 1.78 1747 1.41 1809 1.86 1871 2.59
T able 3. (continued) Year S (gm) Year S (gm) Year S (gm) Year S (gm) Year S (gm) Year S (gm) Year S (gm) Year S (gm) 1500 na 1562 na 1624 0.93 1686 1.95 1748 1.53 1810 1.36 1872 2.77 1501 na 1563 na 1625 2.04 1687 1.84 1749 1.56 1811 2.1 1873 3.01 1502 na 1564 na 1626 1.36 1688 1.72 1750 1.38 1812 1.61 1874 2.75 1503 na 1565 na 1627 1.52 1689 1.75 1751 1.42 1813 1.62 1875 2.54 1504 na 1566 na 1628 1.17 1690 1.16 1752 1.29 1814 1.66 1876 2.46 1505 na 1567 na 1629 1.15 1691 1.44 1753 1.08 1815 1.66 1877 2.53 1506 na 1568 na 1630 1.16 1692 1.35 1754 1.08 1816 1.76 1878 2.31 1507 na 1569 1.32 1631 1.35 1693 1.12 1755 1.42 1817 1.8 1879 2.4 1508 na 1570 1.37 1632 1.43 1694 na 1756 1.43 1818 2.19 1880 2.41 1509 na 1571 na 1633 1.22 1695 na 1757 1.35 1819 2.86 1881 na 1510 na 1572 na 1634 1.23 1696 1.22 1758 1.35 1820 1.4 1882 na 1511 na 1573 1.46 1635 1.05 1697 1.1 1759 1.19 1821 1.47 1883 na 1512 na 1574 1.4 1636 1.11 1698 1.14 1760 1.21 1822 1.18 1884 2.15 1513 na 1575 1.41 1637 1.31 1699 1.12 1761 1.11 1823 1.19 1885 2 1514 na 1576 na 1638 1.32 1700 1.21 1762 1.36 1824 1.16 1886 2.23 1515 na 1577 na 1639 1.26 1701 1.06 1763 1.02 1825 1.16 1887 2.46 1516 na 1578 na 1640 0.97 1702 0.77 1764 1.06 1826 1.48 1888 2.37 1517 na 1579 na 1641 1.44 1703 0.76 1765 1.08 1827 1.63 1889 2.46 1518 na 1580 na 1642 1.39 1704 0.81 1766 1.09 1828 1.31 1890 2.55 1519 na 1581 na 1643 1.23 1705 1.14 1767 1.22 1829 0.59 1891 2.65 1520 na 1582 na 1644 1.3 1706 0.85 1768 1.34 1830 0.59 1892 2.37 1521 na 1583 na 1645 1.28 1707 0.84 1769 1.78 1831 0.56 1893 2.35 1522 na 1584 na 1646 1.35 1708 na 1770 2.12 1832 1.04 1894 2.15 1523 na 1585 1.67 1647 1.36 1709 0.85 1771 2.11 1833 1.04 1895 2.18 1524 na 1586 1.32 1648 1.54 1710 0.82 1772 2.07 1834 1.11 1896 2.12 1525 na 1587 1.4 1649 1.55 1711 1.09 1773 1.91 1835 1.23 1897 2.05 1526 na 1588 1.76 1650 1.39 1712 1.02 1774 1.8 1836 1.02 1898 2.04 1527 1.4 1589 1.22 1651 na 1713 0.95 1775 1.25 1837 1.75 1899 2.01 1528 1.43 1590 1.71 1652 1.42 1714 1.14 1776 na 1838 1.46 1900 2.03 1529 na 1591 1.31 1653 1.48 1715 1.11 1777 na 1839 1.36 1901 1.89 1530 na 1592 1.22 1654 1.46 1716 1.02 1778 2.18 1840 1.44 1902 1.9
honey, cooking oil, mutton, chick peas, lentils, onions, eggs, sugar (for the palace only), coffee (as of the 17th century for the palace and the 18th century for the religious foundations), and olive oil for burning. Among these, flour, rice, cooking oil, mutton, olive oil and honey provided the most reliable long term series and represented the greatest proportion of the food budget. The prices of non-food items were obtained from a variety of sources, most impor-tantly the palace account books. The commodities considered are soap, wood, coal and nails.
The weight of food items in the overall indices was fixed between 75% and 80%, based on the available evidence regarding the budget of an average urban consumer. The weight of each commodity in the overall index was based on the shares of each in the total expenditures of the respective institutions. Greater weight was given to the indices based on the prices paid by the soup kitchens and, more specifically, the pious foundations because the palace and the narh prices might be considered as official or state controlled prices. The weights of the individual commodities were kept constant as long as they were included in the index.
3. Empirical Evidence
Time series analysis developed various tools to capture the dynamics of a series. The autoregressive (AR) method estimation for univariate series is one of the most commonly used tools to capture the dynamics of the series. In this paper, we assess whether the dynamic path of inflation, which is captured by an auroregressive process, is interrupted by a set of exogenous variables. If so, the transfer function analysis can be used and the following model can be estimated in order to capture the effects of political and structural changes on the dynamics of inflation (Enders, 2000, p. 239):
where πt is the inflation rate, p is the lag order, Zt is a vector which contains the
political and structural variables that may affect the behavior of πt, and εt is the
error term at time t. Basically, we intend to assess whether Zt affects the dynamic
path of inflation, which is captured with the lag values of the inflation itself. Here, γ is the coefficient of capturing the effects of political and structural situa-tions on inflation dynamics. If we find that the estimated coefficient of Zt(γ) is
statistically significant; that is, if we can reject the null hypothesis that γ = 0, then we claim that the particular political and structural variable that will affect the dynamics of πt.
In order to conduct this study, a benchmark model is needed. An autoregres-sive model is estimated for the inflation process. First, inflation is calculated as the change in the logarithm of two consecutive price indices. Then, inflation was regressed on its own lags with a constant term. In order to determine the mum lag order, the final error criteria is used. This method determines the opti-mum lag order such that the residual term is no longer autocorrelated. The first four lags were used to account for the dynamics of inflation, indicating the AR(4) process. Hence, inflation was regressed on its four lags with the constant term
πt β β πi t γ t εt i p Z = + − + + =
∑
0 1 1price indices calculated by [Scedil] evket Pamuk covers the period between 1469 and
1918, but we started the sample from 1586 because of the frequency of missing observations and adopted the AR(4) process for inflation. We ended the data in 1913 to avoid the hyperinflation of the First World War years. In addition to lag values, inflation was also regressed on some political and structural variables, the coefficients of which account for the changes in the dynamics of inflation, not in inflation itself.
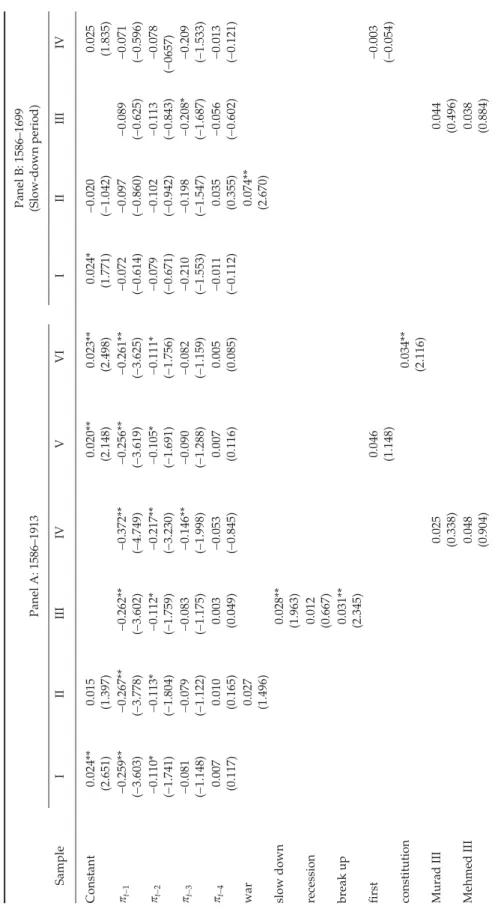
Being involved in a war requires extra expenses. Therefore, we tested whether the policies adopted during the war years in order to struggle with military expen-ditures caused inflation. In order to capture the war years, a dummy variable was designed. Figure 2 plots the inflation and the war periods as shaded areas. Visual inspection of the figure suggests that short lived wars, in particular, were associ-ated with higher inflation. For long lasting wars, the inflation was not persistent despite the beginning of the war periods being inflationary. The war variable was added to the benchmark model (taking the value of one if there was war in this year and zero otherwise). The empirical evidence suggests that the war years accel-erated inflation. However, the coefficient of the war variable is not statistically significant.2 This results are presented in Table 4 in Column II of Panel A.
Figure 2.Inflation and war periods.
Notes: The shaded areas show the following wars: 1578–1590, Ottoman–Iran War; 1593, Ottoman–Habsburg War; 1603–1639, Ottoman–Iran War; 1645–1669, Crete War; 1672– 1681, Ottoman–Poland–Russia War; 1683, Ottoman–Austria War; 1687, Ottoman–Austria War; 1690–1691, Ottoman–Austria War; 1696–1697, Ottoman–Austria War; 1711, Prut War; 1714–1718, Ottoman–Austria War; 1723–1727, Ottoman–Iran War; 1730–1732,
Ottoman–Iran War; 1733–1739, Ottoman–Austria–Russia War; 1743–1746, Ottoman–Iran War; 1768–1774, Ottoman–Russia War; 1787, Ottoman–Russia War; 1832, Egypt War; 1853–1856, Crimea War; 1896–1897, Ottoman–Greek War; 1911–1912, Trablusgarp War.
The military strength of the Ottoman Empire caused heterogeneity of tax reve-nue in the different regions of the Ottoman Empire to cover government spending requirements. The loss of some portion of land might dictate the government’s fiscal and monetary setting. These two factors might determine the inflation level. We consider inflation in three different historical eras: the slow down (1586–1699), the recession (1700–1792) and the break up (1793–1913). Figure 3 plots the inflation with the segmentation of the three eras taken into consideration. However, the visual inspection of the figure does not suggest any clear evidence that the infla-tion was higher for any of the three periods when compared to the others. Thus, three dummy variables for the three different historical eras of the Ottoman Empire were introduced. Inflation was regressed against its four lags and the three dummy variables. However, the constant term was not included in the regression. The estimates of parameters are presented in Table 4 in column III of panel A. The empirical evidence reveals that the slow-down, the recession and the break-up periods affected inflation positively. However, the increasing trend of inflation was highest in the break-up period, which was the worst period of the empire and lowest in the recession period. Even though the coefficient of the break-up period was statistically significant, the coefficient was not significant for the recession period. In order to test whether each period had different inflationary policy, the
F-test can be performed. The F-statistics value is 0.15, so we cannot reject the hypothesis that inflationary policy was the same in each period.
Figure 3.Inflation and three identified periods.
Notes: The following periods are represented: 1586–1699, slow-down period; 1700–1792, recession period; 1793–1913, break-up period.
A change of sultans can be taken as another explanatory variable for inflation dynamics since each sultan had different economic policies for managing the economy. Therefore, we tested whether the different policies of each sultan caused acceleration in inflation differently. Figure 4 shows the inflation during the reign of each sultan. Visual inspection does not suggest that inflation differs with different sultans. Each sultan’s period dummy variable was designed specif-ically to capture the effect of his reign on inflation. All of these dummy variables were added to the benchmark model. The empirical results are presented in Table 4 in column IV of panel A. The estimates suggest that the periods of Sultans
Ahmed I, Murad IV, Osman III, Mustafa IV, Mahmud II and Mehmed Resad V showed
S ¸
T
able 4.
Inflation r
esults based on the CPI
Panel A: 1586–1913
Panel B: 1586–1699 (Slow-down period)
Sample I II III IV V V I I II III IV Constant 0.024** (2.651) 0.015 (1.397) 0.020** (2.148) 0.023** (2.498) 0.024* (1.771) − 0.020 (− 1.042) 0.025 (1.835) πt−1 − 0.259** (− 3.603) − 0.267** (− 3.778) − 0.262** (− 3.602) − 0.372** (− 4.749) − 0.256** (− 3.619) − 0.261** (− 3.625) − 0.072 (− 0.614) − 0.097 (− 0.860) − 0.089 (− 0.625) − 0.071 (− 0.596) πt−2 − 0.110* (− 1.741) − 0.113* (− 1.804) − 0.112* (− 1.759) − 0.217** (− 3.230) − 0.105* (− 1.691) − 0.111* (− 1.756) − 0.079 (− 0.671) − 0.102 (− 0.942) − 0.113 (− 0.843) − 0.078 (− 0657) πt−3 − 0.081 (− 1.148) − 0.079 (− 1.122) − 0.083 (− 1.175) − 0.146** (− 1.998) − 0.090 (− 1.288) − 0.082 (− 1.159) − 0.210 (− 1.553) − 0.198 (− 1.547) − 0.208* (− 1.687) − 0.209 (− 1.533) πt−4 0.007 (0.117) 0.010 (0.165) 0.003 (0.049) − 0.053 (− 0.845) 0.007 (0.116) 0.005 (0.085) − 0.011 (− 0.112) 0.035 (0.355) − 0.056 (− 0.602) − 0.013 (− 0.121) war 0.027 (1.496) 0.074** (2.670) slow down 0.028** (1.963) recession 0.012 (0.667) break up 0.031** (2.345) first 0.046 (1.148) − 0.003 (− 0.054) constitution 0.034** (2.116) Murad III 0.025 (0.338) 0.044 (0.496) Mehmed III 0.048 (0.904) 0.038 (0.884)
T
able 4.
(Continued)
Panel C: 1700–1792 (Recession period) Panel D: 1793–1913 (Break-up period)
II I III IV I II III IV V 0.013 (0.686) 0.016 (0.721) 0.001 (0.032) 0.027** (2.140) 0.024* (1.769) 0.027* (1.949) 0.025* (1.832) − 0.240* (− 1.815) − 0.236* (− 1.799) − 0.395** (− 3.159) − 0.217* (− 1.662) − 0.497** (− 4.173) − 0.501** (− 4.239) − 0.614** (− 4.704) − 0.493** (− 4.024) − 0.502** (− 4.214) − 0.142 (− 1.251) − 0.140 (− 1.237) − 0.247** (− 2.412) − 0.068 (− 0.597) − 0.126 (− 1.168) − 0.119 (− 1.111) − 0.298** (− 2.449) − 0.125 (− 1.170) − 0.129 (− 1.193) − 0.102 (− 0.744) − 0.093 (− 0.666) − 0.141 (− 0.968) − 0.122 (− 0.897) 0.091 (1.209) 0.106 (1.419) − 0.039 (− 0.448) 0.088 (1.147) 0.091 (1.199) − 0.033 (− 0.270) − 0.023 (− 0.175) − 0.074 (− 0.582) − 0.063 (− 0.525) 0.137* (1.678) 0.144* (1.772) 0.049 (0.522) 0.134 (1.623) 0.135 (1.642) − 0.010 (0.258) 0.040 (1.339) 0.140** (2.634) 0.010 (0.287) 0.035* (1.809)
T
able 4.
(Continued)
Panel A: 1586–1913
Panel B: 1586–1699 (Slow-down period)
Sample I II III IV V V I I II III IV Ahmed I 0.139** (2.556) 0.100 (1.549) Mustafa I − 0.043 (− 0.232) − 0.111 (− 0.716) Osman II 0.081 (0.700) 0.108 (0.716) Murad IV 0.041* (1.771) 0.029 (1.203) Ibrahim − 0.059 (− 1.532) − 0.044 (− 1.264) Mehmed IV 0.026 (1.509) 0.019 (1.806) Süleyman II − 0.009 (− 0.363) 0.003 (1.132) Ahmed II 0.031 (0.343) 0.002 (0.023) Mustafa II − 0.204** (− 3.267) 0.000 (0.000) Ahmed III 0.006 (0.239) Mahmud I 0.009 (0.234) Osman III 0.178** (4.376) Mustafa III 0.053 (1.438)
T
able 4.
(Continued)
Panel C: 1700–1792 (Recession period) Panel D: 1793–1913 (Break-up period)
II I III IV I II III IV V − 0.208** (− 3.296) 0.006 (0.260) 0.009 (0.229) 0.180** (4.177) 0.056 (1.428)
T
able 4.
(Continued)
Panel A: 1586–1913
Panel B: 1586–1699 (Slow-down period)
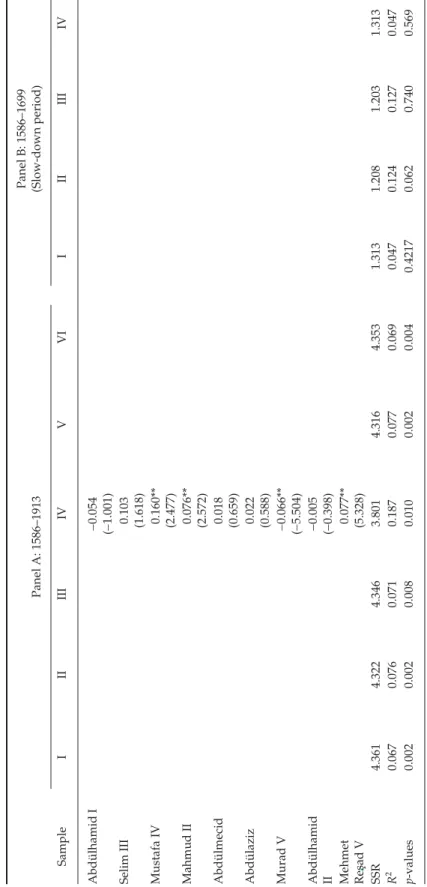
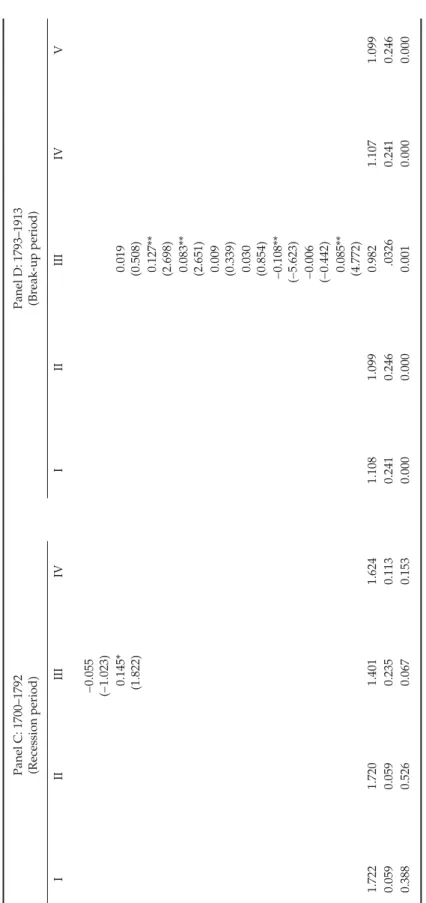
Sample I II III IV V V I I II III IV Abdülhamid I − 0.054 (− 1.001) Selim III 0.103 (1.618) Mustafa IV 0.160** (2.477) Mahmud II 0.076** (2.572) Abdülmecid 0.018 (0.659) Abdülaziz 0.022 (0.588) Murad V − 0.066** (− 5.504) Abdülhamid II − 0.005 (− 0.398) Mehmet Re [scedil] ad V 0.077** (5.328) SSR 4.361 4.322 4.346 3.801 4.316 4.353 1.313 1.208 1.203 1.313 R 2 0.067 0.076 0.071 0.187 0.077 0.069 0.047 0.124 0.127 0.047 p -values 0.002 0.002 0.008 0.010 0.002 0.004 0.4217 0.062 0.740 0.569 s¸
T
able 4.
(Continued)
Panel C: 1700–1792 (Recession period) Panel D: 1793–1913 (Break-up period)
II I III IV I II III IV V − 0.055 (− 1.023) 0.145* (1.822) 0.019 (0.508) 0.127** (2.698) 0.083** (2.651) 0.009 (0.339) 0.030 (0.854) −0.108** (− 5.623) −0.006 (− 0.442) 0.085** (4.772) 1.722 1.720 1.401 1.624 1.108 1.099 0.982 1.107 1.099 0.059 0.059 0.235 0.113 0.241 0.246 .0326 0.241 0.246 0.388 0.526 0.067 0.153 0.000 0.000 0.001 0.000 0.000
t-ratios are reported in parentheses.
*10% significance level; **5% significance level.
Figure 2. Inflation and war periods.
Notes: *The shaded areas show the following wars: 1578–1590, Ottoman–Iran War; 1593, Ottoman– Habsburg War; 1603–1639, Ottoman–Iran War; 1645–1669, Crete War; 1672– 1681, Ottoman–
Poland–Russia War; 1683, Ottoman–Austria War; 1687, Ottoman–Austria War; 1690–1691, Ottoman–Austria War; 1696–1697, Ottoman–Austria War; 1711, Prut War; 1714–1718, Ottoman– Austria War; 1723–1727, Ottoman–Iran War; 1730–1732, Ottoman–Iran War; 1733–1739, Ottoman–
Austria–Russia War; 1743–1746, Ottoman–Iran War; 1768–1774, Ottoman–Russia War; 1787, Ottoman–Russia War; 1832, Egypt War; 1853–1856, Crimea War; 1896–1897, Ottoman–Greek War;
1911–1912, Trablusgarp War.
Figure 3. Inflation and three identified periods.
Notes: *The following periods are represented: 1586–1699, slow-down period; 1700–1792, recession period; 1793–1913, break-up period.
statistically significant increasing movement in inflation. The highest acceleration in inflation was seen in the Sultan Osman III period. However, the periods of Sultans Mustafa II and Murad V showed statistically significant deflationary movements and the highest deflationary process was seen in the Sultan Mustafa II period. The F-test was performed in order to determine whether each sultan had different inflationary acts. The result of the F-test was 1.96, which suggests that each sultan utilized different inflationary acts at the 5% statistically significant level.
Figure 4.Inflation and sultan’s periods
Notes: Each area represents the period of a sultan’s reign: 1575–1594, Murad III; 1595–1603, Mehmed III; 1604–1617, Ahmed I; 1618, Mustafa I; 1618–1621, Osman II; 1624–1639, Murad IV; 1640–1648, Ibrahim; 1649–1687, Mehmed IV; 1688–1690, Süleyman II; 1691–1694, Ahmed II; 1695–1703, Mustafa II; 1704–1730, Ahmed III; 1731–1754, Mahmud I; 1755–1757, Osman III; 1758–1773, Mustafa III; 1774–1788, Abdülhamid I; 1789–
1806, Selim III; 1807–1808, Mustafa IV; 1809–1839, Mahmud II; 1840–1860, Abdülmecid; 1861–1875, Abdülaziz; 1876, Murad V; 1877–1908, Abdülmecid II; 1909–1918, Mehmet Re[scedil]ad V.
Each sultan may prefer to have more expenses during the first year of his reign since he wants to prevent rivals gaining popularity and power and thus stays on the throne longer. He may also prefer to apply favorable fiscal and monetary poli-cies to win the good will of soldiers, supporters and opponents. Hence, we test whether the first year policies of each sultan were possible reasons for inflation dynamics. In order to capture this, a dummy variable was designed and the regres-sion result is presented in Table 4 in column V of panel A. The empirical evidence suggests that the first year policies of sultans affected inflation positively. However, the first-year coefficient is not statistically significant.
In order to explain the effect of government policies on inflation during the period of constitutional monarchy, a dummy variable was constructed and added to the benchmark model. This is related to the effects of fractionalized governments on inflation. More fractionalized governments face higher budget deficits and greater difficulties in coordinating inflationary action in order to finance deficits.
Figure 4. Inflation and sultan’s periods
Notes: *Each area represents the period of a sultan’s reign: 1575–1594, Murad III; 1595–1603, Mehmed III; 1604–1617, Ahmed I; 1618, Mustafa I; 1618–1621, Osman II; 1624–1639, Murad IV; 1640–1648, Ibrahim; 1649–1687, Mehmed IV; 1688–1690, Süleyman II; 1691–1694, Ahmed II; 1695–1703, Mustafa II; 1704–1730, Ahmed III; 1731–1754, Mahmud I; 1755–1757, Osman III; 1758–1773, Mustafa III; 1774–1788,
Abdülhamid I; 1789–1806, Selim III; 1807–1808, Mustafa IV; 1809–1839, Mahmud II; 1840–1860, Abdülmecid; 1861–1875, Abdülaziz; 1876, Murad V; 1877–1908, Abdülmecid II; 1909–1918, Mehmet
Re[scedil]s¸ad V.
The results, shown in Table 4 in column VI of panel A, indicate that the period of constitutional monarchy had a positive significant effect on inflation.
The regression results of the slow-down, the recession and the break-up periods are presented in panel B, panel C and panel D, respectively, in Table 4. While the war years caused an increase in inflation during the slow-down and the break-up periods, deflationary movements were seen during the recession period. However, the coefficient of war variable is statistically significant only in the slow-down period. Even though the highest inflation was seen in the Sultan Osman II period and the highest deflation was observed for the Sultan Mustafa I period in the slow-down era, their coefficients are not statistically significant. Moreover, the emprical results suggest that the periods of Sultans Osman III and Selim III in the recession era and those of Sultans Mustafa IV, Mahmud II and Mehmed Resad V in the break-up era had statistically significant effects on the acceleration in inflation. However, the Sultan Mustafa II period in the recession era and the Sultan Murad V period in the break-up era showed a statistically significant deflation. The highest inflationary movement was seen in the Sultan Osman III period in the recession era and the Sultan Mustafa IV period in the break-up era. Furthermore, the Sultan
Mustafa II period in the recession era and the Sultan Murad V period in the
break-up era showed statistically significant and the highest deflation. These results are very parallel to the panel A, column IV results in Table 4. Although the coefficients of the first-year variable are positive in both the recession and the break-up peri-ods, they are statistically significant only during the recession period. The coeffi-cient of the first-year variable showed a deflationary trend during the slow-down period, which is not statistically significant. Moreover, the results suggest that there was statistically significant acceleration in inflation during the period of constitutional monarchy as a result of the policies which were applied in this period.
Inflation could be observed due to either fiscal expansion or seigniorage revenue caused by the debasement of the Akçe in the long run. Hence, it is interesting to examine the source of inflation. Even though Spanish gold and silver were seen during these periods, we control these with the inflation dynamics, which is captured by the number of autoregressive lag orders. The empirical results of the debasement of the Akçe are presented in Table 5. The Table 6 results are based on the price indices expressed in grams of silver.
This paper first models the inflation dynamics using an AR procedure to capture the dynamics of the inflation. However, the inflation dynamics might be affected by other factors besides its own lags. If this is the case, then the AR model will be sub-optimum compared to a model that includes the features of the AR specifica-tion as well as other factors—transfer funcspecifica-tion analysis. It is quite difficult to iden-tify the source of inflation, which is monetary (either an increase in silver supply or debasement) or fiscal expansion.3 We try to control the silver import with the data generating process that is captured by the AR process. Data on debasement is available. Thus, we claim that the variable that accounts for the debasement should capture the fiscal expansion. We recognize that this is a bold statement but it must be taken into consideration that this is an attempt to identify the fiscal policy rather than measure it. A government may use debasement (which causes inflation) to generate revenue as well. For example, Mankiw (1987) claims that as a government needs more resources to finance its spending, it increases its tax and seigniorage revenues simultaneously; therefore, debasement might be the source of inflation owing to fiscal expansions.
expressed in grams of silver stayed in a relatively narrow range because the changes in prices in this index depend on the change in grams of silver. Therefore, the difference between two prices gives us a change in the grams of silver, which might be used as a fiscal tool given that there was no persistent supply shock or gold imports at an accelerating rate. Thus, if the increase in price level is not due to a monetary factor, then it could be due to a fiscal factor.4 The empirical results of fiscal expansion are presented in Table 6. The negative coefficients in Table 5 represent debasement policies and the positive coefficients in Table 6 represent fiscal expansion policies.
Wars necessitate extra expenses; hence the need for extra sources to increase reve-nue. According to the empirical results that are presented in Tables 5 and 6 in column II of panel A, the war years showed anti-debasement acts, but the coefficient is not statistically significant. In addition, statistically significant fiscal expansions were seen in the war years. As a result, we can say that fiscal expansion rather than debasement was the main reason for inflation during the war years. Furthermore, the war years caused statistically significant anti-debasement movements in the recession and break-up periods. Although, debasement was seen due to the effects of war years in the slow-down period, its coefficient is not statistically significant. Even though the war variable had positive effects on the fiscal expansion in the three historical eras, the coefficient of the war variable is not statistically significant in the recession period. These results are presented in Tables 5 and 6 in column II of panel B, panel C and panel D. Therefore, we can conclude that fiscal expansion was the main reason for inflation in the war years during the three historical eras. Debase-ment was the main inflationary policy to overcome the fiscal deterioration during the slow-down, the recession and the break-up periods. However, the coefficient of the slow-down period is not statistically significant. These statistics are presented in Table 5 in column III of panel A. Although the slow-down and the break-up peri-ods showed fiscal expansion as a source of inflation, their coefficients are not statis-tically significant. A fiscal contraction was seen in the recession period, but its effect was not statistically significant. These results are represented in Table 6 in column III of panel A. The highest debasement was seen in the break-up period and the highest fiscal expansion was seen in the slow-down period.
Each sultan’s inflationary acts can also be interpreted using the estimates reported in Tables 5 and 6 in column IV of panel A. The F-statistics suggest that each sultan adopted different debasement and fiscal policies and accelerated infla-tion differently. The F-statistics are 1.92 for the equality of sultan dummies in Table 5 and 1.64 for the equality of sultan dummies in Table 6. According to the empirical results, the periods of Sultans Mustafa I, Mehmed IV, Mahmud I,
Abdulha-mid I and Mahmud II showed statistically significant adaptation of debasement
policies. Although most of the sultans’ periods represented debasement, the high-est acceleration of debasement was seen in the Sultan Süleyman II period, but its coefficient is not statistically significant. Pamuk (2000, pp. 204–217) argued that the greatest debasement was seen in the Sultan Mahmud II period of the Ottoman Empire. Hence, this result does not support our expectations. The estimates we report capture the debasement dynamic acceleration rather than the debasement itself. Hence, this could be the main reason for the differences between two studies. The periods of Sultans Ahmed I, Mustafa IV and Mehmed Resad V showed statis-tically significant fiscal expansion policies and the highest fiscal expansion was seen in the Sultan Mustafa IV period. The periods of Sultans Mustafa II and Murad
T
able 5.
Results based on the silver content in
Akçe
Panel A: 1586–1913
Panel B: 1586–1699 (Slow-down period)
Sample I II III IV V V I I II III IV Constant − 0.016** (− 2.742) − 0.022** (− 2.487) − 0.013** (− 2.158) − 0.016** (− 2.743) − 0.013 (− 1.196) − 0.007 (− 0.246) − 0.009 (− 0.835) debasement t− 1 0.022 (0.156) 0.024 (0.167) 0.019 (0.135) − 0.053 (− 0.374) 0.016 (0.109) 0.022 (0.151) − 0.101 (− 1.144) − 0.108 (− 1.114) − 0.199 (− 1.307) − 0.113 (− 1.243) debasement t− 2 0.105 (1.097) 0.101 (1.083) 0.102 (1.097) 0.043 (0.421) 0.108 (1.132) 0.104 (1.091) − 0.005 (− 0.234) − 0.007 (− 0.379) − 0.105 (− 1.078) − 0.002 (− 0.114) debasement t− 3 − 0.127 (− 0.960) − 0.126 (− 0.978) − 0.129 (− 0.975) − 0.188 (− 1.330) − 0.123 (− 0.932) − 0.127 (− 0.964) − 0.017 (− 0.974) − 0.017 (− 0.967) − 0.112 (− 1.274) − 0.013 (− 0.809) debasement t− 4 − 0.126 (− 1.510) − 0.129 (− 1.575) − 0.130 (− 1.567) − 0.185* (− 1.896) − 0.123 (− 1.499) − 0.126 (− 1.513) − 0.061 (− 1.035) − 0.059 (− 1.030) − 0.099 (− 1.276) − 0.058 (− 1.019) War 0.018 (1.544) − 0.011 (− 0.382) slow down − 0.012 (− 1.028) recession − 0.011* (− 1.821) break up − 0.024** (− 2.157) First − 0.029 (− 1.474) − 0.031 (− 1.378) constitution 0.016** (2.743) Murad III − 0.022 (− 1.017) − 0.012 (− 0.914) Mehmed III − 0.029 (− 0.614) − 0.029 (− 0.584)
T
able 5.
(Continued)
Panel C: 1700 – 1792 (Recession period)
Panel D: 1793–1913 (Break-up period)
II I III IV I II III IV V − 0.009* (− 1.957) − 0.015** (− 1.973) − 0.006 (− 1.576) − 0.025** (− 2.172) − 0.030** (− 2.423) − 0.023* (− 1.944) − 0.027** (− 2.172) 0.087 (0.663) 0.062 (0.517) − 0.285 (− 1.404) − 0.033 (− 0.439) 0.074 (0.298) 0.086 (0.356) 0.002 (0.008) 0.076 (0.306) 0.071 (0.287) − 0.051 (− 1.514) − 0.071 (− 1.624) − 0.389* (− 1.645) − 0.022 (− 1.162) 0.193 (1.165) 0.176 (1.136) 0.148 (0.972) 0.195 (1.167) 0.192 (1.160) 0.007 (0.206) − 0.009 (− 0.238) − 0.363 (− 1.488) 0.020 (0.594) − 0.219 (− 1.179) − 0.184 (− 1.185) − 0.265 (− 1.418) − 0.218 (− 1.170) − 0.221 (− 1.190) − 0.075 (− 1.577) − 0.094* (− 1.716) − 0.134 (− 1.516) − 0.067 (− 1.354) − 0.209 (− 1.453) − 0.190 (− 1.493) − 0.281 (− 1.601) − 0.208 (− 1.439) − 0.213 (− 1.468) 0.014* (1.766) 0.094** (2.053) − 0.057 (− 1.235) − 0.018 (− 0.457) 0.027** (2.172)
T
able 5.
(Continued)
Panel A: 1586–1913
Panel B: 1586–1699 (Slow-down period)
Sample I II III IV V V I I II III IV Ahmed I 0.007 (0.957) 0.004 (0.843) Mustafa I − 0.130** (− 2.477) − 0.127** (− 2.430) Osman II 0.022 (1.143) 0.019 (1.006) Murad IV − 0.023 (− 1.095) − 0.035* (− 1.847) Ibrahim 0.068 (1.025) 0.074 (0.998) Mehmed IV − 0.012* (− 1.699) − 0.013* (− 1.811) Süleyman II − 0.159 (− 1.225) − 0.159 (− 1.225) Ahmed II − 0.032 (− 0.639) − 0.067 (− 1.237) Mustafa II 0.000 (0.000) 0.000 (0.000) Ahmed III − 0.001 (− 0.268) Mahmud I − 0.004* (− 1.729) Osman III − 0.074 (− 1.226) Mustafa III − 0.005 (− 0.845)
T
able 5.
(Continued)
Panel C: 1700 – 1792 (Recession period)
Panel D: 1793–1913 (Break-up period)
II I III IV I II III IV V 0.000 (0.000) 0.001 (0.054) − 0.006** (− 2.180) − 0.081 (− 1.363) − 0.015* (− 1.646)
T
able 5.
(Continued)
Panel A: 1586–1913
Panel B: 1586–1699 (Slow-down period)
Sample I II III IV V V I I II III IV Abdülhamid I − 0.018** (− 2.147) Selim III − 0.075 (− 1.504) Mustafa IV 0.000 (0.000) Mahmud II − 0.082** (− 2.450) Abdülmecid 0.006 (1.348) Abdülaziz 0.000 (0.000) Murad V 0.000 (0.000) Abdülhamid II 0.000 (0.000) Mehmet Re [scedil] ad V 0.000 (0.000) SSR 2.376 2.359 2.367 2.076 2.357 2.374 0.857 0.855 0.706 0.848 R 2 0.047 0.054 0.051 0.168 0.055 0.048 0.015 0.018 0.189 0.026 p -value 0.021 0.021 0.055 0.037 0.019 0.039 0.875 0.921 0.321 0.837 s¸
T
able 5.
(Continued)
Panel C: 1700 – 1792 (Recession period)
Panel D: 1793–1913 (Break-up period)
II I III IV I II III IV V − 0.022** (− 2.329) −0.175** (− 1.963) − 0.043 (− 1.059) 0.000 (0.000) −0.083** (− 2.232) 0.006 (1.267) 0.000 (0.000) 0.000 (0.000) 0.000 (0.000) 0.000 (0.000) 0.147 0.144 0.088 0.132 1.277 1.231 1.159 1.275 1.272 0.011 0.031 0.403 0.116 0.131 0.163 0.210 0.133 0.134 0.945 0.832 0.000 0.141 0.021 0.013 0.097 0.041 0.038
t-ratios are reported in parentheses. *10% significance level; **5% significance level.
T
able 6.
Results based on the CPI in silver grams
Panel A: 1586–1913
Panel B: 1586–1699 (Slow-down period)
Sample I II III IV V V I I II III IV Constant 0.005 (0.456) − 0.010 (− 0.802) 0.003 (0.308) 0.003 (0.268) 0.014 (0.922) − 0.024 (− 1.015) 0.016 (1.094) Fiscal expansion t–1 − 0.295** (− 3.826) − 0.304** (− 4.043) − 0.296** (− 3.849) − 0.374** (− 4.353) − 0.293** (− 3.802) − 0.299** (− 3.872) − 0.432** (− 4.958) − 0.435** (− 4.954) − 0.564** (− 5.151) − 0.428** (− 5.008) Fiscal expansion t–2 − 0.167** (− 2.159) − 0.174** (− 2.295) − 0.168** (− 2.159) − 0.215** (− 2.602) − 0.167** (− 2.161) − 0.171** (− 2.194) − 0.351** (− 3.466) − 0.356** (− 3.575) − 0.517** (− 4.376) − 0.342** (− 3.460) Fiscal expansion t–3 − 0.178* (− 1.819) − 0.178* (− 1.887) − 0.178* (− 1.803) − 0.225** (− 2.115) − 0.182* (− 1.841) − 0.182* (− 1.850) − 0.243* (− 1.714) − 0.234* (− 1.708) − 0.387** (− 3.014) − 0.234* (− 1.714) Fiscal expansion t–4 − 0.117* (− 1.914) − 0.119* (− 1.975) − 0.117* (− 1.913) − 0.172** (− 2.724) − 0.118* (− 1.953) − 0.121** (− 1.973) − 0.151 (− 1.444) − 0.133 (− 1.228) − 0.253** (− 2.655) − 0.150 (− 1.439) War 0.045** (2.234) 0.063** (2.094) slow down 0.011 (0.749) recession − 0.001 (0.749) break up 0.002 (0.123) First 0.015 (0.386) − 0.022 (− 0.365) constitution 0.066** (3.399) Murad III 0.022 (0.317) 0.002 (0.033) Mehmed III 0.009 (0.219) 0.019 (0.510)
T
able 6.
(Continued)
Panel C: 1700–1792 (Recession period) Panel D: 1793–1913 (Break-up period)
II I III IV I II III IV V − 0.001 (− 0.073) − 0.006 (− 0.305) − 0.007 (− 0.391) 0.003 (0.148) − 0.005 (− 0.242) − 0.001 (− 0.057) − 0.003 (− 0.134) − 0.282** (− 2.049) − 0.294** (− 2.182) − 0.389 (− 2.993) − 0.254 (− 1.841) − 0.239* (− 1.876) − 0.235* (− 1.872) − 0.272** (− 2.203) − 0.236* (− 1.857) − 0.249* (− 1.955) − 0.128 (− 1.103) − 0.136 (− 1.169) − 0.193 (− 1.773) − 0.087 (− 0.708) − 0.103 (− 0.885) − 0.097 (− 0.861) − 0.129 (− 1.127) − 0.105 (− 0.911) − 0.109 (− 0.938) − 0.108 (− 0.750) − 0.126 (− 0.816) − 0.129 (− 0.869) − 0.119 (− 0.826) − 0.202 (− 1.307) − 0.167 (− 1.269) − 0.261 (− 1.538) − 0.212 (− 1.349) − 0.207 (− 1.333) − 0.014 (− 0.119) − 0.033 (− 0.262) − 0.053 (− 0.439) − 0.028 (− 0.243) − 0.158* (− 1.722) − 0.138* (− 1.677) − 0.211** (− 2.223) − 0.165* (− 1.809) − 0.166* (− 1.792) 0.016 (0.404) 0.103* (1.732) 0.069 (1.204) 0.051 (0.795) 0.070** (2.530)
T
able 6.
(Continued)
Panel A: 1586–1913
Panel B: 1586–1699 (Slow-down period)
Sample I II III IV V V I I II III IV Ahmed I 0.141** (2.334) 0.195** (3.383) Mustafa I − 0.191 (− 1.641) − 0.099 (− 0.773) Osman II 0.109 (1.150) 0.069 (0.647) Murad IV − 0.009 (− 0.341) − 0.021 (− 0.727) Ibrahim 0.032 (0.658) 0.038 (0.928) Mehmed IV 0.011 (0.589) 0.019 (0.973) Süleyman II − 0.160 (− 1.504) − 0.166 (− 1.499) Ahmed II − 0.095 (− 1.268) − 0.159** (− 2.701) Mustafa II − 0.201** (− 3.316) 0.000 (0.000) Ahmed III 0.004 (0.131) Mahmud I 0.009 (0.236) Osman III 0.079 (1.289) Mustafa III 0.049 (1.314)
T
able 6.
(Continued)
Panel C: 1700–1792 (Recession period) Panel D: 1793–1913 (Break-up period)
II I III IV I II III IV V − 0.206** (− 3.110) 0.006 (0.238) 0.003 (0.079) 0.101 (1.595) 0.043 (1.128)
T
able 6.
(Continued)
Panel A: 1586–1913
Panel B: 1586–1699 (Slow-down period)
Sample I II III IV V V I I II III IV Abdülhamid I − 0.078 (− 1.468) Selim III 0.003 (0.055) Mustafa IV 0.197** (2.786) Mahmud II − 0.032 (− 0.659) Abdülmecid 0.032 (1.236) Abdülaziz 0.022 (0.580) Murad V − 0.049** (− 3.757) Abdulhamid II − 0.006 (− 0.462) Mehmet Re [scedil] ad V 0.084** (4.761) SSR 6.108 5.999 6.102 5.435 6.103 6.079 1.609 1.529 1.239 1.604 R 2 0.09 0.116 0.101 0.199 0.100 0.104 0.184 0.224 0.371 0.186 p -values 0.000 0.000 0.000 0.006 0.000 0.000 0.003 0.001 0.001 0.006 s¸
T
able 6.
(Continued)
Panel C: 1700–1792 (Recession period) Panel D: 1793–1913 (Break-up period)
II I III IV I II III IV V − 0.074 (− 1.326) −0.004 (− 0.072) 0.024 (0.263) 0.208** (2.716) −0.033 (− 0.659) 0.034 (1.231) 0.018 (0.452) −0.029 (− 1.532) −0.005 (− 0.402) 0.078** (3.474) 1.614 1.611 1.403 1.591 2.774 2.719 2.619 2.758 2.743 0.074 0.076 0.195 0.087 0.095 0.113 0.146 0.100 0.105 0.267 0.380 0.170 0.294 0.084 0.082 0.338 0.125 0.106
t-ratios are reported in parentheses. *10% significance level; **5% significance level.
V, on the other hand, showed statistically significant fiscal contraction and the highest contraction can be seen in the Sultan Mustafa II period. While the periods of Sultans Mustafa I, Murad IV and Mehmed IV showed statistically significant debasement in the slow-down era, the periods of Sultans Mahmud I, Mustafa III,
Abdulhamid I and Selim III showed statistically significant adoption of debasement
policies in the recession era. The Sultan Mahmud II period had a statistically signif-icant coefficient for the debasement in the break-up era. The highest debasement was seen in the Sultan Süleyman II period in the slow-down era, but its coefficient is not statistically significant. The Sultan Selim III period in the recession era and the Sultan Mahmud II period in the break-up era showed the highest statistically significant debasement. The highest and statistically significant fiscal expansion was seen in the Sultan Ahmed I period in the slow-down era. Although the Sultan
Osman III period showed the highest fiscal expansion in the recession era, its
coef-ficient is not statistically significant. The periods of Sultans Mustafa IV and Mehmed
Resad V showed statistically significant adoption of fiscal expansion policies and
the highest fiscal expansion was seen in the Sultan Mustafa IV period in the break-up era. These empirical results are presented in Tables 5 and 6 in column III of panel B, panel C and panel D and they are quite parallel to the panel A (column IV) results in Tables 5 and 6. The empirical evidence also suggests that each sultan chose debasement or fiscal expansion in the first year of his reign in order to win the goodwill of the soldiers and urban population so that he could stay on the throne. The results are presented in Tables 5 and 6 in Column V of Panel A. Also, the first year results (presented in Tables 5 and 6 in Column IV of Panel B, Panel C and Panel D) showed that both debasement and fiscal expansion were the reasons for inflation in the recession and break-up periods. Although debasement was seen in the slow-down period, fiscal contraction rather than fiscal expansion was seen in this era. However, the coefficients of the first year variable are not statisti-cally significant. The period of constitutional monarchy showed statististatisti-cally signif-icant anti-debasement policies. The empirical results suggest that fiscal expansion was the main source of the acceleration in inflation during the period of constitu-tional monarchy. These results are presented in Tables 5 and 6 in column VI of panel A and in column V in panel D. Pamuk (2000, pp. 222–242) says that debase-ment ended after 1844. Thus, our results are parallel to his findings.
Performing the regression analysis as an AR(4) process decreases the number of observations in the analyses as a result of the frequency of missing observations. Hence, we apply the AR(1) process for the inflation dynamics. In this case, we added a new dummy variable for the rise period (1478–1585). The basic results of the analyses were robust.5 The empirical evidence suggests that war accelerated inflation (as expected) and fiscal expansion rather than the debasement of the Akçe was the main reason for inflation. Moreover, the slow-down, the recession and the break-up periods affected inflation positively; both fiscal expansion and the debasement of the Akçe were seen as sources of inflation during these three peri-ods. The rise period, however, is associated with lower inflation. During the early years of the empire (that is the rise period), there was no need to rely on inflation-ary policies because the empire had some ways of increasing its revenue other than monetary or fiscal ones. However, it is important to note that even though the rise period did not show any debasement acts, we can see that the deflationary trend in inflation came from fiscal contraction in the rise period, probably more as a result of war spoils than to lower government spending. In spite of different inflationary policies during his reign. Each sultan accelerated inflation in the first