Ή -Ξ MSASUHEMcIfT OF SERVİCE CSJAUTiT E £ В
JjP t-lC JiT iC iS. OF SFBVOMAIt.
i í 3 í
T:-ssts
<Уа -- d ^ ^ / S . S ♦■42ı ^ î s^
s SA R İMArsksrs. Jan-a 1S95
THE MEASUREMENT OF SERVICE QUALITY : AN
APPLICATION OF SERVQUAL METHOD
A THESIS
SUBMITTED TO THE DEPARTMENT OF MANAGEMENT
AND
THE GRADUATE SCHOOL OF BUSINESS ADMINISTRATION
OF
BILKENT UNIVERSITY
IN PARTIAL FULFILMENT OF THE REQUIREMENTS
FOR THE DEGREE OF
MASTER OF BUSINESS ADMINISTRATION
By
Kardem BARJN June, 1995
I beoíi
ИР
S ^ í I S . S ■ В 3 9 -\ 3 d S^053814
I certify that I have read this thesis and in my opinion it is fully adequate, in scope and in quality, as a thesis for the degree o f Master of Business Adnnnistration.
Associate Professor Erdal EREL
I certify that I have read this thesis and in my opinion it is fully adequate, in scope and in quality, as a thesis for the degree o f Master o f Business Adrninistration.
Assistant Professor Serpil SAYIN
I certify that I have read this thesis and in my opinion it is fuUy adequate, in scope and in quality, as a thesis for the degree of Master of Business Administration.
Assistant Professor Selçuk KARABATI
Approved by the Dean of the Graduate School o f Business Administration
ABSTRACT
THE MEASUREMENT OF SERVICE QUALITY ; AN APPLICATION OF
SERVQUAL METHOD
BY
KARDEM BARIN
M. B. A. THESIS
BILKENT UNIVERSITY - ANKARA
JUNE, 1995
Supervisor: Dr. Selçuk KARABATI
SERVQUAL which calculates the differences between expectations and perceptions o f the customers for a specific service is currently the most popular measure o f service quality. This study aims to apply SERVQUAL at a Turkish company which operates in apparel manufacturing business and has many stores where these products are sold in. The interviews that are made with the company managers help to discuss the SERVQUAL results. The SERVQUAL score of the company shows that the customers' expectations are well satisfied by the services delivered by the company. However the small shortfall still provides a room to make further improvements. The areas where the company can make improvements are also identified in the study for setting effective service quality goals; modifying the evaluation, reward and control systems for employees which will be based on service quality delivery; giving employees flexibility and initiative in handling problems; taking competition more seriously and acting accordingly.
Keywords : Quality, Service Quality, Measurement o f Service Quality, SERVQUAL
ÖZET
HİZMET KALİTESİNİN ÖLÇÜLMESİ: SERVQUAL YÖNTEMİNİNE
YÖNELİK BİR LYGULAMA
HAZIRLAYAN
KARDEM BARIN
İŞLETME YÜKSEK LİSANS TEZİ
BILKENT ÜNİVERSİTESİ - ANKARA
HAZİRAN, 1995
Tez Yöneticisi: Dr. Selçuk KARABATI
Bir hizmeti kullanan müşterilerin o hizmet ile ilgili beklentileri ve gerçekte algıladıkları arasındaki farkı hesaplamaya dayalı SERVÇUAL yöntemi, günümüzde hizmet kalitesinin ölçülmesinde kullanılan en yaygın yöntemdir. Bu çalışmanın amacı, SERVÇUAL' m giyim sektöründe hizmet veren ve ürünlerini kendi mağazalarında satan bir Türk firmasına uygulanmasıdır. Çalışma sonucu elde edilen SERVÇUAL puanı, firmanın müşterilerinin beklentilerini karşılamada kısmen başarılı olduğunu göstermektedir Yine de, firmanın hizmet kalite düzeyini daha da yükseltecek önlemlerin alınması sayesinde, görülen ufak sapma da kaybolacaktır. Etkin kalite hedeflerinin belirlenmesi, çalışanların değerlendirme, ödüllendirme ve kontrollerinin hizmet kalitesine dayalı sistemlerce yapılması, ve çalışanlara problemlerini çözmeleri sırasında daha çok esneklik ve insiyatif verilmesi önerilen önlemler arasındadır.
Anahtar Kelimeler: Kalite, Hizmet Kalitesi, Hizmet Kalitesinin Ölçülmesi, SERVÇUAL
TABLE OF CONTENTS
ABSTRACT ÖZET 11 LIST OF FIGURES V LIST OF TABLES VI I . INTRODUCTIONI . SCOPE AND PURPOSE OF THE STUDY
I I I . LITERATURE SURVEY
IV . SERVQUAL : AN INSTRUMENT FOR MEASURING
SERVICE QUALITY
11
l y . l . Introduction IV.2. More About Gaps
IV.3. Applications o f Servqual IV.4. Limitations of Servqual
11
15 18 19 V . METHODOLOGY22
111V I. FINDINGS and DISCUSSION
VI. 1. The Results o f the Interviews VI.2. The Results o f Servqual Study
V I I . CONCLUSION APPENDIX A A PPEN DIX E APPENDIX C APPENDIX D APPEN DIX E APPENDIX F APPENDIX G
The Questionnaires Filled by Customers (GAP 5) The Questionnaires Filled by Managers(GAP 1) The Questionnaires Filled by Managers(GAP 2) The Questionnaires Filled by Personnel(GAP 3) The Questionnaires Filled by Personnel(GAP 4) The Questionnaires Filled by Managers
(Antecedents of GAP 1 and GAP 2) The Questionnaires Filled by Personnel (Antecedents of GAP 3 and GAP 4)
BIBLIOGRAPHY 27 33 43 48 52 54 55 56 57 59 62 27 IV
LIST OF FIGURES
LIST OF TABLES
Table 1: The Demographic Profile o f the Survey Respondents
Table 2: The Servqual Score
Table 3: Gap 1 Score
Table 4: The Antecedents of Gap 1
Table 5: Gap 2 Score
Table 6: The Antecedents of Gap 2
Table 7: Gap 3 Score
Table 8: The Antecedents of Gap 3
Table 9: Gap 4 Score
Table 10: The Antecedents of Gap 3
33 34 35 35 37 38 39 40 41 41 VI
I . IN TRO D U C TIO N
As the decade of 1990 ' s unfolds, people are very much concerned about the quahty of services rendered, not only services are so much a part o f what they produce, consume, and export but also people are more demanding than before due to time and income constraints. Probably the most important thing is that firms realize that it is wiser to compete on the basis of quality than o f price alone, and to invest more on improving service quahty, knowing that it is more costly to attract new customei-s than to retain old ones.
Firms which are deeply concerned with the profitability o f their activities, actually try to improve their services' quality in the eye of their customers. When service improvement investments lead to perceived service improvement, quality becomes a profit strategy. In the PEMS (Profit Impact of Marketing Strategy) Principles, Buzzell and Gale (1987) make the point clearly about the relationship between the perceived quality and profitability;
In the long-run the most important single factor affecting a business unit's performance is the quality o f its products and services relative to those of competitors. A quality edge boosts performance in two ways; (1) in the short-run, superior quality yields increased profits via premium prices, (2) in the long-run, superior/improved quality leads to market expansion and gains in the market share. The resulting growth in volume means scale advantage over the rivals, so the short-run costs connected to improving quality are offset by scale economies.
This study takes its starting point from the importance o f the service quality and aims to measure service quality, which is an important stage of a service quality improvement program, b y applying SERVQUAL iu a retail shop.
In Chapter 2 and Chapter 3, the research problem is defined and the related literature is reviewed. In Chapter 4, detailed information about SERVQUAL and its apphcations are provided. In Chapter 5, the information about the methodology employed in this study is presented. In Chapter 6, the results o f the interviews and SERVQUAL, and the obtained results are discussed.
n . SCOPE AND PURPOSE OF THE STUDY
Service quality is a central issue today. Several reasons underlying this notion are:
- Service economy has become an important component of nations' economy, - Providing superior quality has become a winning competitive strategy,
- Manufacturing firms have been adding services in order to differentiate their goods fi*om those of competitors,
- There is a considerable dissatisfaction among customers with the service quality.
As Parasuraman, Zeithaml and Berry (1990, p. 2) have mentioned, by improved service quahty " ...Customers win. Employees win. Management wins. Stockholders win. Communities win. The country w in s."
It was only in the 1970’ s that service quality came to be seen as a special field for study. One of the subject that has been studied is how to measure service quality. SERVQUAL is an instrument developed for this purpose by PZBi . It aims to identify the customers' expectation about the quality of the service rendered and what they actually perceive. The model also helps to diagnose service quahty problems and derive solutions to these problems which are used in improving service quality. It was adopted to several service companies like retailing
1 Because o f the frequent references to Parasuraman, Zeithaml and Berrj' in this stu(fy, hereafter they are referred to as P2B.
banking, securities brokerage, product repair and maintenance, hospitals, retail shops.
This study aims to apply SERVQUAL to measure the quality of the offerings of VAKKO which is the most famous firm in the fashion business and retail shopping. VAKKO name is generally associated with quality in Turkey. This study tries to show whether VAKKO satisfies its customers' e^q^ectations with its current performance, and which factors are effective in its quality.
The SERVQUAL questionnaires are responded by the customers, the personnel, and the managers o f VAKKO, which will help in figuring out the gap between the customers' expectations and the perceptions of its service; and the antecedents of this quality gap. The philosophy o f quality, the activities carried out for quahty, the role of the employees, the role o f managers in VAKKO will also help the interpretation of the questionnaire results.
I l l , LITERATURE SURVEY
The US Government Standard Industrial Classifications System describes service firms as those " Primarily engaged in providing a wide variety o f services for individuals, business and government establishments and other organizations. Hotels, establishments providing personal, business, repair and amusement services; health, legal, engineering; educational institutions, membership organizations... ." This definition fails to cover service firms like real estate, financial services, retailers, wholesalers, transportation and public utilities. When there exist ambiguities even in the definition of " service, " defining quality for services becomes more harder.
Due to several differences between service and manufacturing, quality definitions for manufacturing are not relevant for services. Examination of the literature on services provides us the following important characteristics of services:
- Service outputs cannot be stored due to their intangibihty.
- Production and consumption of the services cannot be totally separated. - Services are more labor intensive.
- Customers' participation iu the delivery system may be required. - Delivery system is time sensitive.
- Identification o f needs of customers and performance standards are difficult. - A high degree of customization is required.
- Quality characteristics o f services include behavioural dimension and image that shape expectations.
- Customization can be standardized only to a certain extent.
Defining and improving quality of services is important for several reasons (Gummensson, 1991):
* Service industries lag behind in systematic quality efforts.
* There is considerable customer dissatisfaction with the service quality. * Manufacturing firms' need to differentiate their goods from those of competitors and adding services provide such opportunities.
* The public sector, which was originally meant to serve the citizens, has lost its mission to a large extent. It has grown steadily, burdening tax payers, at the same time being accused o f high costs, inefficiency and low quality. Efforts to get it back on its original course are being made in various ways like deregulation and privatization.
The importance o f service quality leads service firms to define the quality and measure it as a starting point o f the service quality improvement program. However, quahty is difficult to define, describe, and measure in services. While quality control measures have long existed for tangible goods, few such measures have traditionally existed for services. Statistical tools have been useful especially within the intermediate and adrninistrative operations of service dehvery system, however they have not been adaptable to the high consumer contact operations o f service organization; they do not seem to fit the organizations' intangible outputs. Quality for services is determined by imprecise individual factors; perceptions, expectations and experiences of customers and providers (Brown, Gummensson, Edvardsson, 1991).
The three distinguishing characteristics o f services (intangibility, heterogeneity, inseparability) make the application o f the quality measurement tools used in
manufacturing for services difficult. The intangibility o f services impHes that precise manufacturing specifications about uniform quality can rarely be set for services. The services, especially with high labor involvement are heterogeneous, and their performance often varies from producer to producer, from customer to customer, and from day to day. Finally, the inseparability of production and consumption o f services implies that quality cannot be engineered and evaluated at the manufacturing plant prior to dehvery of the service to consumers. As a result, uniform quality is difficult to ensure in services.
The relevant literature suggests three underlyiug themes:
* Service quality is more difficult for consumers to evaluate than goods' quality.
* Service quality perceptions result from a comparison o f consumer expectations with actual service performance.
* Quality evaluations are not made solely on the outcome o f a service; they also involve evaluation of the process o f service delivery.
One approach to quality is to list those characteristics essential in assessing service quality. PZB (1985) identified the determinants of service quality that may relate to any service: reliability, responsiveness, competence, access, courtesy, communication, credibility, security, understanding/knowing the customers, tangibles. Then, these were boiled down to five due to the correlation among them: tangibles, rehability, responsiveness, assurance and empathy. Gronroos (1988) has suggested six criteria, the five of which are those listed by PZB, and the sixth adds an essential dimension, namely " recovery. "
Another approach is " gap analysis. " People perceive reality differently. There, then, exist perception gaps. However, various gaps interfere widi quality. PZB (1985) have identified five gaps:
1 . The gap between customers' expectations and management perceptions of those expectation will have an impact on the customers' evaluation of the service quality.
2 . The gap between management perception o f consumer expectations and the firms' service quality specifications will affect service quality from the customers' viewpoint.
3 . The gap between service quality specifications and actual service dehvery will affect service quality from the customers' standpoint.
4 . The gap between the actual service delivery and external communications about the service will afreet the service quality from customers' standpoint.
5 . The gap between the expectations if the customers and the perceptions o f them about the actual service delivered.
The strategy that is proposed by PZB is " narrowing and closing these gaps " for the improvement of the service quality.
Another gap model, consistency analysis, is proposed by Edvardsson and Gustavsson (1991). It is a diagnostic model identifying inconsistencies, gaps on two scales (1) between ideas and goals at one end, and implementation and actual results at the other end,. (2) between the formal and official objectives at one end, and informal and subjectively experienced goals at other end of the scales. These scales are combined into four cell matrix and it constitutes the basis for auditing a service organization's quality and productivity. This model provides four fields o f
analysis for study. The analysis leads to identification of problem areas, which should be dealt with if the service quahty is to be improved.
Gummensson (1991) brings a holistic view to the service quahty concept, stating that quality is an integrator between production orientation & marketing orientation, and between interdepartmental activities in the process. He proposes to unify the production oriented definition of quahty (Quality is conformance to requirements) and the customer oriented definition of quality (Quahty is fitness for use) in the concept o f customer perceived quahty: Quahty in the eye of the customer. In order to achieve quahty, marketing management, fitness for use with conformance to requirements must be united. According to Gummensson, this thinking concerns not only the external customers but also all the employees, namely the internal customers from whom external customers receive products, documents, messages and decisions.
While measuring quahty for services is more difficult than for goods due to above mentioned reasons, PZB, after building the conceptual definition of service quahty and five dimensions, developed SERVQUAL as an instrument for measuring the quality of the service in question^. It is widely used and its rehability and adaptabihty on certain services is assessed by several researchers. Babakus and Mangold (1992) applied SERVQUAL scale to hospital services and came up with the results indicating that SERVQUAL can be successfuUy used to assess the magnitude o f the gaps between patient perceptions & expectations, and that SERVQUAL is reliable and valid in tiie hospital environment. However, Finn and Lamb (1991, p. 487) found that " SERVQUAL measurement is not appropriate in a retail store setting, " causing them to conclude that retailers and consumer researches should not treat SERVQUAL as an " off the sh e lf" measure
■ A more detailed explanation o f SERVQUAL is presented in Chapter IV o f this study.
of perceived service quality. Much refinement is needed for specific companies and iudustries.
Another instrument for measuring service quality was introduced by Cronin and Taylor (1992), namely SERVPERF. Stating diat the conceptualization and measurement of service quality by SERVQUAL are based on a flawed paradigm, namely disconfiimation paradigm, they used only the 22 performance items o f SERVQUAL. They concluded that these 22 performance items adequately define the domain o f service quahty. Although proposed as an alternative to SERYQUAL, SERVPERF uses the perception (performance) questionnaires o f SERVQUAL.
IV . SERVQUAL : A N INSTRUMENT FOR MEASURING SERVICE
QUALITY
IV. 1. Introduction
PZB tried to seek answers to the key questions which remained unanswered. These questions are as follows :
* How exactly do customers evaluate the quality of service ?
*Do they directly make global evaluation or do they assess specific dimensions of a service in arriving at an overall evaluation ?
*If they evaluate specific dimensions, then what are the multiple dimensions on which they evaluate the service ?
*Do those dimensions vary across services and different customer segments ? *If customers' expectations play a crucial role in the assessment o f service quahty, which factors shape and influence those expectations ?
For answering these questions, they conducted 12 customer focus groups interviews, covering service sectors hke retail banking, credit cards, securities brokerage, product maintenance and repair.
According to those focus group findings, meeting and exceeding the expectations of customers is what " good quality " means. This understanding brings that, judgement of quality depends on how customers perceive the actual service
performance according to what they expect. How customers feel about the quality of service that has been actually provided by the company is " perceived quality " and what the customer assumes receiving when a service is purchased is the " expected quahty. " Therefore, service quality is maintained when the discrepancy between customers' expectations and perceptions gets smaller.
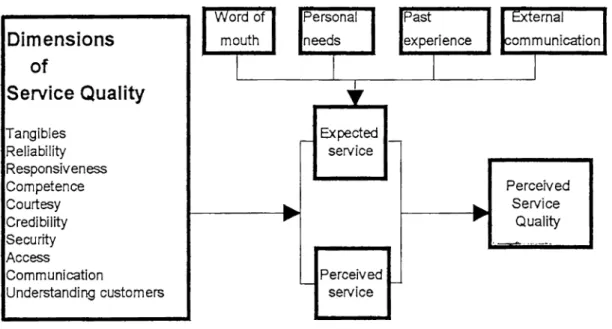
Several additional factors influencing the expectations o f customers were identified by the help of focus groups. One o f them is " word of mouth " which is what customers hear from other customers. " Personal needs " o f customer is another factor that shapes the expectations. The third influencing factor is the " customers' past experience " about the service rendered. The more experienced the customer is, the less importance he/she gives to the behavioural attributes such as greetings and fiiendluiess, but the more demanding he/she becomes about the technical attributes. " External communications " is the last factor like advertisements. What they do is they give direct or indirect messages about the promises, and they shape the customers' expectations.
It was understood from the focus groups that same set o f criteria was essential for all four service sectors' quality judgement. Ten general criteria or dimensions were identified. These dimensions which are nor independent o f each other are appropriate for assessing quahty in a broad variety of services. These dimension are as follows:
* Tangibles: Appearance of physical facihties, equipment, personnel and
communication materials.
* Reliability: Abihty to perform the provided service dependably and accurately.
* Responsiveness: Williigness to help customers and to provide prompt service.
* Competence: Possession o f required skills and knowledge to perform the service.
* Courtesy: Politeness, respect, consideration and friendliness o f the contact personnel.
* Credibility: Trustworthiness, believability, honesty o f the service provider. * Security: Freedom from danger, risk or doubt.
* Access: Approachability and ease o f contact.
* Communication: Keeping customers informed in language they can understand and listening to them.
* Understanding the customers: Making effort to know customers and their needs.
Figure 1 provides a pictorial summary of the focus group findings.
Figure 1: Customer Assessment of Service Quahty ( PZB, 1990 )
Building on the conceptual definition of service quality and ten evaluative dimensions from the focus groups, they developed an mstrument for measuring service quahty, namely SERVQUAL. It has five distinct dimensions - tangibles, rehabihty, responsiveness, assurance and empathy - which consolidate aU o f the ten originally conceptualized dimensions. The last seven dimensions were consohdated into two broader dimensions as assurance and emphaty whereas tangibles, rehabihty and responsiveness dimensions remained intact.
The SERVQUAL methodology helps in determining where the gaps between the customers' perceptions and expectations are, and in understanding the mtemal and external shortfalls o f the company. In this sense, the model can be also called " gaps m o d el." Five gaps have been identified that need to be narrowed to reach excellence:
GAP 1 : customers' expectations - management perception
GAP 2 : management's perception - service quality specifications GAP 3 : service quality specifications - service delivery
GAP 4 : service delivery - external communication GAP 5 : customers expectations - perceived service
The last gap, GAP 5, is the service quality shortfall perceived by customers whereas others are considered as shortfalls witii the service firms’ organization and they represent the major causes of GAP 5.
IV.2 . More About ” GAPS "
GAP 5
It is the first gap that has to be measured by using the dimensions o f service quality specified earlier. The other four gaps provide information to diagnose the causes of GAP 5.
By the questionnaires filled by the customers, the expectations about the quality of the service rendered and the perceptions about the actual service provided are identified (Appendix A). The design of the questionnaires and computation of related SERVQUAL scores is presented in the " Methodology " section.
G A P l
It tries to understand the shortfall between customers' expectations and the managers' understanding of these expectations. Wrong understanding o f customers' expectations may lead the management to end up with bad decisions and suboptimal resource allocations. Stressing wrong attributes which do not connote high quality to customers, does not contribute to the firms' quality perception. Spending a lot of money or physical source of the company, while the customers expect more convenient, comfortable and functional facilities, is useless. The managers' inaccurate understanding of customers' expectations would result in perception of poor service delivery performance. So to narrow GAP 5 (to improve fiie service quality), GAP 1 should be closed by encouraging managers to gather more and accurate information about their customers' demand.
Same questionnaires which are used to identify tbe customers' expectations are also filled by managers and related score is computed (Appendix B).
GAP2
It identifies whether there exist performance standards that reflect the correct understanding of customers' ejqpectations. When there are problems in translating the knowledge of these expectations into service quahty specifications or when the specifications are absent, quahty o f service will be inversely affected. Closing this gap, by setting performance standards that reflect customers' expectations will narrow GAP 5, so improve file service quality.
A specific questionnaire is filled by the managers in order to determine the existence of so-called specifications (Appendix G).
GAPS
It widens when contact personnel cannot meet the designed standards that fulfil expectations. The failure of meeting the standards may have several reasons like unwillingness, inabifity o f the employees or the lack o f process capacity which stays lower than the volume of transactions. So the reasons are very much related with internal constraints, and PZB prove the fact that quality in services dehvered should be achieved by adequate and appropriate resources, especially human resources.
The contact personnel are asked to fill up the questionnaires (Appendix D) in order to determine their ability to meet the standards.
GAP4
Many customers might perceive poor service quality due to unmet promises which leads to big GAP 4, showing the discrepancy between the actual delivered service and promised service.
Customers collect information by external communication of the companies and their perceptions are very much affected by the messages and promises communicated to them. The communicated promises might not be met due to lack o f co-ordination between operation and marketing people. If the operation people are not informed about the promises made by the marketing people, they would unlikely to meet them and this would bring dissatisfied customers.
The questionnaires which help in determining the size o f GAP 4 are filled by the contact personnel (Appendix E).
SERVQUAL provides service quality gap scores at different levels: for each statement pair, for each dimension or combined across all dimensions. It helps companies not only to assess the overall quality o f service they dehver but also identify the key dimensions and facets within those dimensions which are key areas for quahty improvement efforts. SERVQUAL can also serve for different purposes:
-
Comparing Customers' Expectation and Perceptions Over Time:
Through repeated administration o f SERVQUAL (once a year etc.), the levels o f expectation and perception and how the gap between the two is changing can be tracked.
-
Comparing Your Own SERVQUAL Scores against Competitors' Scores:
SERVQUAL makes it convenient to measure the service quahty of several competing companies' supply by including a set o f perception statements for each company. So the company can track its quality of service against o f its competitors, gains or can gain insights about its strengths and weaknesses and how they are changing over time.
-
Examining Customer Segments with Different Quality Perceptions:
This is one of the application of SERVQUAL which gives the opportunity of categorizing the customers into several perceived-quality segments. These segments can be analyzed on demographic, psychographic profiles or relative importance of file five dimensions or the reasons underlying the reported perceptions. Firms can imderstand expectations of the best customers and shape themselves accordingly.
IV.3. Applications of Servqual
SERVQUAL, developed by PZB at 1985, is critisized in relation with its limitations by several researchers.
Carman (1990) proposes SERVQUAL to be customized to the service in question although it was originally designed to provide a generic measure that could be applied to any service. He proposes adding items or changing the wording of the items and adding more dimensions to original SERVQUAL dimensions. He mentions that collecting data in terms of perception - expectation difference
directly
rather than asking questions about each separately is more appropriate. He also gives an example for his suggestion; " The visual appeal of X Y Z ' s physical facilities are (much better/better/about the same/worse/much worse) than I expected."
Edvardsson and Gustavsson (1991) make criticism about the neglect o f the cost and price aspects o f service quality definition for PZB. They consider cost as an important aspect for service quality which should be taken into account when analyzing service quality firom the m anagem ent's perspective. They state that price of the service is often ignored which is unrealistic and underlines the fact that quahty is multidimensional and must be analyzed in the given context. But still, they find SERVQUAL as the most useful tool for obtaining a wider understanding or quality in service processes.
IV.4. Limitations of Servqual
Cronin and Taylor (1992) address the issue of the conceptualization and measurement approach used in developing SERVQUAL. In their research, the perceptions component o f SERVQUAL outperformed SERVQUAL score itself
which led them to conclude that the disconfiimation paradigm was inappropriate for measuring perceived service quahty.
Brown, Churchill and Peter (1993) pomt the issue of the SERVQUAL measure. Difference scores involve the subtraction of scores on one measurement to create a new variable which is used in subsequent data analysis. With SERVQUAL, service quality is assessed by subtracting subjects' ratings o f expected levels of service from tiieir ratings o f the actual level o f service received with respect to each of a number o f specific items representing five dimensions.
PZB (1993) in respond to Brown, Churchill and P eter's critique o f SERVQUAL's difference score conceptualization which they think offers richer diagnostics, mention that not only relying the perceptions scores but using SERVQUAL scores has several advantages.
1 . Measuring expectations and perceptions separately allows managers to better understand the dynamics o f customers' assessments of service quality over time. 2 . Another advantage is that the gathered data serve equally well the dual objectives o f accurately diagnosing service shortfalls and explaining tiie variance in service variables. Difference scores can be used for the former while perceptions score alone can be used for the latter.
3 . The measuring expectations and perceptions separately prevents management from focusing more attention on improving any of the dimension which is not indicated to receive much importance from the customers by SERVQUAL scores but by perception scores.
PZB also consider the SERVQUAL items as file basic skeleton underlying service quality and add that it can be supplemented with context-specific items
when necessary. They give guidelines for incorporating such items into the SERVQUAL framework in PZB (1991). They, in fact, respond the critiques about the customizing SERVQUAL to the service in question.
V. METHODOLOGY
This study aims to measure the level of service quality of a well known apparel manufacturer and retailer, namely VAKKO by using SERVQUAL method. The aim is not to evaluate die relevance o f the SERVQUAL method, but to apply it to the business that the company operates.
Data gathering has been realized by interviews with the shop managers about their quality concept and practices, and by several sets o f questionnaires in order to assess GAP 1 through GAP 5. The questionnaires, after translated into Turkish, are distributed to managers, personnel and the customers in order to be responded.
Since questionnaires are the very important tool o f the study, it would be beneficial for the reader if detailed information on the design and the content o f them is provided.
A . The Questionnaires for Customers (Appendix A)
The questionnaires filled by the customers provide data about their expectations and perceptions o f the service over the five dimensions. The respondents evaluate the statements m the questionnaires on a seven-point scale from 1 (strongly disagree) to 7 (strongly agree). The first questionnaire, asking the expectations, and the second questionnaire, asking the perceptions about the actual service delivery, contain 22 statements concerning five dimensions.
Question 1 - 4 --- Tangibles Question 5 - 9 --- Reliability
Question 1 0 - 1 3 --- Responsiveness Question 1 4 - 1 7 --- Assurance
Question 1 8 - 2 2 --- Empathy
The data is converted to SERVQUAL score (GAP 5) by:
SERVQUAL SCORE = Perception Score - Expectation Score
This is a SERVQUAL score for each statement pair, for each customer. The average score for each dimension is computed by:
1 . For each customer the score computed above pertaining to the dimension are added and the total is divided by the number of the statements making up the dimension.
2 . The quantity obtained in step 1 is added across all N customers and the total is divided by N.
3 . The overall unweighted score is obtained by adding the quantities in step 2 and dividing them into five, the number of the dimensions. The overall weighted score is obtained by the same procedures but the scores in step 1 are multiplied by the importance ratings given by the customer.
The more negative the score, the more serious the service quality shortfall in the eye o f the customer.
B . The Questionnaires for Managers (Appendices B, C)
They are designed to measure Gap 1 and Gap 2. The same questionnaire which is filled by the customer about their expectations, is now filled by the managers in order to understand their understanding of their customers' expectations. The score is found by subtracting the average perception score received by the managers from the average customer expectation score. The more negative the score obtained, the more problems in the managers' understanding of their customers' expectations.
Gap 2 score is obtained by the data gathered through the related questionnaire (Appendix C). They are also responded by the managers since they are the ones who set the quality standards in the firm. On the scales used to measure Gaps 2/3/4, higher numbers imply smaller gaps. An overall measure o f each gap is obtained by averaging the scores across the five dimensions.
C . The Questionnaires for Contact Personnel (Appendices D, E)
The questionnaires which are designed to measure Gap 3 and Gap 4 are filled by the contact personnel.
D . The Questionnaires for Measuring the Antecedents of Gap 1 through Gap 4
These questionnaires used to identity the potential antecedents o f two managerial gaps (1 and 2) are filled by managers (Appendix F). The specific antecedents, and statements on the questionnaire pertaining to them are as follows;
Antecedents of Gap 1 Corresponding Statements
Marketing research orientation Upward communication
Levels of management
1 - 4 5 - 8 9
Antecedents of Gap 2 Corresponding Statements
Management commitment Goal setting Task standardization Perception o f feasibility 1 0 - 1 3 1 4 - 1 5 1 6 - 1 7 1 8 - 2 0
The questionnaires used to identify the antecedents o f Gaps 3 and 4 are responded by the contact personnel (Appendix G). The specific antecedents, and the statements on the questionnaire pertaining to them are as follows:
Antecedents of Gap 3 Corresponding Statements
Team work Employee job fit Technology job fit Perceived control
Supervisory control systems Role conflict Role ambiguity 1 - 5 6 - 7 8 9 -1 2 1 3 - 1 5 1 6 - 1 9 2 0 - 2 4 25
Antecedents of Gap 4 Corresponding Statements
Horizontal communication Propensity to overpromise
2 5 - 2 8 2 9 - 3 0
The average score for each antecedent is computed in 3 steps ;
1 . For negatively worded statements, the ratings are reversed (7 to 1, or 6 to 2 etc.)
2 . For each respondent, the scores are added on the statements comprising the antecedent and the total is divided by the number of statements.
3 . The scores obtained in (2) are added across all respondents and the total is divided by the number of the respondents. The higher the score, the more favourable the current status of the antecedent.
V I. F IN D IN G S A N D D ISC U SSIO N
VI. 1. The Results of the Interview s
The interviews with the Ankara store manager and department supervisors of Vakko provide the opportunity to write about the history, business, management, and the dominating quality concept o f Vakko:
Vakko is in the business of manufacturing and retailing apparels, texture and accessories such as shoes, bags, scarf The designing and tailoring of the apparels and fabrics are done in its factory in Merter, Istanbul whereas accessories are being subcontracted. Vakko has many outlets in many large cities such as Ankara, Adana, Antalya etc. where only the Vakko products are being sold. The customers can buy goods for house decoration, cosmetics, and " Vakko Chocolate " from the Vakko stores. In Vakkorama, which is targetting the young Vakko customer, special apparel collections, stationary, watches, cassettes, CDs, books and tickets for many entertainments such as jazz concerts, theatre are being sold. The Vakkorama customers may rest at the in-shop-pubs while having their snacks. Vakkorama may either be located at one o f the floor in the Vakko building or has its own building.
Vakko name is associated with " quahty " since its existence. Especially the Vakko scarf, tie and fabrics have high reputation in Turkey. The main reason of this reputation may be due to the fact that Vakko started the business with producing and seUing these products. After Atatürk introduced " hats ” to Turkish
people which was very new for them, Htali H aM o who is the founder of Vakko, decided to produce hats in several models, so Vakko was established as a small studio in 1940, in Istanbul which was tiie orily potential market for a profitable business in that days. While wearing hats were becoming the important part of Istanbul aristocracy's dressing, the hats produced by Vakko gained reputation.
In the following years, another business of Vakko had emerged. The famous Vakko scarf was started to be produced. Similar to " hat " experience, Vakko scarf gained high acceptance and reputation. The famous tailors used these scarves as fabrics, by connecting one to another. The increasing demand from tailors led Vitali Hakko to fabricate the scarves in longer meters so the business of fabrics had then started. The fabrics produced by Vakko were very much different than those in the marketplace with their colours and design.
Within the years 1959 and 1960, Vakko experienced a crisis. The conservative tailors were not pleased with the colours and design o f Vakko fabrics. They thought that these fabrics were so "modem" and far from being worn by the Turkish people, and they stopped buying Vakko fabrics. So, Vakko opened its first store in Istanbul in 1962 with the intention and the aim o f " teaching Turkish people how to dress well and in a European fashion. " The Vakko fabrics were now being tailored by the clothing makers of Vakko and the fashionable garments were then being sold in Vakko' s own retail shop.
Vakko is a " boutique " rather than an " apparel shop. " Vakko produces a model o f a certain apparel in its collection in a limited number so the ones who get them first, are considered lucky. This " boutique " notion is accompanied with a different selling philosophy. Vakko does not make consecutive price discounts even if all of its products are not able to be sold in the season. Although other
firms in this business have more firequent and longer discount periods, Vakko prefers producing each item carefiilly in small amounts and making only two discounts in a year, one in February and the other in August. The price discounts are valid only for three days and letters are sent to each Vakko customer in order to inform them about the beginning o f discount period. After the discount period, in which approximately 75 % of products are sold in the first day, the stores are prepared for the next season. The interior design, decoration and maintenance o f the buildings are done, new products are placed in the store.
The positioning as a " boutique " creates the mam difference between Vakko and Beymen which is another Turkish company operating in apparel business and is considered as the closest competitor o f Vakko. The manager of Vakko, Ankara states that " W e share the market, that is right. However, there is not any competition between us. Vakko is a boutique. We are competing with ourselves. It may sound weird to you but we do not look outside, but inside. "
The mission of Vakko is providing " the best " in the business they are. While doing this, Vakko plays the leadership role in the domestic market among its competitors, but prefers to follow the European and US firms outside. Vakko has services similar to those of US and European apparel shops no matter how extensive their services are. The management thinks that benchmarking with the international rivals should be adopted by all firms operating in this business.
Vakko does not only follow the services o f European shops, but also it follows the up-to-date European apparel fashion. The highly talented stylists of Vakko imitate the creations o f the European designers and adapt them according to the taste of Turkish customer. The only difference is that the prices o f same quahty
Vakko products are one third o f the European prices.
In 1978, Vakko established its own outfit in London and made considerable sales. However, the reactions toward Vakko from the famous European fashion designers and retailers were so high that London outfit was closed. The reasons for these reactions was that Vakko was (is) a successful follower (imitater) of European fashion and their prices were (are) only the one third of the prices asked by famous European designers. Vakko left London, but opened another shop IQ Vienna since there was an export engagement that Vakko should fulfil. After the fulfilment o f the engagement, the Vienna outfit was also closed. The problems in customs, associated with bringing the remaining products back to Turkey; and the difficulties of exchanging products quickly 3 led to the end of Vienna story.
As it is mentioned by the management, the dominating quality philosophy in Vakko is not achieving " zero defections, " but trying to compensate and minimize the losses o f the unsatisfied customer. The management thinks that although the goal of " zero defections " is important, achieving this goal is difficult. So Vakko puts great emphasis to compensate the losses, while putting some effort on eliminating them.
In Vakko, the complaints of customers are not recorded. Recording the mistakes done in the past has no use, thinks the management. What they do is correcting the consequences at the moment the complaint has occured. The expectations o f customers are not taken into consideration. Instead, Vakko tries to shape the expectation o f its customers, goes in front of them and leads them - so to speak.
The customer-contact persormel working in the Vakko stores are being trained carefriUy. The philosophy of rendering services in Vakko, is communicated to the
^ In Turkey, the product that does not satisfy the customer is changed with another one. It can be either provided from other Vakko stores or reproduced in the fectory.
personnel during the three weeks training course. The key ingredients of this philosophy are:
* Being courteous and smiling while dealing with the customers.
* Treating each and every customer in a consistent manner, even if the customer is not there with the intention o f shopping, he or she may be a potential buyer.
* Not forcing the customer to buy any of the product. If a personnel is making compliments to customer about how well the apparel suits him or her, this would not be done with the intention o f selling the product, but reflecting personnel' s sincerity.
The manager o f Vakko in Ankara states that the Vakko employees who contact with the customers are the erucial part of Vakko and its services, so their appearances, attitudes and communication skills are very important. Besides giving courteous service, they are encouraged to come up with recommendations in order to contribute in improving services. In Vakko, if one has a bright idea concerning a product, a service or an activity, he or she is welcomed to share with and communicate to the top management, even to Cem Hakko. Cem Hakko is the son of Vitali Hakko and the president of Vakko. He is the most influential person in shaping the strategies and the activities of Vakko. While successfully integrating his personal interests and tastes to the business, he does not ignore the idea and recommendations of Vakko staff. The only problem with Cem Hakko, the Ankara store manager added, is that he may not find time to listen to the recommendations, because he is very busy. The employee who has suggestions to top management should inform his/her immediate superior about the suggestion, and his/her superior informs the related department or manager. However, this is the procedure that the employees who works for the store other than Istanbul
should follow. Others have the chance to communicatewith the top level managers since they are in the same workplace.
Vakko asks high prices for its high quahty and fashionable products. However, the management states that die high prices are not inflated intentionally, tiiey are the actual reflections o f high input costs. Most o f the Vakko apparels and accessories include European items such as buttons, zippers, tiiread, so costs are considerably high and reflected in the final prices. Ankara manager of Vakko finds useful to add t h a t " In fact, tiiese high prices contribute a lot to the quality perception o f the customers. They are aware o f the fact that they pay money for high quality. " However, the Turkey ' s customs union with tiie European community in 1996 which will lead to considerable cost reductions for most industries due to abolishment o f tariffs, will also affect the cost structure o f Valdco. Consequently, the prices will be lowered. The management thinks that this would not badly affect the Vakko image, in fact will bring additional competitive advantage o f " high quality and moderate prices. ”
Vakko always wants to prove that Vakko is able to make " the b e s t." With this underlying objective, Vakko has introduced special perfumes because a perfume is considered as an important accessory of modem men and women. V de VAKKO is created for men and KATIA is for women. Besides the perfumes, Vakko has special Vakko chocolate which is very high in quality. Another activity o f Vakko is the radio station, namely POWER FM. It is located in tiie Beyoğlu Store of Vakko in Istanbul in order to stay in touch with the customer . The requests o f customers shopping are played immediately. The radio is used as an important tool for maintaining Vakko image, advertising and getting customer feedback. VakkoGym where sports activities such as body building, step, aerobics are carried out, serves the aim of attracting people who are not the customer o f Vakko.
VI. 2. The Results of the Servqual Study
65 Vakko customers were asked to fill up the questionnaires. Only 40 of them could be collected back. These questionnaires were, then, used to identify the Gap 5 of the company. The demographics profile o f the respondents is presented at TABLE 1:
TABLE 1; The Demographic Profile of the Respondents GENDER Male 37% Female 63 % AGE 20-30 50% 31-40 17% 41-50 17% Over 50 16%
MONTHLY INCOME (mUIion TL)
<30 60%
>30 40%
FREQUENCY OF SERVICE DEMAND
Sometimes 53 %
Every Season 47%
The % 61 o f the respondents find ’’ reliability " as the most important dimension of a service quality of an excellent store. " Responsiveness " is found to be the second most important service quality dimension by % 54 of the respondents. " Tangibles " dimension is the unimportant dimension by % 60 of the respondents in deciding the quahty o f services provided in the apparel stores. " Empathy " and " assurance " dimensions are not mentioned by the respondents.
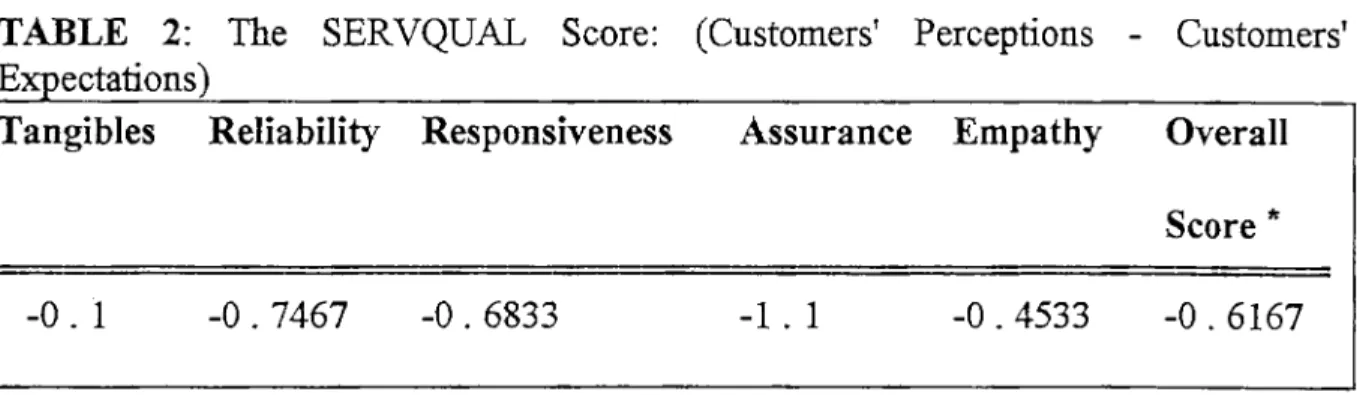
The general results of 40 customers o f the company ’ s score in Ankara are presented below at TABLE 2;
TABLE 2: The SERVQUAL Score: (Customers' Perceptions - Customers'
Servqual Score of the Company (Gap 5)
Tangibles Reliability Responsiveness Assurance Empathy Overall
Score *
-0 .1 -0.7467 -0.6833 - 1 .1 -0.4533 -0.6167
5(C
The weighted score is computed as - 0.75
The overall score does not indicate a huge gap between the perceptions and the expectations. The company performs well on the Tangibles dimension, which means that customers are satisfied with the appearance of the physical facilities, equipment, personnel and other service facilitating materials. Truly, the company gives specific importance to the interior design and ambience o f the stores, and the appearance of its personnel because they think that this contributes to " perceived quahty. " However, it is useful to recall that Tangibles dimension is fiio u ^ t to be unimportant in assessing the quality of such services. This indicates that there seems to be no need for the company to further invest on Tangibles dimension.
The largest gap belongs to Assurance dimension, whereas the most important and the second most important dimensions o f service quality, namely Reliability and Responsiveness dimensions, indicate significant gaps. Since the company customers rely on these dimensions to a high extent while deciding on the quality o f company ' s service, the management should make further improvements on the quality o f these dimensions.
Gap 1 Score and the Antecedents
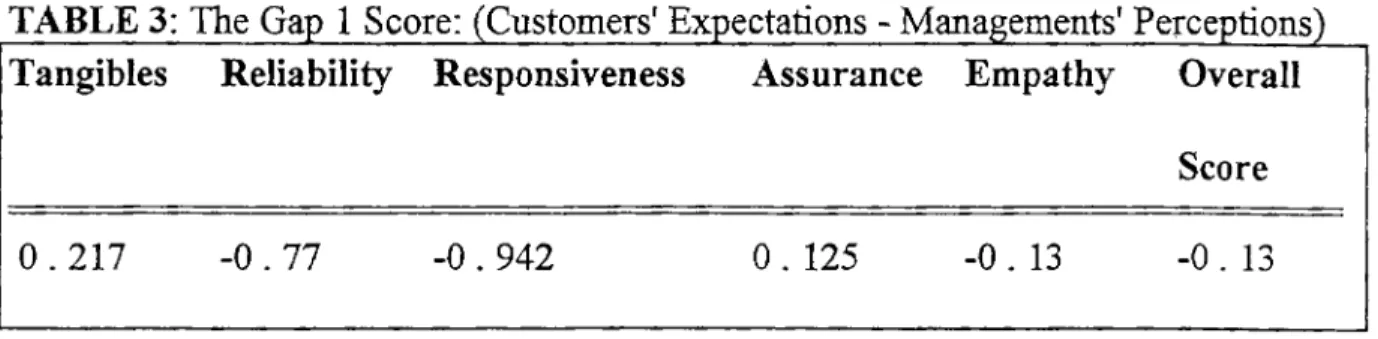
The results of Gap 1 are presented at TABLE 3:
Tangibles Reliability Responsiveness Assurance Empathy Overall
Score
0 .2 1 7 -0 .7 7 -0 .9 4 2 0 . 125 -0 . 13 -0. 13
The overall score reveals that the company management is doing well in perceiving its customers ' expectations, but it still needs improvement because it has a negative value although it is very much close to zero which is the ideal score. The management is successful at perceiving the customers ' expectations on Tangibles and Assurance dimensions. The lowest scores belong to the second most important dimension. Responsiveness, and the most important dimension. Reliability. Since the management fails to identify and perceive the true expectations o f its customers, it is vital for the company to close the gap. The antecedents presented at TABLE 4 provide information to the company about the reasons of the gap and how the gap can be improved.
TABLE 4: The Antecedents o f Gap 1
Specific Antecedents
Marketing Research Orientation
Upward Communication Levels of Management Score 6 . 8 7 5 6 . 7 5 4 . 5 35
The. score of the first antecedent is very close to 7 which is the highest score. This shows that the com pany' s management makes an effort to understand customers' needs to a high extent. The company uses informal information gathering activities such as taking the views of respectful customers during fiieir shopping, or listening the opinions and experience of the branch managers about their branch ' s customers. However, the company does not conduct any research to identify the expectations of their customers. In fact, during the interviews, the managers told that the company does not take the expectations of the customers into account, but it tries to shape these expectations. It would be highly beneficial for the company to identify which features are most important for their customers, which levels of these features customers expect, and what customers think the company can and should do when problems occur in service delivery. Gathering and using the complaints of the customers strategically, which is not currently done in the company, is one of the method for understanding the customers, and it requires low investment o f money and time.
In the company, managers encourage suggestions firom customer contact personnel for the improvement of services, products and activities. The customer contact personnel can communicate with managers either formally or informally. Managers have face to face contact with them frequently. This approach o f the management is reflected in the high score associated to Upward Communication.
The last antecedent has a low score, which reveals a problem in the levels of management. Currently there are three organizational levels between the customer contact personnel and the president.
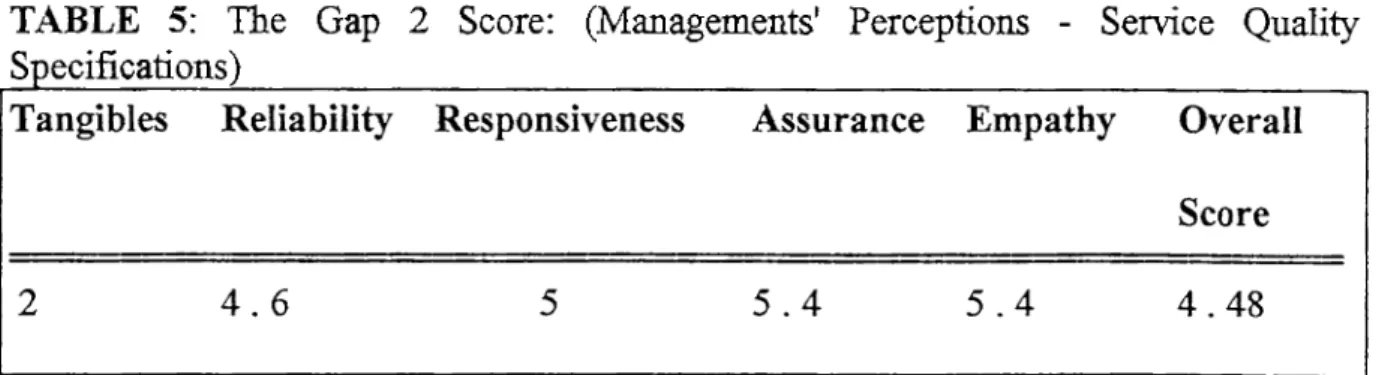
Gap 2 Score and the Antecedents
The results o f Gap 2 are presented at TABLE 5:
TABLE 5: The Gap 2 Score: (Managements' Perceptions - Service Quality Specifications)
Gap 2 shows the presence o f performance standards mirroring management's perception o f the customers ' expectations. In the company, there are no formal and written standards. However, there are informal and unwritten standards that each employee is expected to understand and comply with. These standards are tried to be communicated during the three week training program designed for the new employees. In the 7 - point scale, the more close the score to 7, the more formal and written the standards are. The overall score reveals clearly the fact that the company has standards which are informal, but embedded in the company’s culture. Tangibles dimension gets the lowest score which shows that the extent of informality is h i^ e r. This is due to the fact that, the appearance of physical facihties, interior design and personnel are not under formal standards. The interior design reflects the tastes and the creativity of Vakko interior designers. The only standard for them is to make plain, yet elegant decoration which is consistent with the Vakko image. The standard regarding tiie appearance of the personnel is being well - dressed and clean.
For Reliability and Responsiveness which are found to be the most and second most important dimensions relatively, the company needs and should make
improvements. The results presented at TABLE 6 indicate the antecedents of Gap 2;
TABLE 6: The ^ te c e d e n ts of Gap 2
¡Specific A ntecedents Score
Management's Commitnie;it to Service Quality Goal Setting 1-, - 5 . 5 Task Standardization 5 . 5 Perception of Feasibility 6 . 5
The first antecedent takes the h ip e s t score, so it does not provide opportunity to close the gap. However, the company is not so successful in setting service quality goals. Therefore, effective service quality goals which should be designed to meet the customers ' e?q)ectations are needed. They should be specific, accepted by the employees, and measured (reviewed) with appropriate feedback.
The task standardization in service organizations means using hard and soft technology to standardisize service task. The company currently has automated check approval, implemented in-store telephone directors to allow employees to contact other departments and stores quickly, reorganized wrapping stations, and simphfied order forms.
The last antecedent means the extent to which managers perceive that meeting customers ' expectations is feasible. In the company, as it is also obvious from the high score, the management respects customer and bears any cost for the sake of
compensating his or her losses. The management is not unwilling to think about the customers' needs and make improvements.
Gap 3 Score and the Antecedents
The results of Gap 3 are presented at TABLE 7:
Tangibles Reliability Responsiveness Assurance Empathy Overall
Score
5 . 7 3 6 . 5 5 6 . 4 5 6. 895 7 6. 525
The overall score indicates tliat the company does not have any problems in having the necessary resources for the fulfilment of high quality service. The company gets the highest score in Empathy. Actually, individual attention the company provides to its customers is the main attribute where the company differentiates. Especially for the company customers who do shop frequently are known by their names and dealt individually. Also, the company congratulates the
special days of customers by mailing greeting cards to each customer.
The associated reasons o f the small gap can be detected when the antecedents of Gap 3 are analyzed. TABLE 8 indicates the results:
T i ^ L E 8: The Antecedgi^ts qf Ga^ 3
Specific Antecedents Score
Team Work 6'.2i·
Employee-Job Fit 6 . 6 8
Technology-Job Fit 6 . 9 5
Perceived Control 5 . 1 9 8
Supervisory Control Systems 4 . 3 8 6
^Role Conflict 4 .6 5 9 '
. Role Ambiguity 5 . 4 3 2
The Supervisory Control Systems gets the lowest score. This indicates that there are problems associated with the evaluation and reward systems o f the company, and that the company needs to modify and revise its control systems so that these systems will be based on service quahty dehvery.
The next low score is for Perceived Control (the extent to which employees perceive diat they can act flexibly) . In the company, the employees are in the position of asking their superior even for the replacement of a product that does not satisfy flie customer. Therefore, it is important for the company to encourage its employees to use initiative in handling problems.
Role Conflict which occurs when management emphasizes selling over service and expects employees to sell while they serve, gets a low score. Currently, the employees o f the company are told not to insist customers on buying any o f the
company products with the intention of selling. This philosophy is communicated to the personnel in training courses. The low score may be due to the misunderstanding o f the employees o f the questions in the questionnaires or the failure of die company in communicating their philosophy to the customer-contact employees.
G ap 4 Score and the Antecedents
TABLE 9 indicates the results of Gap 4:
Tangibles Reliability Responsiveness Assurance Empathy Overall
Score
6 . 4 6 . 6 6 .8 6 .6 6 . 9 5 6 . 6 7
The scores are very close to seven which is the highest score. This indicates that the company is powerful in external communications. The antecedents of Gap 4 are presented at TABLE 10:
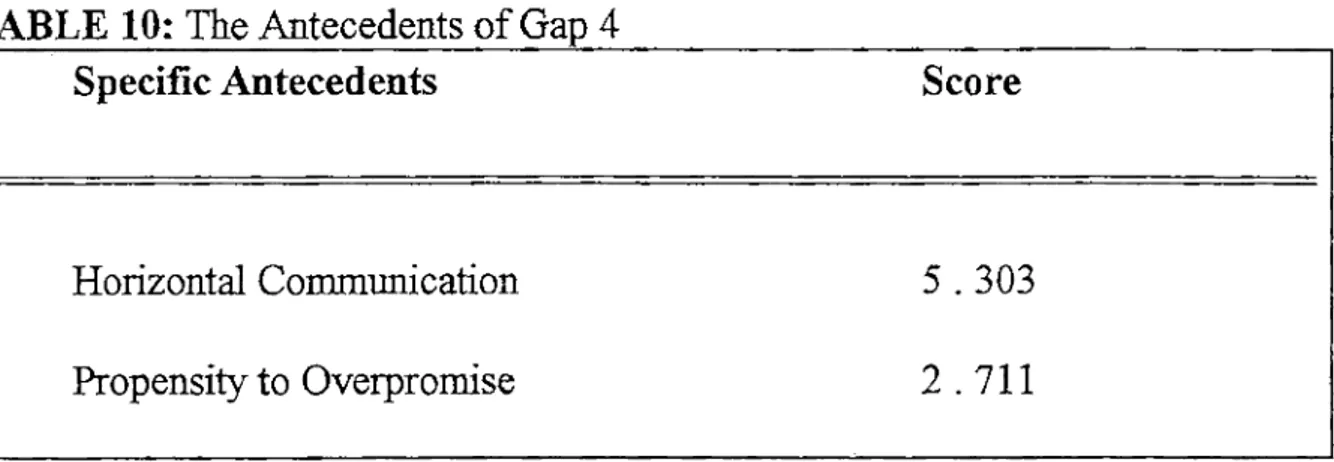
TABLE 10: The Antecedents o f Gap 4
Specific Antecedents Score
Horizontal Communication 5 . 3 0 3
Propensity to Overpromise 2 . 7 1 1
The problem lies on the Propensity to Overpromise, indicating that overpromising is very high in the business that the company operates. This pressure to
overpromise will usually inflate customers' expectations and lead to lower service quality perceptions. Since the company does weU in Horizontal Gommunication, the low score for Propensity to Overpromise is not reflected in Gup 4 score. The company should take the competition seriously instead o f ignoring, as it does currently.
V II. CO NCLUSIO N
As the decade unfolds, service quality becomes a central issue, and firms realize the importance of competing on the basis of quahty in order to have sustainable competitive advantage.
improvements in service quality increase productivity, customer loyalty and profitabihty o f a firm. The improvement process starts with the measurement of the. service quahty. SERVQUAL makes the measurement of quality possible in all service delivering companies.
This study aims to apply the SERVQUAL procedure to measure the quality of the offerings of a Turkish company which operates in clothing sector, produces its own brand o f apparels and related accessories, and retails them in the company - owned shops.
The results o f the study show that Reliability is the first attribute in assessing the quahty of services provided in the apparel stores. Then comes the Responsiveness as the second most important quality dimension. Tangibles dimension is not valued while determining the quality o f services dehvered in the apparel shops.
The SERVQUAL score, GAP 5, which helps to identify ttie quahty level perceived by the customers of the company, is found to be very close to the ideal score which is zero. The smaU gap, however, stiU shows a need to make improvements on the service quahty. The major reasons for the smah shortfall in
the quality reflected iu GAP 5, are obtained measuring GAP 1 through GAP 4. The results show that GAP 2 is the most critical reason of the shortfall.
The study also provides the antecedents of GAP 1 through GAP 4. These findings which are compared with the interview results, help in identifying the areas where the company needs further improvement in order to reach the ideal level.
The number of managerial levels, separating customer-contact personnel from top management, affects the communication and xmderstanding in the company. A lth o u ^ suggestions and ideas of the contact personnel are welcomed by the top management, the personnel should follow the levels of management up in the hierarchy to make his or her recommendation. He/she should inform his/her immediate superior about the desire to make recommendation, so the superior will take the suggestion to the upper levels in the hierarchy. Especially the persoimel working m the other stores of the company such as Adana and Ankara, should follow this procedure since they do not have the chance to come across one o f the top level managers who work in Istanbul.
The existence of subordinate and superior relation prevents personnel from acting flexibly and using initiative in decision making. Reducing the number o f levels between personnel and top management is necessary for speeding up the service dehvery, shortening decision making process and getting quick feedback from customer-contact personnel. Currently, department chiefs, department managers and the store manager are the managerial positions in the company stores. One position for managing departmental activities and supervising the department staff will be adequate. Therefore, the department chief position may be eliminated. Each department should be decentralized so that the decision specific to departments will be made within the department.