of Competition in Turkey
Siibidey Togan
Since the mid—19605, the Turkish Government has promoted invest-ments through various incentives. The purpose of this paper is to analyze the effects of investment incentives and the taxation system on conditions of com-petition and thus on competitiveness in Turkey. After assessing the industrial subsidies provided through the investment incentives and taxation system, the analysis concentrates on the study of market structure. Section 1 describes the investment incentive scheme, and Section 2 explores the corporate tax system in Turkey. In Section 3 the study assesses the investment incentive scheme using marginal effective tax rate (METR) analysis. The effect of the invest-ment incentive scheme on market structure is studied in Section 4.
1. Investment Incentive System
Since the adoption of the first Five Year Development Plan in 1963, Turkey
has encouraged economic activity through a complex system of incentives. In addition to assisting domestic production through import licensing, quantita-tive restrictions on imports, and overvalued exchange rates, Turkey has used direct production incentives. Consideration of these incentives reveals that the government, has granted a number of incentives in order to promote invest-ment in activities and areas regarded as desirable. The incentives, regulated by laws and decrees, have been directed at reducing the cost of investment,
reduc-ing the need for external financing, and increasing profitability.
There are certain peculiarities to this incentive scheme. First, incentives are differentiated on a regional basis. For the purpose of incentives, Turkey has been divided into three regions: “developed regions” consisting of the provinces of Istanbul and Kocaeli and the municipal districts of Ankara, Izmir, Bursa, Adana, and Antalya; “regions with special priority in development” consisting of provinces like Corum, Sivas, Tokat, Van, Agri and Kars, deter-mined by a resolution ofthe Council of Ministers; and “normal regions” con-sisting of provinces except for the regions with special priority in development and developed regions. Second, incentives are differentiated by sectors. According to Decree 98/10755 concerning government subsidies, issued in the Official Gazette on March 25, 1998, sectors with special importance include education, health, international transportation, research and development, electricity, energy production, infrastructure investments, investments in
industrial zones, and investments to be made on build-operate-own and/or build-operate-transfer models. The third characteristic of the incentive system is that all incentives originate from the central government. The agency that administers the incentive scheme is the Undersecretariat for the Treasury. The incentive scheme is implemented on the basis of “investment incentive certifi-cates” (lIC) granted by this agency. Only investments with IICs are eligible for incentives. The fourth specialty of the incentive scheme derives from certain conditions on lower limits, investment totals, and minimum levels of own sources and exports, which must be fulfilled in order to benefit from various incentives. The minimum equity rates for benefiting from investment incen-tives are set as 40 percent for investments realised in regions with special priority in development, 50 percent in normal regions, and 60 percent in devel-oped regions, with 15 percent in investments of ship construction, yacht construction, and ship and plane imports. For investments to be supported by MC, the minimum fixed investment amount should be 50 billion Turkish Lira in high priority regions and 100 billion Turkish Lira in other regions. Furthermore, Resolution No. 99/12474 of the Council of Ministers, published in the Official Gazette of March 5, 1999, defines Small and Medium Size Entities (SME) as industrial enterprises which employ a maximum of 150 workers, whose total value of physical assets excluding land and buildings is less than 100 billion Turkish Lira. SMEs are eligible for IIC. The various types of investment incentives provided during the of period of 1999—2000 can be summarized as follows:
1. Investment Allowance: The investment incentive allowance is a deduction from taxable income for corporate tax purposes. The allowance comprises a certain percentage of the cost of machinery, equipment, instruments, building, and other depreciable capital assets, which is deducted from the company’s tax-able income. According to the annexed third article of Chapter 8 of the Income Tax Code No. 193, investment allowances can apply to investments that are realized in sectors with special importance and/or in regions with priority in development and organized industrial regions at a rate of 100 percent. The Council of Ministers is able to increase the investment allowance rate to 200 percent in investments that exceed the Turkish Lira equivalent of $250 million. 2. Value Added Tax (VAT) Support for the Purchase of Machinery and Equipment: The delivery of machinery and equipment within the scope of investment “C has been exempted from the VAT.
3. Exemption on Taxes, Fees and Duties: If an investment is guaranteed to generate a certain level of exports the loans made for this investment and relat-ed transactions receive exemptions from taxes, fees and stamp duties.
4 Customs Duty and Housing Estate Fund Exemptions: Imports of
and Mass Housing Fund paid in accordance with the Decree on Import Regime. Raw materials, semi-processed materials, and management materials cannot benefit from customs duty and fund levy exemptions.
5. Energy Subsidy: Energy subsidies are given to new investments in certain
Sectors realized in regions having priority. Twenty five percent of the
electric-ity consumption in over five years of operation may be subsidized from the
sources of “Encouragement of Investments and Services Providing Foreign Exchange Earnings Fund.”
6. Land Allocation: Land has been allocated by the government for tourism investments. upon request, land is to be allocated by the government for investments undertaken in regions enjoying priority in development.
7. Credit Allotment from the Fund: The credit allotted from the “Investment EncOuragement Fund” will be supplied for supporting and guiding invest-ments that aim at regional developinvest-ments and investinvest-ments of small and medi-um sized entities related to research and development, technopark, protection of environment, and technological investments with priority determined by the Science and Technology Supreme Council, within the framework of state aids to investment and related legislation.
The government, through the use of the above mentioned and similar incentive measures, has been able to reduce the effective cost of borrowing to investors, thereby reducing the cost of investment, and thus increasing the profitability of investments.
2. Tax System
The Corporation Tax Code applies to the profits earned by companies with
share capital (joint stock companies, limited companies, limited partnerships), cooperatives, state-owned companies, economic enterprises owned by associ-ations and foundassoci-ations, and mutual funds and investment trusts. Profits of companies subject to corporations tax are calculated in accordance with the provisions of Articles 40 and 41 of Law No. 193, the Income Tax Law. This law specifies that all business-related expenses and income must be included when calculating taxable income, and the accrual method of accounting must be used. Only realized earnings constitute taxable income.
The main procedural law that is currently in effect is the Tax Procedures Code (Statute 213), which contains provisions regulating procedures concern-ing, among others, methods that apply during the valuation of assets, liabili-ties, and payables.
The Tax Procedures Code requires that fixed assets be valued at cost, while
payables and receivables denominated in Turkish Lira should be valued at their carrying value. According to the Code, depreciation is allowed on both tangi-ble and intangitangi-ble assets. Three methods of depreciation are allowed: the
straight-line (SL) method, the declining-balance (DB) method (including the double declining method) and the extraordinary depreciation method. Under
the SL method, depreciation on m0veablefixed assets may be taken at any rate
chosen by the tax payer, up to an annual maximum of 25 percent. If the DB-method is employed, the maximum allowable depreciation rate is increased to 50 percent. Once a rate is selected it cannot be changed in subsequent years. Under extraordinary conditions, the Ministry of Finance may determine a spe-cific rate for the enterprise. The tax payer can switch from DB method to SL
method during the life of an asset. The option is applied on an asset-by-asset
basis. The depreciation rates for some fixed assets that have short useful
eco-nomic lives are determined by the Ministry of Finance. Typical allowed rates of depreciation are 35-50 percent for furnitures and fixtures, 40 percent for assets related to certain food industries (biscuits, chocolate) and 50 percent for assets related to the liquid oil or gas industry. In order to protect the asset side of the balance sheet from inflationary erosion, the Turkish corporate income tax system introduced inflation adjustment of depreciation allowances at the end of March 1987. The revaluation rates are determined annually by the Ministry of Finance as the average increase in the WP1.
The inventory costing methods permissible are the first-in-first—out (FIFO)
method, last-in-first—out (LIFO) method, or specific identification of historical cost of inventories priced at the lower of cost or market value. Capital gains
earned from the sale or disposal of fixed assets subject to depreciation are
taxed at the normal rate of corporation tax, but may be deferred for three years.
Gains are not taxable to the extent that the proceeds are reinvested in new fixed
assets.
. Regarding the indexation of the liability side of the balance sheet, nominal interest payments are deductible from corporate taxable income. A small but incomplete step was taken in 1994. Under the new corporate income tax code,
companies engaged in retail and wholesale business have to add 25 percent of
a proxy for the inflation component in interest payments to their taxable
income. The discrimination in favor of debt finance increases as inflation rate
rises because no distinction is made between real interest rates and the infla-tionary erosion premium contained in nominal interest payments. Finally, loss-es incurred during the current year can be carried forward and deducted against
income for a five-year period, but they are not indexed.
The Turkish corporate income tax code was first passed in 1949 and
amended many times thereafter. Until 1985, companies were subject to a tax of 40 percent on their taxable income. The rate was increased to 46 percent in 1985. A 10 percent withholding tax was imposed on earnings exempt from cor-poration tax. In December 1993, legislation eliminated most of the tax exemp-tions, introduced partial inflation adjustment for interest payments and reduced
the corporate tax rate from 46 percent to 25 percent, but added a general income tax on the corporate after-tax income. The general income tax was 10 percent for companies listed on the stock exchange and 20 percent for ed companies. This implied a net reduction of six percentage points for unlist-ed companies from 46 percent to 40 percent. For listunlist-ed companies, the runlist-educ- reduc-tion was larger, with combined rate of 32 percent. The legislareduc-tion stipulated that corporate income tax should not be less than 20 percent of corporate prof-it. Furthermore, 70 percent of the assessed corporate tax was collected as advance tax payments in twelve installments.
The level of tax rates as of 2000 are determined through the provisions of Law No. 4369, enacted in July 1998. According to the Law, the corporation tax rate is 30 percent of taxable profit, on top of which there is a 10 percent fund, bringing the aggregate rate to 33 percent. In the case of the corporation dis-tributing the dividends to shareholders, a withholding tax of 10 percent of the after-tax profit, on top of which there is a 10 percent fund, brings the total tax burden to 40.37 percent. Since the withholding tax amounts to zero percent in the case of publicly-owned companies their total tax burden is only 33 percent.
3. Effects of the System of Taxation and Investment Incentive
Scheme
To assess the effects of the investment incentive scheme and the system of tax-ation in Turkey, we consider a hypothetical investment project. The analysis is based on the approaches of King and Fullerton (1984), the OECD (1991), and Dunn and Pellechio (1990). The project is assumed to incur all of its invest-ment costs in the year before the project generates income, namely year zero. Thereafter, the project generates a stream of operating income from year one until the end of the operating period, namely period T. The levels of operating income are chosen so that the project generates a real before-tax rate of return of r percent on the equity invested in the project. Next, we determine the real after-tax rate of return r,l that will be attained under the prevailing system of taxation, which we call the base case. Finally, we consider the real rate of return I'M, that will be attained under the prevailing tax system and the various investment incentives schemes. The marginal effective tax rate (METR) is then calculated as:
METR = (I‘.i&s-ral)*100/rm
Let [0 denote the amount of investment at time t=0. The project consists of investment in land, buildings, machinery, and equipment and vehicles. The shares of these assets in total investment are 0t, percent for land, 0L2 percent for buildings, 0L3 percent for machinery and equipment, and 0t4 percent for
vehi-cles. The rate of economic depreciation is assumed to amount to gl percent for land, g2 percent for buildings, g3 percent for machinery and equipment, and g.i percent for vehicles. Each year in order to preserve the productivity of invest-ment, the company engages in replacement investinvest-ment, which equals the rate of economic depreciation of the assets concerned. The real value of economic depreciation at time t (t = 1,..,T) equals (g,on.+..+giou)10 . Denoting by it the annual rate of inflation, assumed to remain constant over time, the economic depreciation and hence replacement investment at time t measured at current
prices is obtained as 1. = (g.a.+..+g.oc.)1., (1+n)‘ for (t = 1,2,3...)
In the model the before-tax (BTCF) and after-tax (ATCF) cash flows at time t are written as:
BTCFt = -E,+ Rl —— Wl - Matt - Intl - Prinl + NetSalesofAssets,
ATCF1= BTCFt + InvCred, ta (Ri— Wl Matl+ InvCredt Dep. lntDedl -Carryoverl + Capgain1+ NomInvGain)
where Eldenotes the amount of equity used to finance the investment in year t, including the part of replacement investment, R. investment income, Wl wage cost, Matl expenditures on materials, Intl interest paid on debt, Prinl payment on principal, NetSalesof Assetst net revenue from sales of assets, ta statutory plus any surtax tax rate, InvCredi investment credit in year t, Depl depreciation allowance taken in year t, lntDedl interest deductions in year t, Carryoverl car-ryover losses in year t, Capgainl capital gains in year t, and NomInvGainl nom-inal gains on goods held in inventory in year t.
In the case of all equity finance we have L, = E), Prinl = 0 = Int, for all
t = 1,2,... and equity issue used to finance the investment is zero for t = 1,..,T.
We assume for the purpose of simplification that Wl = Matl = O for all t. Given the “real before tax rate of return” (r) and the initial level of investment 10 the
“real before-tax cash flow” is determined as r10 and the “nominal before-tax
cash flow” as r10(1+7t)’ for (t = 1,2,3,...). Hence, in the first equation, the value
of BTCF1 is determined as “nominal before tax cash flow.” To determine the
net sale value of assets at the end of operating period T, we define the sale price of capital at time t as the sale price of capital at time t-l plus the replacement investment at current cost at time t minus economic depreciation at current cost at time t. Since, by hypothesis, replacement investment equals economic depreciation for all t, the sale price of capital equals 1(,(l+7t)"’ for t = 1,2,... Since capital is sold at the end of operating period NetSalesofAssetsl is posi-tive for the operating period and zero otherwise. Since, the value of EconDepl is determined by the approach described above, Rl investment income in year t is determined as the value that balances the equation.
In the debt financed case, we assume that the company borrows initially to
over the life time of the project. We consider the percentage of initial
invest-ment financed by debt as a given constant parameter. Given the initial value of
debt denoted by D, we assume that this debt is to be paid back in equal annu-al instannu-allments of A over the life of the project. Let i be the nominannu-al rate of
interest on debt given by i =(1+r)(1+n)'1where r is the “real before tax rate of
return” on investment. Then the annuity is obtained as:
iD
“(a—W)
Given the amount of debt in period t-l, DH , we subtract the interest pay-ments on this debt from the annuity A and obtain payment on principle as (A— iD... ). Thus the evolution of debt over time is given by:
D. = (1+ i) D... —A.
As revealed by the equation determining the before-tax cash flow, the interest
payments on debt iD... and principle payments on debt (A - iD...) are
subtract-ed from the before tax-cash flow.
The after-tax cash flow equals the before-tax cash flow minus taxes paid
plus credits. The statutory tax rate plus any surtax rate are multiplied by tax-able income to yield the regular tax liability. Taxtax-able income in Turkey equals investment income plus investment credits, minus depreciation allowances, investment deductions, and interest deductions. A positive taxable income may be reduced by losses being carried forward. Furthermore, when the asset is sold, capital gains or losses are included in the taxable income.
Regarding depreciation, we note that the model in principle considers three methods of depreciation: straight line depreciation (SL), declining balance depreciation (DB), and double DB depreciation with switchover. In the case of SL-depreciation, we denote byd, the straight line depreciation rate of the asset i. The straight line basis equals I0 at time t=1, and DI =10+I,+..+I.-l for t=2,3,.... Then SL depreciation in real terms at time t equal diD.. Under DB depreciation we consider for each type of asset (buildings, machinery and equipment, vehi-cles) the original and replacement investments at different time periods as dif-ferent investments because of the inflation factor. Book value of the original investment at time-period t is calculated as book value of the investment at time t-l minus the DB depreciation. DB-depreciation at time t is determined as DB depreciation rate multiplied by the book value in period t-l. Finally, under double DB depreciation with switchover we consider for each asset the difference between double DB depreciation and SL depreciation. During the time period when this difference turns to a negative number we switch over to SL depreciation.
The nominal after-tax rate of return is the internal rate of return for the after-tax cash flow. This rate is then adjusted for inflation to yield the real
after-tax rate of return denoted by r,ll . Using a similar procedure we obtain the
real rate of return rm, that will be attained under the prevailing tax system and the various investment incentives.
4.1 Base Solution and Incentives for 1999
We consider a typical investment project. It is an investment in land, buildings, machinery and equipment, and vehicles, with shares of 10 percent in land, 25 percent in buildings, 65 percent in machinery and equipment and zero percent in vehicles. The Undersecretariat of the Treasury, which administers the investment incentive scheme, usually issues the “investment incentive
certifi-cates” (IIC) for a subset of these investment expenditures. Not all expenditures
are considered eligible for IIC. Studies by the Treasury Undersecretariat reveal that, on average 20 units of investments amounting to 120 units are found to be non-eligible for IIC. The 100 units of investment expenditures eligible for IIC are assumed to have the shares specified above. Considering the non-eli-gible 20 units of expenditures as part of investment in land, we have the adjust-ed shares as on. = 25, CL; = 20.83, OL; = 54.17 percent, and on. = 0. The initial level of operating income is chosen so that the project generates a real before-tax rate of return of 20 percent. Following Dunn and Pellechio (1990), we assume that the economic depreciation rate of buildings, machinery and equip-ment, and vehicles equals 3.6, 12.5, and 30 percent respectively, and that the straight line depreciation rate equals the economic depreciation rate for the assets considered. The operating period of the project equals thirty years.
In Turkey, the corporation tax rate, according to Law No. 4369 enacted in July 1998, was 30 percent of taxable profit during 1999. On top of this
corpo-ration tax, there is a ten percent fund payment bringing the total aggregate tax
rate to 33 percent. In case resident taxpayer corporations distribute dividends to shareholders, a withholding tax of eleven percent on after-tax profits, including fund levy, is applicable. The withholding in question is zero percent for publicly owned companies. In the event that such corporations do not dis-tribute dividends and/or add them to the capital, there will be no question of a withholding liability. In this study, we consider the case of a private company that distributes total profits as dividends. Given the corporate tax rate of 30 percent and fund rate of 3 percent, the after-tax profits of 100 units of pre-tax profits amounts to 67. The withholding tax on distributed dividends amounts to 6.7 and the fund levy 0.67 percent. As a result, the total corporate tax bur-den equals 40.37 percent.
During periods of inflation, the indexation of depreciation allowances, inter-est deductions, interinter-est earned, carryover of losses and unused tax credits, and capital gains turn out to be of prime importance for maintaining the real value
of various elements of the tax system. This model fully indexes the system by insulating the system completely from the effects of inflation. The inflation rate in the model is taken as the 1999 WPI inflation rate of 72.3 percent.
In the base case, we assume that there are no investment incentive allowances. The value added tax rate is 15 percent. Following Karakoyunlu
(1987), we assume that the tax, duty and charge associated with financial
transactions amounts to 4.4 percent of the loan extended. We assume that 70 percent of machinery andequipment is imported. Using the input-output table of 1990 prepared by the State Institute of Statistics and the nominal protection data of Togan (1997), the average customs tax on imports of investment goods is estimated-as 1.06 percent.
Incorporation of the investment incentives into the model is achieved by considering four incentives: (a) investment allowance; (b) value added tax (VAT) support in purchase of machinery and equipment; (c) tax, duty and charge exemption; and (d) customs duty exemption. We abstract from consid-eration of energy subsidy, land allocation and credit allocation from the fund. The government has allocated relatively limited resources to fund credit and land allocation is important for specific projects such as tourism.
The investment incentive allowance comprises a certain percentage of the cost of machinery, equipment, instruments, building, and other depreciable capital assets, which is deducted from the company’s taxable income. The investment allowance applies to investments that are realized in sectors that carry special importance, sectors with priority in development, and organized industrial regions at a rate of 100 percent, and at a rate of 200 percent on indus-trial investments that exceed the TL equivalent of US$ 250 million and meet at least two of the following requirements: (i) require high technology, (ii) have a high value added, (iii) increase tax earnings and employment, and (iv)
enable the country to compete internationally. The VAT support exempts the
delivery of machinery and equipment from the value added tax of 15 percent. In the case of projects without lIC, the importer has to pay the VAT. In that case, the importer can claim the VAT back but only gradually, in equal instal-ments oVer three years without any adjustment for foregone interest or even inflationary erosion. Given the VAT rate of 15 percent and annual payments of 5 units per annum the subsidy provided to 11C holder through VAT support can be calculated as:
_ 5 _ 5 _ 5
(1+r) (1+r)2 (1+r)3
15
percent, where r denOtes the rate of interest. The tax, duty, and charge exemp— tion is an incentive for exporters. If an investor undertakes to generate a cer-tain amount of foreign exchange through export, the loans extended for this
export will be exempt from taxes, duties and fees amounting to 4.4 percent of the loan extended. Finally, through the customs duty exemption, the import of the machinery and equipment listed in connection with an Investment Encouragement Certificate is exempted from customs tax and from the mass housing fund.
Table 9.1: Effect of Investment Incentives on the Rate of Return and METR, 1999
Rate of Return I METR
Debt/Equity=0 Debt/Equity=1 Debt/Equity:o Debt/Equity=l
Base Case 10.3 10.1 -
-VAT Support 12.5 12.6 21.36 24.75
Investment Allowance
100 percent 12.2 12.1 18.45 19.80
200 percent 12.6 12.1 22.33 19.80
Tax, Duty & Charge Exemption 10.3 10.4 0.00 2.97
Customs Duty Exemption 10.4 10.2 0.97 0.99
Total Effect of all Incentives 15.1 15.8 46.60 56.44
Source: Author Is calculations.
Table 9.1 shows the effect of investment incentives on the rate of return and METR under all equity and half equity-half debt). The table reveals that the VAT support results in an increase of the rate of return from 10.3 to 12.5 under all equity and from 10.1 to 12.6 percent under half equity-half debt financing. An investment allowance of 100 percent increases the rate of return from 10.3 percent to 12.2 percent under all equity financing and from 10.1 to 12.1
per-cent under half equity-half debt financing. The 200 perper-cent investment
allowance increases the rate of return from 10.3 to 12.6 under all equity
financ-ing, and from 10.1 to 12.1 percent under half equity-half debt financing. The tax, duty, and charge exemption and customs duty exemption have minor effects. The combined effect of the investment incentives under 100 percent investment allowance increases the rate of return from 10.3 to 15.1 percent under all equity financing, and from 10.1 percent to 15.8 percent under half equity-half debt financing. These results, when expressed in terms of METR indicate, that under equity financing, METR increases by 0.97 percent under customs duty exemption, 18.45 percent under 100 percent investment allowance and 21.36 percent under VAT support. Similarly, under half
equity-half debt financing, METR increases by 0.99 percent under customs duty
exemption, 2.97 percent under tax, duty, and charge exemption, 19.8 percent under 100 percent investment allowance, and 24.75 percent under VAT
sup-port. The table reveals that the subsidy rate of investment incentives equals 4.8
percent under all equity finance, and 5.7 percent under half equity-half debt
finance. Assuming that 50 percent of all investments in Turkey are equity financed and 50 percent half equity-half debt financed, the average subsidy rate is calculated as 5.25 percent.
Table 9.2: Sectoral Classification of Investment Incentive Certificates, 1999
Fixed Fixed
Number of Investment Investment Employment
Certificates (Billion TL) (Million S) (Person)
Agriculture Vegetables 21 5,290 12.67 536 Animal Husbandry 81 87,392 209.28 3,950 Aquacultural Products 7 1,907 4.57 208 Forestry Mining 93 55,121 132.00 2,758 Manufacturing
Food & Beverages 267 176,703 423.16 12,289
Textiles & Clothing 242 211,450 506.37 22,983
Forestry Products 66 65,511 156.88 5,641
Paper 24 98,291 235.38 1,319
Leather & Leather Product510 4,054 9.71 574
Rubber 108 61,328 146.86 2,766
Chemicals 73 179,421 429.67 3,312
Glassware 23 21,734 52.05 2,086
Iron & Steel 39 65,034 155.74 1,209
Non-ferrous Metals 26 23,513 56.31 895 Vehicles 129 144,523 346.10 5,500 Metallic Goods 183 182,772 437.69 9,123 Measuring Devices 21 29,279 70.12 1,089 Machinery 77 281,838 674.93 7,623 Electrical Machinery 34 36,927 88.43 2,170 Electronics 32 46,694 111.82 1,535 Cement 102 230,888 552.92 4,339
Clay & Cement Products 68 46,212 110.67 2,735
Construction 12 10,181 24.38 360 Ceramics 14 47,029 112.62 1,137 Other 51 62,393 149.42 2,139 Energy Energy 48 202,100 483.98 534 Services Transportation 301 1,065,941 2,552.66 22,931 Tourism 199 298,772 715.48 19,378 Trade 116 165,878 397.24 11,525 Education 48 75,950 181.88 5,586 Health 155 190,854 457.05 10,317 Other 297 489,002 1,171.04 24,133 Total 2,967 4,663,982 11,169.05 192,680
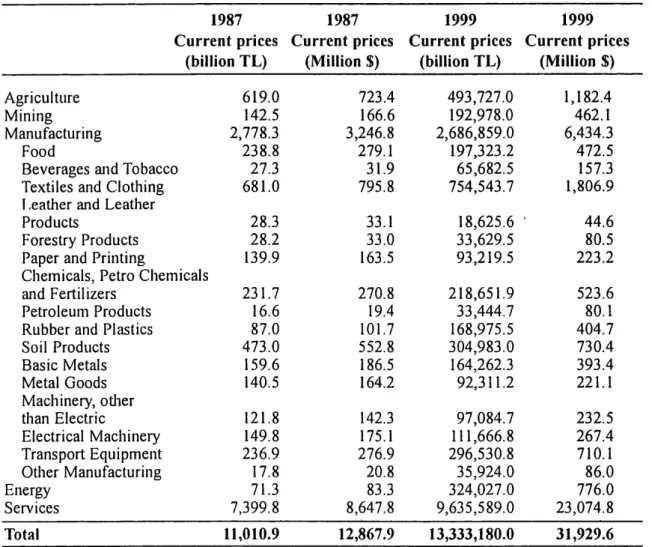
Table 9.3: Gross Fixed Investment of the Private Sector during
1987 and 1999
1987 1987 1999 1999
Current prices Current prices Current prices Current prices
(billion TL) (Million $) (billion TL) (Million S)
Agriculture 619.0 723.4 493,727.0 1,182.4
Mining 142.5 166.6 192,978.0 462.1
Manufacturing 2,778.3 3,246.8 2,686,8590 6,434.3
Food 238.8 279.1 l97,323.2 472.5
Beverages and Tobacco 27.3 31.9 65,6825 157.3
Textiles and Clothing 681.0 795.8 754,543.7 1,806.9
Leather and Leather
Products 28.3 33.1 18,6256 ' 44.6
Forestry Products 28.2 33.0 33,6295 80.5
Paper and Printing 139.9 163.5 93,2195 223.2
Chemicals, Petro Chemicals
and Fertilizers 231.7 270.8 218,6519 523.6
Petroleum Products 16.6 19.4 33,4447 80.1
Rubber and Plastics 87.0 101.7 168,9755 404.7
Soil Products 473.0 552.8 304,9830 730.4 Basic Metals 159.6 186.5 164,262.3 393.4 Metal Goods 140.5 164.2 92,3112 221.1 Machinery, other than Electric 121.8 142.3 97,0847 232.5 Electrical Machinery 149.8 175.1 111,666.8 267.4 Transport Equipment 236.9 276.9 296,5308 710.1 Other Manufacturing 17.8 20.8 35,9240 86.0 Energy 71.3 83.3 324,027.0 776.0 Services 7,399.8 8,647.8 9,635,589.0 23,0748 Total 11,010.9 12,867.9 l3,333,180.0 31,929.6
Source: “Annual Program, " State Planning Organization, various issues:
Table 9.2 shows sectoral classification of investment incentives issued by the Treasury Undersecretariat during 1999. The table reveals that during 1999, the sectors that granted most of the investment incentives were the transportation sector with a share of 22.9 percent, other services with 10.5 percent, tourism with 6.4 percent, and machinery with six percent of total value of investment
incentives. Table 9.3 shows the gross fixed investment expenditures of the
pri-vate sector during 1999. From the table, it follows that during 1999 the services, textiles and clothing, agriculture, energy, and soil products sectors had the
high-est shares in total private sector fixed investment expenditures. From column
eight of Table 9.7, showing the shares of 11C in gross fixed investment
expendi-tures of the private sector, it follows that 11C has fallen short of the actual invest-ment expenditures in some of the sectors. In these cases, we have multiplied the subsidy rate of 5.25 percent with the 11C value. Whenever the share was greater
than unity we multiplied the subsidy rate of 5.25 percent with the fixed
sector is then obtained by dividing the subsidy thus obtained by the value of investment expenditures in that sector. Weighing the sectoral subsidy rates by the shares of actual sectoral investment expenditures in total investment expen-ditures we obtained an average subsidy rate of 1.67 percent for the economy. 4.2 Base Solution and Incentives during the year I 987
The project considered is the same project analysed above. It is an investment in land, buildings, machinery and equipment and vehicles with shares 0L.= 25, 0L2: 20.83, a3= 54.17, and (X4: zero percent. We assume that the economic depreciation rate of buildings, machinery, and equipment and vehicles equals 3.6, 12.5 and 30 percent respectively, and that the straight line depreciation rates equal the economic depreciation rates for the assets considered. The pro-ject is assumed to generate a real before—tax rate of return of 20 percent and the
operating period of the project is supposed to be thirty years.
During the year 1987, the corporate income tax rate was 46 percent. Since there were supplementary levies up to 7 percent in addition to of the basic tax, the overall tax rate amounted to 46 x 1.07 = 49.2 percent. During 1987, depre-ciation allowances were based on historical costs, adjusted to reflect the rate of inflation minus 10 percent. At that time, nominal interest payments were deductible from taxable income, with no adjustment for inflation. Deduction, for the cost of goods sold from inventories were based on historical costs, with no adjustment for inflation. Capital gains were taxed at the corporation income tax rate. In the model, the inflation rate is taken as the average 1986-1988 WPI inflation rate of 51.6 percent.
The investment incentives are incorporated into the model through nine incentives: (a) investment allowance; (b) postponement of the value added tax (VAT); (c) cross subsidisation scheme operated under the Export Encouragement Fund; (d) tax, duty and charge exemption; (e) customs duty exemption; (f) pay-ments from the Resource Utilisation Support Fund; (g) low interest investment
credits; (h) accelerated depreciation; and (i) thefinancing fund.
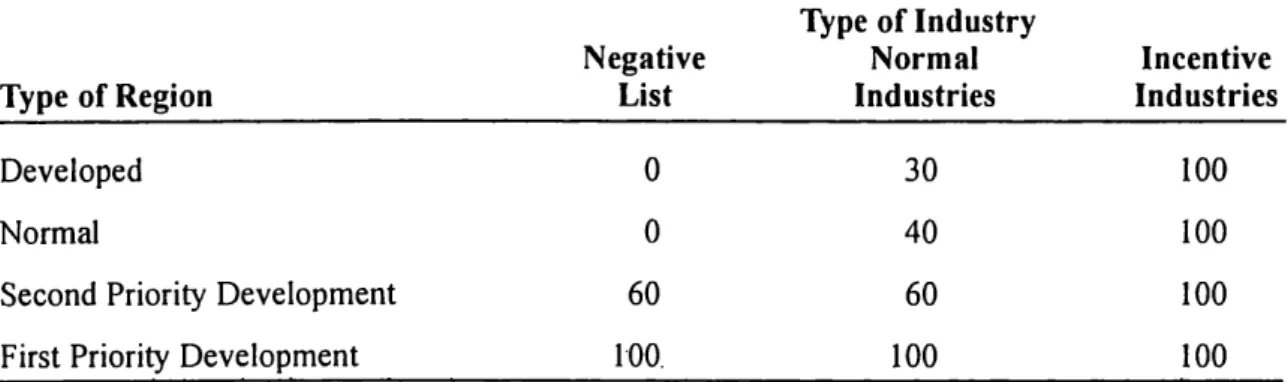
Table 9.4 shows the regional and sectoral differentiation of investment allowances. Investment incentives ranged from 30 percent to 100 percent depending on the region and sector. Regardless of location 100 percent initial allowance was granted for incentive industries. In 1987 these industries com-prised energy, electronics, communications, medical equipment, most agricul-tural and related investments, tourism, and education. Projects on the negative list were not eligible for incentives, unless the investment took place in prior-ity development regions. Items on the negative list included iron and steel works, tire manufacturing, fertilizer plants, certain chemical plants, the auto-mobile industry, and some light industries and service facilities. Activities that were not incentive industries and that do not appear on the negative list were called normal industries.
Table 9.4: Investment Incentive Allowances, 1987
Type of Industry
Negative Normal Incentive
Type of Region List Industries Industries
Developed O 30 100
Normal 0 40 100
Second Priority Development 60 60 100
First Priority Development 100. 100 100
Source: World Bank (1987) and Duran (I998).
The VAT accruing in the importation of investment goods was postponed until the date when an actual reduction of the tax was possible. This incentive was an exemption rather than postponement applicable for investments with IIC. There was no VAT postponement for investment goods acquired domes-tically. In the case of projects without IIC, the importer had to pay the VAT. In that case, the importer could claim the VAT back, but only in equal instal-ments over three years without any adjustment for foregone interest or even inflationary erosion. During 1987, the VAT rate was 12 percent and. annual payments amounted to four units.
Investment could take place in machinery and equipment that was either produced domestically or imported. Investment in domestic machinery and equipment received a '15 percent credit from the Export Encouragement Fund prior to October 1986. At that time, the subsidy rate was raised to 20 percent.
On the other hand, a five percent tax in addition to import duty was levied on
imported machinery and equipment.
Following Karakoyunlu (1987), we assume as before that the tax, duty,
and charge associated with
financial transactions amounts to 4.4 percent of
the loan extended. We assume that 70 percent of machinery and equipment is imported and that the average customs tax on imports of investment goods during 1987 was 52 percent (Karakoyunlu, 1987). Under the tax, duty and
charge exemption and customs duty exemption the firm with IIC does not pay
either of these taxes.
The sixth investment incentive available during 1987 was in the form of a direct payment from the Resource Utilisation Support Fund (RUSF). Subsidy
rate was 20 percent of realised investment in first priority development regions
and 15 percent in second priority development regions, without regard to the size of investment. If investment was at least one billion Turkish Liras, the sub-sidy was seven percent in normal regions and four percent in developed regions'. In order to alleviate the effect of high interest on investment borrowing, investment credits were made available on concessional rates. The
govem-ment had devised a scheme under which the interest rate on loans of foreign origin, such as IFC loans, was fixed at about 32 percent while the average rate of inflation during 1986—88 was 51.6 percent. Actual costs of loans provided by the Turkish Industrial Development Bank amounted to 38 percent. In
addi-tion, the firms could benefit from the rediscount opportunities of the Central
Bank. The interest rate was 40 percent. Taking the average credit cost of low interest credits as 38 percent the and interest rate on normal credits with no IIC as 85 percent (Karakoyunlu, 1987) the subsidy provided through bank credits is estimated as 47 percent.
With regard to depreciation allowances, we note that firms are allowed to depreciate assets faster than economic depreciation. This is equivalent to providing a subsidy to the firm. This case is analyzed by assuming the depreciation rate for buildings to equal five percent, and for machinery and equipment 25 percent.
The final investment incentive scheme refers to a financing fund. Under
this scheme, corporations can set aside a percentage of taxable income for
future investments. The amount set aside at the discretion of the firm is
deducted from its taxable income and deposited in an interest bearing account with the Central Bank. It can be withdrawn at any time with authorisation from the Treasury Undersecretariat and used for investment. When the invest-ment is completed, the amount becomes taxable. This incentive thus postpones the corporate tax payments.
In the base case we assume that no investment incentives are provided to
the firm. The firm has to pay all its taxes, and no credits are granted at
con-cessional rates. Depreciation allowances are based on historical costs, adjust-ed to reflect the rate of inflation minus 10 percent.
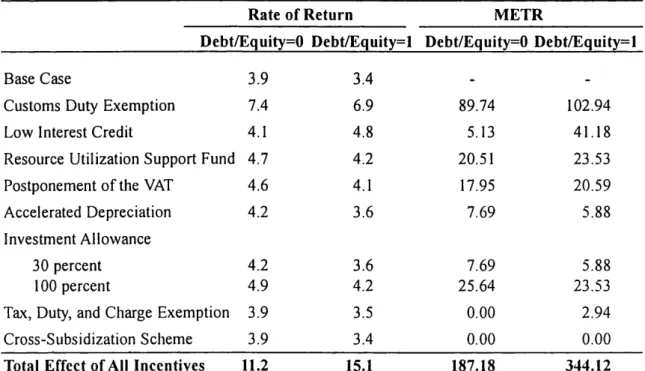
Table 9.5 shows the effect of investment incentives on the rate of return
and METR under all equity and half equity-half debt financing structures. The
table reveals that the customs duty exemption increases the rate of return from
3.9 percent to 7.4 percent under all equity financing, and from 3.4 to 6.9
per-cent under half equity-half debt financing. Low interest credit increases the
rate of return from 3.9 percent to 4.1 percent under all equity financing, and
from 3.4 to 4.8 percent under half equity-half debt financing. The RUSF
sub-sidy increases the rate of return from 3.9 percent to 4.7 percent under all
equi-ty financing, and from 3.4 to 4.2 under half equity-half debt financing.
Postponement of the VAT results in an increase of the rate of return from 3.9 to 4.6 percent under all equity and from 3.4 to 4.1 percent under half
equity-half debt financing.
Accelerated depreciation increases the rate of return from 3.9 percent to
- 4.2 percent under all equity financing and from 3.4 percent to 3.6 percent
the rate of return from 3.9 percent to 4.2 percent under all equity financing and from 3.4 to 3.6 percent under half equity-half debt financing. The 100
percent investment allowance increases the rate of return to 4.9 percent under
all equity financing, and to 4.2 percent under half equity-half debt financing.
The tax, duty and charge exemption and cross subsidisation scheme have minor effects. The combined effect of the investment incentives under the 30 percent investment allowance increases the rate of return from 3.9 to 10.8 per-cent under all equity financing, and from 3.4 perper-cent to 14.3 perper-cent under half equity-half debt financing.
These results, when expressed in terms of METR, indicate that under
equi-ty financing, METR increases by zero percent under the cross-subsidisation
scheme and the tax, duty, and charge exemption, 7.69 percent under 30 per-cent investment allowance and accelerated depreciation, 17.95 perper-cent under postponement of the VAT, 20.51 percent under RUSF subsidy, 5.13 percent under low interest credit, and 89.74 percent under customs duty exemption.
Similarly, under half equity-half debt financing, METR increases by zero
per-cent under the cross-subsidisation scheme, 2.94 perper-cent under tax, duty and charge exemption, 5.88 percent under 30 percent investment allowance and accelerated depreciation, 20.59 percent under postponement of the VAT, 23.53 percent under RUSF subsidy, 41.18 percent under low interest credit, and
102.94 percent under customs duty exemption.
Table 9.5: Effects of Investment Incentives on the Rate of
Return and METR, 1987
Rate of Return METR
Debt/Equity=0 Debt/Equity=l Debt/Equity=0 Debt/Equity=1
Base Case 3.9 3.4 -
-Customs Duty Exemption 7.4 6.9 89.74 102.94
Low Interest Credit 4.1 4.8 5.13 41.18
Resource Utilization Support Fund 4.7 4.2 20.51 23.53
Postponement ofthe VAT 4.6 4.1 17.95 20.59
Accelerated Depreciation 4.2 3.6 7.69 5.88
Investment Allowance
30 percent 4.2 3.6 7.69 5.88
100 percent 4.9 4.2 25.64 23.53
Tax, Duty, and Charge Exemption 3.9 3.5 0.00 2.94
Cross-Subsidization Scheme 3.9 3.4 0.00 0.00
Total Effect ofAll Incentives 11.2 15.1 187.18 344.12
Table 9.6: Sectoral Classification of Investment Incentive
Certificates, 1987
Fixed Fixed
Number of Investment Investment Employment
Certificates 1987 1987 1987
1987 (Million TL) (Million S) (Person)
Agriculture Vegetables 18 14,543 17.00 373 Animal Husbandry 167 191,016 223.23 3,750 Aquacultural Products 14 7,418 8.67 352 Forestry 3 3,699 4.32 6 Mining 160 270,763 316.43 10,440 Manufacturing
Food & Beverages 218 226,867 265.13 8,763
Textiles & Clothing 370 1,051,560 1,228.90 22,214
Forestry Products 62 39,767 46.47 2,231 Paper 14 31,534 36.85 633 Leather & Leather Products 60 102,196 119.43 3,522 Rubber 41 98,297 114.87 1,622 Chemicals 55 278,514 325.48 2,842 Glassware 19 55,070 64.36 1,257
Iron & Steel 26 47,303 55.28 1,475
Non-ferrous Metals 16 27,408 32.03 829 Vehicles 65 733,631 857.36 2,538 Metallic Goods 68 131,130 153.24 5,164 Measuring Devices 18 25,172 29.42 1,138 Machinery 35 28,028 32.75 1,801 Electrical Machinery 20 13,177 15.40 648 Electronics 19 203,463 237.78 1,140 Cement 130 600,064 701.26 5,81 1
Clay & Cement
Products 161 159,592 186.51 7,754 Construction 97 95,552 111.67 13,010 Ceramics 6 52,217 61.02 416 Others 53 64,557 75.44 1,583 Energy _ Energy 15 598,186 699.07 4,913 Services Transportation 285 1,705,998 1,993.71 20,534 Tourism 288 4,016,737 4,694.15 22,522 Trade 90 637,051 744.49 5,546 Education 25 31,176 36.43 1,652 Health 46 86,382 100.95 2,271 Others 164 260,056 . 303 .91 3,249 Total 2,828 11,888,124 13,893.03 161,999
Togan .835 .323; .zouafitums MEEEE 25m. :.EEMEK BEEN. 6.950% a: 3:32 9mm 32.83. 9.3332 Es 32.— 32: $8.: .38.: Bob 3; $852 58 0.8253 0.33d 2 .m 0.9% o. a v.23 Q82 323% Rd 36.2 «.8 251% 3868 8w 3 2mm 3% n: 92m man 933 ~m 35. a 38.2 93 m: 3% as w: @3825: 350 on “.32 2:. 3.3.3. $2.08 on.» _. a :8 95 3mm “Seesaw comment. 85 <83 m: o. $0.8 $8._ : 93 we 3: we _ N was 9:582 .8385 man $86 3mm 38% 38.8 no.“ 3 9mm SN 32 23583 3:335 3:28: man now? 32 35m: 238 .3 h: n? ‘ :2 3: 9263 E22 BEBE m3 SS6 3m 0.2.3» 3362 :4“ 3 ”.3 S; can. 8:335 32: 23m mam 38.2 S: c.3562 @838 23 fig 28 38 3.”: .80 Ea E3353? 2883 9.6293 .mguflfioha Tug—m5 2:30Euco: mo 8303—353)— a._ 2:3 mom 32.8 3232 8.” E 3: 28 o: 3:33 Ba spasm chm veto N. E o. 5%: 0.832 23 EN 3: 35 33 22605 Eng—chum Ea 63252.5 chun— .mEEEoLU 3m Q33 «.8. o. 535 25.8 .3 3 3m m.a m 32 ”5:233 Ba 253352 no comma .8m .326t .9555 3% 935 32 33.3... 38.2 8.” 3 3: 23 gm 235a 3622: £82.93 coo? can @003 be 238352 v2 38 EN 3.86 923: 8.” 3 38 32 SN 2885 552: Ba 3:33 :1 22.: 3a 0.83 a 2%.v 23 0.8 3.2 o.a 3.. 9:6 @266 23 3:33.. mom 325 NS 0.85.: 52.q a? mom N3 32 $8 8252 Ba gags; a8. .0 228352 3.». 32.2: v? @338.” 93.33 2; 23 no: 38;. QRN E58252 of 33d 3” o. 31% 3232 93 Z. 32 no: 33 352 8.. m8? 2: oawmg ENE? 2 .m we own Ea 920 253:? 82 3h SEE as: 3; SH .353 .23: 3b .555 .23: 52 SH 5:5 .53 exp 3h SEE .5259 .553
.58 3258.»:— muuauEtoU Eon—$3:— .mEmnaw ouam 2.258.»:— muuwuuuuuu E2532: hEmnsm 2am
hfimmn flm ho 05—5? Uommu— 032.32..— fioumh mwohU hams—um no 035? U32”— mwOLU 032—00.: team 30t Ens—€32 39.0 E Q: Eon—~32: 530w 3.91m E55282 355...— E U: E05335 35mm 3.3:...— uo 9:25 .3 9:25 326
Table 9.6 shows sectoral classification of investment incentives issued by the Treasury Undersecretariat during 1987. The table reveals that the sectors that were granted most of the investment incentives were the tourism sector, with a share of 33.8 percent, the transportation sector, with a share of 14.4 per-cent, the textiles and clOthing sector, with a share of 8.8 perper-cent, and vehicles, with a share of 6.2 percent. We assume that 50 percent of all investments are all equity debt financed and 50 percent half equity-half debt financed. The average subsidy rate is then calculated from Table 9.5 as 8.9 percent. Table 9.3 shows the gross fixed investment expenditures of the private sector during 1987. From the table it follows that during 1987 services, textiles and clothing, agriculture, soil products, and food sectors had the highest shares in total
pri-vate sector fixed investment expenditures. From the third column of Table 9.7,
showing the shares of IIC in gross fixed investment expenditures of the private
sector, it follows that lIC has fallen short of the actual investment expenditures in some of the sectors. In those cases, we have multiplied the subsidy rate of 8.9 percent with the IIC value. Whenever the share Was greater than unity, we
multiplied the subsidy rate of 8.9 percent with the fixed investment
expendi-ture value of the private sector. The average subsidy rate for the sector is then obtained by dividing the subsidy thus obtained by the value of investment expenditures in that sector. Weighting the sectoral subsidy rates by the shares of actual sectoral investment expenditures in total investment expenditures we obtained an average subsidy rate of 7.77 percent for the economy.
4. Profit Margins and Concentration Ratios
When discussing competitiveness in Chapter 1 the concept was narrowed to
countries’ ability to sell their products in world markets and competitiveness
was expressed quantitatively by the real exchange rate, given by:
Ep‘_C‘E(1+X)
p
C(1+A)
where C = (w / (y/L)) denotes the unit labor cost in the home country expressed in domestic currency units, C* = (w* / (y*/L*)) the unit labor cost in the foreign country expressed in foreign currency units, it the profit margin in the home country, N“ the profit margin in the rest of the world and E the exchange rate.
Concentrating on the profit margin we use the relation:
_ (Value Added — Labor Cost) — Labor Cost
for the determination of the profit margin. In the empirical determination of the profit margin in Turkey, we use the data obtained from the “Annual Manufacturing Industry Statistics” of the State Institute of Statistics for the period 1980—97. As the benchmark, country we consider Belgium, which is an open small economy. For Belgium, we use the OECD STAN Database.
Table 9.8: Average Profit Margins in Turkey and Belgium, 1992-94
Turkey Belgium
31 Food & Beverages & Tobacco
311.2 Food 323.69 173.36
313 Beveragc Industries 731.53 89.18
314 Tobacco 313.74 76.98
32 Textiles, Apparel & Leather
321 Textiles 341.04 68.04
322 Apparel, except Footwear 469.86 44.06
323 Leather and Products of Leather, except Footwear 341.69 -29.25
324 Footwear 217.33 -61.71
33 Wood Products
331 Wood and Wood Cork Products, except Furniture 203.26 -28.79
332 Furniture and Fixture 404.47 202.88
34 Paper & Paper Products
341 Paper and Paper Products 234.17 35.45
342 Printing and Publishing 620.60 31.21
35 Chemical Products
351 Industrial Chemicals 375.99 45.93
352 Other Chemical Products 527.76 15.49
3522 Manufacture of Drugs and Medicines 499.49 15.49
352X Chemical Products. Nec 558.24 15.49
353 Petroleum Refineries 4,440.20 79.05
354 Misc. Products of Petroleum and Coal 577.34 119.37
355 Rubber Products 322.60 42.87
356 Plastic Products 493.54 153.00
36 Non-Metallic Minerals
361 Pottery, China and Earthenwear 544.21 34.51
362 Glass and Glass Products 310.10 67.49
369 Other Non-Metallic Mineral Products 471.20 35.25
37 Basic Metals
371 Iron and Steel Basic Industry 245.21 26.15
372 Non-Ferrous Metal Basic Industries 220.90 5.89
38 Fabricated Metal
381 Fabricated Metal Products 360.36 25.15
382 Machinery except Electrical 352.96 101.78
383 Electrical Machinery 395.27 22.52
384 Transport Equipment 305.75 13.54
385 Professional, Scientific Measuring, & _
Controlling Equipment 415.69 63.42
39 Other Manufacturing
39 Other Manufacturing Industries 327.46 157.42
3 Manufacturing Industry 416.51 57.33
Table 9.8 shows the profit margins for 3-digit ISIC sectors for Turkey and Belgium. The table reveals that the profit margins in Turkey are much higher than the profit margins in Belgium. Except for the sectors of footwear, wood and wood cork products, and leather and leather products, where the Belgium’s com-pensation of employees exceeds the value added in the sector, the profit margins in all other sectors in Turkey exceed those in Belgium. The average profit mar-gin in Turkey relative to that in Belgium, [(1+?t)/(1+7t’)], is highest in the sec-tors of petroleum refineries (ISIC 353), non-ferrous metal basic industries (ISIC 372), and other chemical products (ISIC 352). On the other, hand the lowest average profit margins in Turkey relative to those in Belgium, [(1+}I)/(1+?»’)],
occur in the sectors of food (ISIC 311+312), furniture and fixtures (ISIC 332),
and other manufacturing industries (ISIC 39). Figure 9.1 plots the average value of the profit margin for the manufacturing industry over the period 1980-1996. The result is striking, as the average profit margin in Turkey is much higher than the profit margin in Belgium over the period 1980-1996. The results indicate the lack of competition in the Turkish manufacturing sector.
To emphasize the argument about the lack of competition in the Turkish manufacturing sector, we consider in Table 9.9 the 4-firm concentration ratios in the manufacturing sector. The table reveals that the concentration ratios are relatively high and that the most concentrated sectors are petroleum refineries (ISIC 353), rubber products (ISIC 355), and tobacco (ISIC 314). On the other hand, the most competitive sectors are apparel (ISIC 322), textiles (ISIC 321), and fabricated metal products (ISIC 381).
Figure 9.1: Profit Margin in Manufacturing Industry
600 I a l \ I’ ‘ .l I‘ I \ I \ u \ 1 "’ ’ \ I S '0 ’ \ I E I \ ’ 00 I r: 400 - I ‘\ I 'I': I a I \ I o I \ 1’ JP. / \ I =1 r, \ I I: a to 300 ‘ ’r "' -E I C I -- l .E " 95° 200 — E H L: O I... ‘L 100 — 0 1 I I I I I I I I I f I I I I 80 82 84 86 88 90 92 94 96 Time — BELGIUM - — — 'l‘URKliY
Togan .SQQQ Gothaghko 25.5.5 23m. ..0.0§0m. modm oo.wm ow.mm mmdm 36m OVEN mv 85305 wctfio flscmE 850 am wctaoflsc flz 0050 mm 3.3 madm £65 3.3 2.0m _m.mm mmgv EufimEum 92:05:00 000 .wESmmoE oEEEom 40.0233o mmm 5.9” wwov mmdv madm :80 3.00 3.0.0 EoEmmscm 0.8355. 0mm 00.3.. mm._m . :uom wmdm 2.5m om.mm film 3050002 083005 mwm dm 3.3 0040.0 00.3 _N.ov 0N: mmdv 085005 00088 E05502 mwm mix: 00.: 2.3 www— mZN 2.2 2.3 £0000E 0302 0200:00m 5m 502 020253 mm 3.3 342. mm: mvdm 3.? $00 8.3 300305 055 0302 mnotuméoz mum mmém mm.mm N52” 3.5 3.3 cmém Euwm b02005 2mmm EBm 0EN :0: Km . 2302 0745 mm 03: mm.m_ mmdm mix. mm.m_ whom amdm 80:00.5 3.552 02.902002 550 00m 3.0m 09$ 3.0m masm omfim $00 5.3 30:00E 305 0:0 $20 mom mmdm 00.3 00? 31mm :wm $40 8.00 Seasontmm 000 .0500 .bouom Gm 28052 05802002 cm 3.5 mhgm 3.9 mvdm No.3 Sdm mfmm 300005 0:35 0mm 00.? 3.? 3w? omdn wads 9.3. 3.3 300005 530% mmm 00mm. mode N000 Same Swm NW? Nméw :80 0:0 Ego—000m 90 300005 .022 0mm 8.3 :.mm owfim No.3 mm.wm ma fia mvsm motocmum 5:20bom mmm mmwfi bmdm omNN mvNN No.3 om.NN ofiom 300005 080026 550 Nmm mv 3.8 mm.wm 20¢ 32%» wvdm mm.mm 28:02.5 3.0305 Em 3000000 1.2525 mm omfim imam 5.3 afimo Nowm no.3 mmgv mcEmzpsm 0EN @555 min. B. fim hvém me. Q VmNN mw fim awdm 3.2 300005 500m 0:0 503 3m £0000E 500m 0% 009$ .mm 00.9. 8.00 mm. 3 ofiwm mm.wm mmdv mwdv 235m 0:0 oStFSm Nmm mm.~m modm wwom mnNm modm 3.9 eqf 82:55 “0088 £00005 0:00 0003 0:0 0003 5m $00005 0003 mm gem mtmm ovdm 006m R.Nm bmwm 006m 52308 vmm 56m vodm wvdm Sow 36m :0N 220m hmoéoom 3005 .5534 wo £00005 000 005004 mmm $0 N3 20 :0 86 $6 Ed 52380 3005 4233. mm 51. 5N5 mus mow vms $.w ww.m 33o Km 005004 0% _0.500< .moExoh NM 3.8 do 003 Kdm $60 00.3 36m 00038. E m mmsm .0m gdm mogm 5.1m wadm 3.2 85305 0w80>0m 2 m Nmfm 91m mwém mm._m oodm omdm NmAm 000» m. g R 00030.“. 0%. mowflgom 000 m _m 330
5. Conclusion
Consideration of the investment incentive system and corporate tax structure reveals that Turkey has used the incentive system as one of the main tools of industrial policy. The purpose of the scheme was to increase investment and overcome barriers to entry into industry imposed by capital market imperfec-tions. But investment incentives in Turkey have also been a barrier to
competi-tion. Through the incentive system, established firms obtained cost advantages
which helped them to consolidate their market position. Competing with scarce fiscal resources, entrants have been at a disadvantage relative to well-informed incumbents. The credit incentives, that were supposed to promote entry have often turned into instruments that reinforce the position of large incumbents. Furthermore, with its large share in the banking system the government has also directly controlled the allocation of credit, and credit from public banks has often been extended on the basis of political considerations. It is also
empha-sized that established firms benefit from investment incentive schemes, such as
investment allowances, while the new entrants do not, since the latter, in order to benefit from investment allowances have to first show positive profits in their income statements. Furthermore, the Undersecretariat for Treasury asks
the firms applying for 11C to provide all financial information about the project.
Firms in the informal sector prefer not to make use of any investment incentives rather than provide the required information to the Undersecretariat. Finally, it should be emphasised that SMEs in particular finance a large part of their investment expenditures from their own sources. Use of bank credit is rather
limited for investment purposes. ‘
The investment incentive scheme has been used at a time when there was
no specific competition legislation or competition policy enforced in Turkey.
To promote competition within the country Turkey eliminated quantitative restrictions in foreign trade and substantially decreased the levels of nominal and effective protection rates during the 19805. With the formation of the cus-toms union with the EU, all tariff and non-tariff barriers on imports of indus-trial commodities from EU members have been completely eliminated. On the export side, Turkey has used various export incentive measures during 19805. Lately, the nominal and effective subsidy rates have been reduced substantial— ly. The reduction of nominal and effective proteCtion and subsidy rates, how-ever, was not sufficient to ensure proper functioning of the markets. During the 19503 a similar consideration in Europe led to the adoption of competition policies, the objective of which was to ensure effective competition, to allocate resources efficiently, and to create the best possible climate for fostering inno-vation and technical progress. In June 1989, Turkey adopted the law “On the Prevention of Unfair Competition in Importation” containing both antidump-ing and antisubsidy provisions. Turkey adopted its competition policy durantidump-ing
December 1994 with the "Law on the Protection of Competition". The key provisions of competition law are based on EU competition law: agreements, decisions and concerted practices in constraint of competition, abuse of dom-inant position, and mergers and acquisitions. The statute contains not only rules concerning forbidden practices and provisions against the abuse of a dominant market position, but also the regulations of acquisitions and merg-ers. The Competition Authority, responsible for the implementation and enforcement of the prohibitions set out in the law, started operating in October 1997. Turkey’s Competition Board has been granted substantial powers, including opening investigations and imposing penalties. So far, the Competition Board has granted block exemptions for certain categories of agreements and published communiques on mergers and acquisitions. Actions against restrictive business practices havejust begun.
As a result of the policies pursued by Turkey, there was a lack of competi-tion in the country, as revealed by the high profit margins and concentracompeti-tion ratios. Another factor affecting the conditions of competition in the country has been the public enterprise policy pursued by the government. This policy goes back to the 19303. At that time the government had formulated an ideological position called ‘etatism,’ defined as intervention by the state directing indus-trial activity in the interest of national development. During the 1930s etatist
policies were implemented within the frameworks of five-year plans, which
assigned a leading role to the public sector in saving generation and in carry-ing out key entrepreneurial functions in industrial development. As a result of the etatist and import-substitution policies followed until the end of the 1970s, the share of state-owned enterprises in total value added amounted to about 11.5 percent ofthe economy in 1985, and 10.6 percent in 1990. In the manu-facturing sector, the state-owned enterprises were heavily concentrated on basic metals, chemicals, petrochemicals, fertilizers, newsprint, paper, oil refineries, cement, and textile production. Table 9.10 shows the public sector’s share in value added. The table reveals that by 1997, the public sector’s share is highest in the sectors of petroleum refineries, tobacco, industrial chemicals, iron and steel basic industries, and non-ferrous metal basic industries. Since 1983 privatization has become a prominent part of the Turkish structural adjustment program. But because of various difficulties privatization could not gain momentum until recently. In sectors where state economic enterprises are operating, the concentration ratios turn out to be high, as those enterprises are themselves very large.
The above considerations reveal that, with termination of the generous investment incentive schemes, privatization, and effective implementation of competition policies, concentration ratios together with the profit margins will decline. As a result, the competitiveness of Turkish industries will increase.
Table 9.10: Share of Public Sector in Value Added
1994 1995 1996 1997
31 Food Beverages & Tobacco
311 Food Manufacturing 22.77 12.61 11.05 5.71
312 Manufacture of food products
not elsewhere classified 11.88 14.17 12.42 15.69
313 Beverage Industries 34.61 29.63 12.91 25.19
314 Tobacco 43.82 57.04 43.91 47.49
32 Textiles, Apparel & Leather
321 Textiles .349 2.95 5.39 2.97
322 Apparel, except Footwear 2.35 2.11 0.15 0.71
323 Leather and Leather Products
except Footwear 10.81 8.99 0.00 0.00
324 Footwear 14.46 9.86 0.00 14.41
33 Wood Products
331 Wood and Wood Cork
Products, except Furniture 19.66 9.10 9.49 6.59 332 Furniture and Fixture 0.09 0.01 0.02 0.07 34 Paper, Paper Products
341 Paper and Paper Products 22.15 21.92 19.51 11.26
342 Printing and Publishing 5.96 7.36 5.01 8.11
35 Chemical Products
351 Industrial Chemicals 46.83 54.10 45.97 44.04
352 Other Chemical Products 2.03 1.41 2.15 2.05
353 Petroleum Refineries 100.00 100.00 100.00 100.00
354 Misc. Products of Petroleum and Coal 1.83 7.30 2.45
355 Rubber Products 1.42 1.28 1.14 1.56
356 Plastic Products 3.40 1.66 6.89 0.00
36 Non-Metallic Minerals
361 Pottery, China, and Earthenwear 5.54 5.54 3.32 4.15
362 Glass and Glass Products 0.00 0.00 0.00 0.00
369 Other Non-Metallic Mineral Products 6.65 5.06 4.24 1.86
37 Basic Metals
371 Iron and Steel Basic Industry 37.29 26.77 62.63 39.45
372 Non-Ferrous Metal Basic Industries 49.14 37.46 29.22 37.14
38 Fabricated Metal
381 Fabricated Metal Products 6.00 4.04 5.19 3.71 382 Machinery except Electrical 6.34 6.68 7.55 5.69
383 Electrical Machinery 2.70 2.61 2.49 1.88
384 Transport Equipment 6.11 4.64 3.57 4.91
385 Professional, Scientific
Measuring and Controlling
Equipment 7.00 4.31 4.32 2.94
3 Other Manufacturing
39 Other manufacturing industries 8.01 5.20 6.07 5.22
Manufacturing Sector 24.23 23.10 22.63 22.79