Simulation of TRT-Configured Ground-Penetrating
Radars Over Heterogeneous Grounds
U E U R
OEuz*
A N DLEVENT
G U R E L BILKENT UNIVERSITY B I L K E N T . A N K A R A , TURKEY([email protected], 1gurel~ee.bilkent.edu.tr)
DEPARTMENT O F ELECTRICAL AND ELECTRONICS ENGINEERING
1
Introduction
The finitedifkrence time-domain (FDTD) method, along with the perfectly- matched layer (PML) absorbirig boundary conditions (ABCs), has been used exten- sively to simulate ground-penetrating-radar (GPR) scenarios. The main difficulty in both practical and numerical G P R problems is the domination of the received signals by the direct coupling from the transmitter. Various practical [l] and nu- merical [ 2 ] methods have been devised to degrade this coupling and enhance the detectability of the buried target.
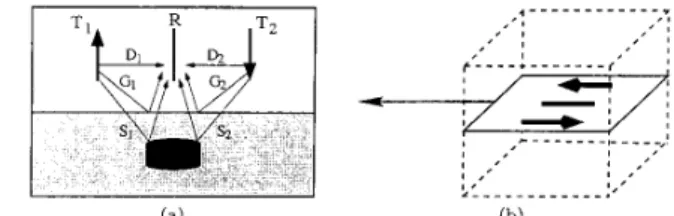
T h c transinitter-receiver-transmitter (TRT) configuration [3. 41 is an attempt to design GPR models with identically zero coupling at the receiver. In this con- figuration. the receiving antenna is located in the middle of the two identical transmitters, which are fed 180" out of phase. The T R T configuration, illustrated in Fig. l ( a ) , implies the existence of a symmetry plane in the middle two trans- mitters and the cancellation of the direct signals ( D l and 0 2 ) coupled from the transniitters at the receiver location. Moreover, if the ground is homogeneous and the ground-air interface is uniform, the two reflected signals (GI and G2) also can- cel out a t the receiver. The T R T configuration is a n efficient and powerful way to enhance the detection of buried targets by removing or decreasing the amplitudes of large undesired signals.
.r\ltliough different aligiiment and polarizations of TRT-configured G P R models yield a variety of results on a fixed scenario [4], in this paper, a single configura- tion, which is depicted in Fig. l ( b ) ; is used. This G P R model consists of three horizontally-polarized antennas aligned parallel to the path of the radar unit.
( 4 (b)
Figure 1: (a) Basic T R T configuration of the radar unit and the definition of the direct (01, and OZ), reflected (GI, and Gz), and scattered (SI, and S,) signals. (b) The T R T configuration used in this paper.
2
Optimization of t h e Antenna Separation
For the G P R configuration in Fig. l ( b ) , changing the distance between t,he trails- mitting and receiving antennas affects the amount of scattered energy observed at the receiver. Figure 2 displays two C-scan results of a conducting disk. wit11 2.5 cm radius, 4 cm height, and buried 5 cm under the ground. These two results are obtained with G P R models of 1-cm and 4-cm transmitter-receiver (T-R) sep- arations. Figures 2(a) and ( b ) reveal t h a t larger amounts of Scattered energy is observed on the receiver while the T-R separation increases.
Mu€mrw=92673xrO8 M ~ E n s r p v - % Z i Z i r O '
Figure 2: T h e C-scan results of a conducting disk, buried 5 cm under the ground. T h e T - R separation is (a) 1 cm and (b) 4 cm.
Although the received energy seemed to increase with the separation of the antennas in Fig. 2, the received scattered energy is likely t o decrease to zero as the separation approaches infinity. Therefore, a n optimum value should be en- countered while the transmitters and the receiver are taken apart. In order to demonstrate the existence of this optimum distance and find its value, a number of simulations are carried out with the TRT-configured G P R model. In the rc- ferred simulations, the T-R separation of the G P R model is changed from 1 cm to 16 cm in one-cm steps. With each of the 16
GPR
models, a B-scan measurement is performed and the maximum received energy is recorded. Figure 3 displays these energy figures with respect to theT-R
separation value and demonstrates t h a t the optimum T-R separation value is between 6 cm and 7 cm.10' 15
I
T-R Separation (em)
Figure 3: T h e maximum received energy vs. the T - R separation 758
3
B-Scan Results with Heterogeneous Ground
Model
ion; t . 1 ~ ~ii:rfiiriiiaiii;i! of t,lie TRT-coiifigiirctl G P R iiiotlel is it,iug 011 Iicterogeii(:niis groiiiid niodcls. Abovc a Iioniogeiicoii
tit t,hc ri:ceivcr is solely due to the buried t sit~iiatioii a t i d tlic eff'ects of gri)nnd inlio
especially siir1ii.c disordcr; sliould be st,iirlied iii order to firiiily coniitient on the overall perfor11i~t1ice of tlic THT coiifiguratioii. For this reason, a sirrniliitioii setup goveriiiiig a hctcr~igeiieous groiiiid niodcl, wliicli is displaycd i n Fig. 4, aiid a TRT- coufigured GPR iiiotlel is dcsigu(x1. The groiirid niodel has a pcrinittivity of 8 F g
;tiid a coiiduct,ivit,y of 0.01 S/ni Th(w ;trc 40 liolcs on tlic groiiiid-air interface,
ilmrldiug t,lie surfaw disorder. Moroovcr. t,tiere iiru 40 higlily ~:otidiictiiig sriiall ol),jccI.s iii t,lie IiiiddIc level of the groiniiI itiid 80 ot,Iier sniall scat,tcrcrs in the lower . lix:iLt,ioiis, pcriiiitt,ivit,ies, arid coiirliictivities of t,licsc uIi.jcct~s ,iri: riiii(loiii1y scli:r:t,ctl.
20 10 0 80 60 0 0 Y x
Figiirc 4: Tlii: lietcrogciicoiis grouiid model
First,. 1 . 1 1 ~ siiiiiiliit.ioii resiil1.s of t,lii: si~iiic rlii ric disk; buried in a honioge-
ti(:oiis gr01111(1. is displayeil iu Fig 5 iu ortlcr t .ovide a corriparisoii witli the
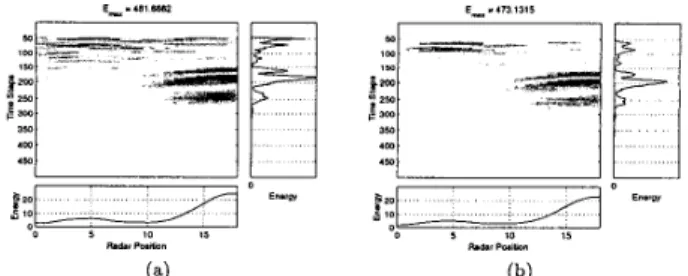
111:11:rogi:iieous-groiiiid siiiiiiliit,i~ii r e s u l k The radar unit travels 011 a h e a r path iiiid st.ops iit. i~ poiiit wliosc pro,jc(:t,ion is oii t,lie ceiitcr of the iiielcctric disk. The sc;tt.tcrC(l-fii:ld iiiiage deinoiist.ratr:s t,liat tlic buricd target is easily detected when ous groiitid In Fig. 5. two nxt,r;t m c t g y plots are given, t,i!rc(I ciiorgy viiliics with icspect to the radar positioii and Figuri: ti(;i), wliicli pr(:sciits t,lie siiriiilatioti rcsult,s of tlic dielectric disk with
1,111: 1iet~~rogi:iiaoiis g r o i i i i ~ l ~ i i o i l e l ~ deiuoristratos t,liat, the signals scattered from the
rlisk i i t (: sl.ill visilJc. altlivugli i i large noise is observed at, the early time s k p s of thc U-S(.UI. 'l'liis iiiiis(: is ;il,sciit, iii t,lic B-scaii results obtaincd with the Iioinogeiicous gioiiiirl, iii Fig. 5. 111 iirdcr to iiivestigatc t,he characterisl.ics of this noise, the i i ~ ~ i i s groinid iiiotlel is idt,ered itlid aiiotlicr simulation is performed. In this
iiid noc cl cl. t,lie s i n f i t c c lioles iii the previous uiodel are moved one cell int,o
t,lic groiiiid, ;iiid t,Ii~;~~~fori;. 1.111~ gioini&air iiitcrface IS rcgularized. T h e siniulatiom iesults of this ground iriodel itre ilisplaycil iii Fig. G ( b ) . Comparison of Fig. 6 ( a ) iuirl 6(b) ravcals that, the large early-time iioise in t.he results of Iiet,erogerieous groiiiid witli s u r f x c disordcr tire degraded in tlie results of the heterogeneous groutid with regular groutid-air interface. Therefure, it is possible conclude that 1111: TRT-coiifiigiircd G P R is sciwitive to surface roughness and the main source of m i s e IS t,licsc detorioiat,ions in the ground-air interface.
n
Figure
5:
T h e simulation results of a dielectric disk obtained with a homogeneous ground model.Figure 6: T h e simulation results of a dielectric disk obtained with a heterogeneous ground model
that
contains (a) surface disorder and (b) no surface disorder.4
Concluding Remarks
The T R T configuration of the G P R is a powerful tool to degrade the largc undesired signals that dominate the total-received signal. Ground inhomogeneities, especially the ones in the surface of the ground, iiifluence the measurements. Howevcr, the signals scattered from the target are still observed a t the rcceiver.
References
[l] J . M. Bourgeois and G. S. Smith, “A complete electromagnetic simulation of the
separated-aperture sensor for detecting buried land mines,” IEEE Trans. Antennas Propugat., vol. 46, no. 10, pp. 1419-1426, Oct. 1998.
[2] U. O e and L. Giirel, “Modeling of ground-penetrating-radar antennas with shields and simulated absorbers,” IEEE Trans. Antennas Propagut., accepted, Nov. 2000.
[3] P. Luneau and G. Y . Delisle, “Underground target probing using FDTD,” I996 IEEE A P - S International Symposium and URSI Radio Science Meeting, Bakirnore, Mary- land, U.S.A., pp. 1664-1667, July 1 9 9 6 .
[4] L. Giirel and U. Oguz, “Three-dimensional FDTD modeling of a grouiid-penet,ratiiig
radar,’’ IEEE Trans. Geoscience and Remote Senslng, vol. 38, no. 4 , pp. 1513-1521,
July 2000.