The value of liver and spleen ADC
measurements in the diagnosis and follow up
of hepatic fibrosis in chronic liver disease
O
¨ . Tokgo¨z
1, I˙. U
¨nal
2, G. Gedikli Turgut
3, S. Yildiz
41
Department of Radiology, Antalya Training and Research Hospital, Antalya, Turkey,2Department of
Biostatistics, School of Medicine, Cukurova University, Adana, Turkey,3Department of Radiology, School of Medicine, Bulent Ecevit University, Zonguldak, Turkey,4Department of Radiology, School of Medicine, Gazi University, Ankara, Turkey
Aims: To evaluate the value of spleen and liver apparent diffusion coefficients (ADC) in chronic liver disease patients, with and without hepatocellular carcinoma (HCC), and to investigate the use of diffusion-weighted imaging (DWI) in the diagnosis and follow-up of hepatic fibrosis.
Materials and methods:This study population comprised 68 chronic liver disease patients (Group 1) and 70 healthy volunteers as controls (Group 2). In Group 1, 40 patients had chronic hepatitis-B, 20 had chronic hepatitis-C, 5 had non-alcoholic steatohepatitis and 3 had alcoholic steatohepatitis. Diagnosis of chronic liver disease was made by percutaneous liver biopsy and the degree of fibrosis (stage) was determined using the METAVIR scoring system. HCC diagnosis was made with a lesion biopsy. The patient group was subdivided based on the degree of fibrosis (F1, F2, F3 and F4) and presence of HCC. After patient and control groups underwent b-value 600 s/mm2DWI examination, liver and spleen ADC values were mapped and measured. The ADC values of the patient groups (F1, F2, F3, F4; with HCC, without HCC) were compared with each other and with the control group.
Results:Liver ADC values were lower in Group 1 compared to Group 2 (P,0.001). There was a statistically significant difference between the patient and control groups liver right lobe, left lobe and caudate lobe ADC values (P,0.001). Comparing the F1, F2, F3 and F4 groups, there was no statistically significant difference found in terms of ADC values (P.0.05). However, as degree of fibrosis increased there was a reduction in ADC values, though not statistically significant. Comparing the groups with HCC and without HCC, there was no statistically significant difference in ADC values (P.0.05). There was no statistical difference in average spleen ADC values between patient and control groups (P.0.05).
Conclusions:In chronic liver disease, ADC values were lower. As the degree of liver fibrosis increased, ADC levels decreased, though the relationship between ADC values and fibrosis degree was not statistically significant. Quantitative DWI may help in the diagnosis of fibrosis in chronic liver disease patients, however as it does not show the degree of fibrosis, its use in treatment planning and follow-up is controversial. Spleen DWI measurement is not a sufficient method to diagnose and determine the degree of fibrosis in chronic liver disease patients.
Keywords: Apparent diffusion coefficients, Disease, Fibrosis, Liver, Spleen
Introduction
Chronic liver disease, caused by various factors such as viral hepatitis and alcohol, is a clinicopathologic diagnosis. The histopathologic tableau can be accom-panied by varying degrees of fibrosis.1
Within 20–30 years after the diagnosis, there is a 20–30 risk of developing liver cirrhosis and a 1–5 risk of developing hepatocellular carcinoma (HCC). Liver fibrosis is a result of chronic damage. The
amount and progression of fibrosis is important to determine the severity and prognosis of the disease and to make treatment decisions.2
Percutaneous liver biopsy is the gold standard in the evaluation of changes in early and late stage hepatic fibrosis in chronic liver disease and in distinguishing the degree of necroinflammation.3–5 However, it is an invasive technique, and can lead to complications such as pain, bleeding, peritonitis, pneumothorax and death.6 Studies have found risk rates of 1–5% for hospital stay, 0.57% for severe complications and 1 : 1000–1 : 10 000 for mortality after biopsy.7Thus, in
Correspondence to: Dr O¨ zlem Tokgo¨z, Antalya E.A. Hastanesi, Radyoloji ABD, Antalya, Turkey. Email: [email protected]
the diagnosis, measurement and monitoring of hepatic fibrosis patients; a reliable, simple and non-invasive method has been searched. Routine contrast magnetic resonance imaging (MRI), perfusion MRI, MR elastography and MR spectroscopy may be used in the diagnosis and evaluation of fibrosis.8Unenhanced inversion recovery and magnetization transverse MRI have been shown to be insufficient to diagnose mild hepatic fibrosis.9,10In addition, imaging methods such as FibroScan and Echosens may be used for the diagnosis of late stage fibrosis and cirrhosis.11–13 In recent years, a growing importance of non-invasive tests to assess liver fibrosis has been observed. Transient elastography is one of them. It is based on the progression of an elastic shear wave within the liver. Arda et al.14 measured the elasticity values of liver segments by shear wave ultrasonographic elasto-graphy in normal healthy volunteers. Transient elastography (FibroscanH) is well validated in different cohorts of patients with liver disease and is now regarded as a routine test in hepatological practice.15 Several non-invasive laboratory tests have been used to assess liver fibrosis in patients with chronic liver disease, including the hyaluronic acid, FibroTest, Fibrometer A, Hepascore, Forns and APRI indexes, FIB4, Prothrombin index, alpha-2 macroglobulin and hyaluronic acid. APRI index is a derivative of the AST and platelet count, is a useful test for the non-invasive determination of advanced fibrosis. However, among those tests, Fibrotest, FibrometerA and Hepascore demonstrated sufficient diagnostic accuracy in identify-ing advanced fibrosis and cirrhosis.16 Enhanced liver fibrosis (ELF) test was also investigated as a non-invasive serum test, but in a recent study, transient elastography showed better performance than en-hanced liver fibrosis in the detection of severe fibrosis.17 Recent studies showed that diffusion-weighted imaging (DWI) has great promise in the diagnosis of liver fibrosis. DWI is a fast and non-invasive technique that does not require contrast material.18DWI can easily be obtained with all 1.5 Tesla MRI devices. There is no extra cost for DWI. As no contrast material was used, DWI is even cheaper than conventional abdominal MR Imaging. DWI can also be obtained more rapidly, so it is more comfortable for the patient.
The apparent diffusion coefficient (ADC) measures the magnitude of diffusion (of water molecules) within the tissue. DWI measures the random motion of water molecules. The impedance of water mole-cules diffusion can be quantitatively assessed using ADC value. This evaluation should be done using different b values by changing gradient amplitude, and ADC values are calculated automatically by the software.
To the best of our knowledge, to evaluate DWI, there has been no study published to date dividing
chronic liver patients into those with HCC and without. Our main goal in current study was, to evaluate the changes in spleen and liver ADC values in chronic liver disease patients, with and without HCC. In addition, we tried to investigate the use of DWI in the diagnosis and follow-up of hepatic fibrosis.
Materials and Methods
This study was prospectively planned. Ethical com-mittee permission was granted for the study. This study included clinical and laboratory results of 68 patients with chronic liver disease (Group 1) and a control group of 70 healthy volunteers (Group 2). Chronic liver disease was diagnosed by percutaneous liver biopsy. Patients with chronic liver disease caused by pathological situations other than viral hepatitis, alcohol and steatosis, biliary obstruction and meta-bolic causes were excluded. Patients with poor general condition, patients over the age of 70, patients without respiratory cooperation, and cases with prosthesis, implants or cardiac pacemakers were not included in the study.
In Group 1, 40 patients had chronic hepatitis-B, 20 had chronic hepatitis-C, 5 had non-alcoholic steato-hepatitis and 3 had alcoholic steatosteato-hepatitis. Liver biopsy was carried out with ultrasonography gui-dance by an experienced radiologist. Liver biopsy was not done for the healthy volunteers in the control group. Liver biopsy material was dyed with hema-toxylin and eosine and Masson’s Trichrome and then evaluated by a pathologist unaware of the biochem-ical and DWI results. The degree of fibrosis (stage) was determined by the METAVIR scoring system. Liver fibrosis was classified as; F0 – no fibrosis; F1 – widening of the portal region-no fibrosis, septa forma-tion; F2 – widening of the portal region-fibrosis, rare septa formation; F3 – definite septa formation, no cirrhosis and F4 – cirrhosis. Thus patients were divided into four groups depending on the degree of fibrosis. Additionally, patients were also divided into two groups; mild fibrosis (F1zF2) and advanced fibrosis (F3zF4). The patient group was divided into two groups; those with development of HCC and those without. Patients with HCC lesion size above 4 cm and those with infiltrative HCC lesions were excluded from the study. HCC diagnosis was provided by a biopsy of the lesion.
1.5 Tesla superconducting MR scanner (Intera, Master Gyroscan, Philips Medical systems, the Netherlands) was used for the imaging, which was performed without any need for sedation, in a supine position with a four-channel sense body coil over the liver. Before DWI, coronal localizer and T2A axial images were obtained. DWI images directed at the upper abdomen were taken in all patients including the control group. By selecting TR 1523 ms, TE
60 ms, FOV 375 mm, matrix 5126512, NEX 4 in the single shot, spin echo, echo planar (SS–SE–EP) DWI, images with b 0.600 s/mm2values were obtained.
DWI data was transferred to an independent work station for processing (Extended MR Workspace, version 7.1.5.1, Philips Medical Systems) and ADC maps were created. ADC values were measured from those maps by an experienced radiologist (O.T.).
Circular Region of Interest (ROI) was used for the quantitative analysis of the ADC value of the hepatic parenchyma. To avoid artefacts, images were taken away from the vascular and biliary structures and from areas of the parenchyma at least 1 cm far from the capsule. The measured area of ROI was set at approximately 1 cm2.
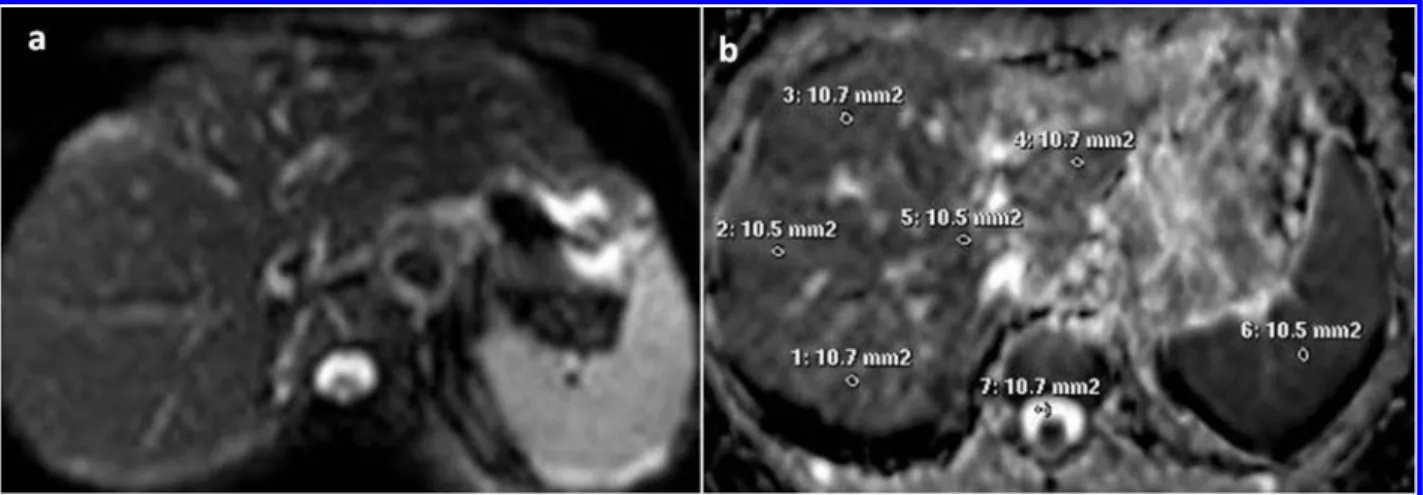
According to these criteria, on b 600 s/mm2 liver ADC maps, three measurements each were taken in the liver right lobe anterior, right lobe posterior, left lobe medial, left lobe lateral and caudate segments were reached. Finally, a total of 15 measurements for each patient (Fig. 1) were recorded. For each segment, average ADC values were calculated from the 3 ADC measurements and, average hepatic ADC value was calculated from the arythmetic average of the 15 ADC measurements.
For the spleen ADC measurements, a circular ROI of approximately 1 cm2was used. The measurements were taken from parenchyma areas at least 1 cm away from the capsule and not crossing major vascular structures as far as possible. According to these criteria, measurements of b 1000 value were made
from a total of three points as one each from the inferior pole, the interpolar section and the superior pole (Fig. 1). The mean spleen ADC value was calculated from the mean of the three measurements.
For statistical analysis, SPSS 18.0 program was used. Age and ADC measurements were given as mean and standard deviation (median and minimum– maximum where necessary). For independent groups, comparison of age and ADC values between cirrhosis and control groups were managed with the t-test (Student t test). In two or more groups (degree of fibrosis in patient and control groups, those with and without HCC in patient and control groups), for general comparison of age and ADC measurements, one way analysis of variance was used. Significance for these comparisons and pairwise comparisons was made with the Scheffe test. To distinguish liver ADC values in control and patient groups and, establish a cut-off point, ROC analysis was used. The level of statistical significance was set at 0.05 for all tests.
Results
The average ages in Group 1 and 2 were similar (59 and 56 years, respectively). According to histopatho-logic classification, the number of patients in F1, F2, F3 and F4 groups were 32, 15, 7 and 14, respectively. The control group was composed of 70 healthy volunteers which was classified as stage 0.
Average liver ADC values were 1.65260.136 1023mm2/s in the control group and 1.45160.136 1023mm2/s in the patient group (Table 1). There was
Figure 1 Diffusion-weighted MR image of the liver (b5600): (a) Liver apparent diffusion coefficient (ADC) map and (b) Segments of the liver, cerebrospinal fluid and spleen ROI.
Table 1 Age distribution of the patient and control groups, a comparison of the mean liver and spleen ADC values of the patient and control groups
Patient group (n568) Control group (n570)
Age (years) 5961,8 5661.3
Liver ADC value (61023mm2/sn) 1.45160.13a 1.65260.13
Spleen ADC value (61023mm2/sn) 1.36860.13b 1.36760.18
Note: Data are n of participants, mean6SD.
a
P,0.001 compared with control group (student’s t-test).
b
a statistically significant difference in ADC values between the two groups (P,0.001). There was a significant difference in liver right lobe, left lobe and caudate lobe ADC values between the patient and control groups (P,0.001). The ADC values in the chronic liver disease patients were lower than the control group. ADC values for patients grouped by degree of fibrosis were given in Table 2. In F1, F2, F3 and F4 groups; ADC values were statistically sig-nificantly lower than in the control group (P,0.001). However, between F1, F2, F3 and F4 groups, no statistically significant difference was noticed in terms of ADC values (P.0.05). As degree of fibrosis increased, there was a reduction in ADC values that was not statistically significant. When the ADC values of the mild fibrosis (F1zF2) and advanced fibrosis (F3zF4) groups were compared, no statistically significant difference was found (P.0.05). In the advanced fibrosis group, ADC values were lower than in the mild fibrosis group, but this difference was not statistically significant (Table 3). When the patient group was divided into those with HCC, and those without HCC, no statistically significant difference in ADC values was reached (P.0.05). The ADC values of both groups were statistically significantly lower than the control group (P,0.001) (Table 4).
Average spleen ADC value in the control group was 1.36760.1861023mm2/s and 1.36860.1361023mm2/s in the patient group (Table 1) (P.0.05).
To determine a cut-off point to distinguish liver ADC values in the patient and control groups; ROC curves were formed. Area under the curve (AUC) values with relevant cut-off, sensitivity and specificity values were given in Table 5.
Discussion
Major complications of chronic liver disease may be life-threatening. For this reason monitoring and treat-ment of chronic liver disease carry clinical importance. In certain circumstances, pathologic evaluation is mandatory. The degree of fibrosis determined by liver biopsy results, affects the treatment decision and is an important parameter during the follow-up of those cases. Progressive fibrosis may cause structural distor-tion of the liver and may lead to cirrhosis eventually.
Currently, liver biopsy is the gold standard method in the diagnosis and evaluation of the degree of liver fibrosis. Although, percutaneous liver biopsy may cause mortality and morbidity, the histopathological results are critical in the evaluation of treatment, disease prognosis and treatment response in chronic liver disease patients.4,19,20Unfortunately, the biopsy
Table 2 Age distribution of fibrosis stage groups and controls, a comparison of the mean liver and spleen ADC values of fibrosis stage groups and controls
F1 (n532) F2 (n515) F3 (n57) F4 (n514) Control (n570)
Age (years) 58.0614 58.8 69.7 59.7614 59.561.7 56.461.3 Liver ADC value (61023mm2/sn) 1.48860.11a 1.46160.13a 1.39160.16a 1.37160.16a 1.65260.13
Spleen ADC value (61023mm2/sn) 1.30860.12b 1.31660.58b 1.38460.38b 1.42160.38b 1.36760.18 Note: Data are n of participants, mean6SD.
a
P,0.05 compared with control group.
bP.0.05 compared with control group.
Table 3 Age distribution of the mild and advanced fibrosis groups and controls, a comparison of the mean liver and spleen ADC values of the mild and advanced fibrosis groups and controls
Mild fibrosis (n547) Advanced fibrosis (n521) Control (n570)
Age (years) 59.861.2 58.161.1 56.461.3
Liver ADC value (61023mm2/sn) 1.47460.13a 1.40360.15a 1.65260.13
Spleen ADC value (61023mm2/sn) 1.39160.16b 1.30760.21b 1.36760.18
Note: Data are n of participants, mean6SD.
a
P,0.05 compared with control group.
b
P.0.05 compared with control group.
Table 4 Mean age, liver and spleen ADC values of the patient groups with HCC, without HCC and controls with relevant comparisons
With HCC group (n515) Without HCC group (n553) Control (n570)
Age (years) 59.861.2 58.161.1 56.461.3
Liver ADC value (61023mm2/sn) 1.37460.19a 1.46360.11a 1.65260.13
Spleen ADC value (61023mm2/sn) 1.30760.16b 1.37860.21b 1.36760.18
Note: Data are n of participants, mean6SD.
aP,0.05 compared with control group. b
procedure itself is an invasive procedure and cannot easily be accepted by patients. In addition, in some cases, the biopsy procedure may have sampling and evaluation errors due to small samples obtained. For all those reasons related to percutaneous liver biopsy, a non-invasive method to evaluate liver fibrosis is being searched.
In this perspective, DWI may be advantageous in the diagnosis of fibrosis. However, controversial results have been obtained from initial studies.18,21–25 Diffusion is the random spontaneous movement of molecules in a solution and the ADC can be used to measure the speed of this movement. DWI is a non-invasive method to measure the microscopic move-ment of fluid in tissue. ADC of DWI is sensitive in measuring this movement.26ADC is affected by both diffusion and perfusion.23,26,27 Diffusion measure-ments on MR are affected by many factors including perfusion, cell structure and permeability.27
DWI is a technique that does not require contrast material and can be measured in the time of a single held breath. It was first used to image the brain for detection and monitoring of stroke.
With the development of rapid MRI sequences such as echo-planar imaging; areas of application in other body parts started to be investigated. Many research-ers have published studies related to the application of diffusion-weighted MRI on the liver, kidneys and other abdominal organs.28–30 These studies showed that using DWI, the different values calculated from the ADC of tissues and lesions could be used in differential diagnosis. In a study on rats by Guan et al.,31they reported that the determination of diffuse hepatic lesions via DWI was superior to conventional MRI and, the measurement of ADC value could be helpful in early diagnosis of diffuse liver lesions.
In hepatic fibrosis, the water component of collagen reduces. Related to this, in advanced fibrosis, diffusion of water protons in liver tissue reduces. Recent studies have shown that patients with liver fibrosis had hepatic ADC values lower than normal subjects. This reduc-tion in ADC was explained by limited diffusion caused by glycosaminoglycans, proteoglycans and collagen fibrils accumulated in liver tissue during the fibrosis process.18,22,23,32
In a study including 17 Child Pugh class A cirrhosis hepatitis B patients and 10 control subjects, ADC in
cirrhosis patients was found to be lower.33In another study of cirrhotic patients when optimized to max-imum b value; single-step, spin echo, echo-planar sequences were taken via MRI and, results showed that liver fibrosis was accurately identified. The study determined the threshold ADC value for liver fibrosis to be 1.3161023mm2/s.34 To better evaluate fibrosis and limit perfusion variations, the authors recom-mended that ADC measurements be made in the posterior of the right lobe with high b values (500– 750 s/mm2).32,35When low b values were used, ADC was more affected by perfusion.19,20 Another study reported that b values between 200 and 400 provided better fibrosis measurements.18
Boulanger et al.21 used 50–250 s/mm2 b values in DWI of hepatitis C patients and could not find a significant difference when compared to controls.
In a study by Koinuma et al.24using 128 s/mm2b value, a significant negative correlation was found between ADC and fibrosis score. However, the b value was similarly low in this study.
The hepatic mean ADC value of patients at different stages of chronic liver disease was found to be low compared to that of healthy individuals in a study by Talwalkar et al.36Lewin et al.37reported lower mean ADC values in 54 chronic HCV patients compared to those of 20 healthy volunteers. In our study a b value of 600 was used while calculating ADC. Average ADC values in hepatic fibrosis patients were statistically significantly lower than the control group (P,0.001). In our study, the threshold ADC value for liver fibrosis was set as 1.53761023mm2/s. The sensitivity and specificity values for this cut-off level were 73.6 and 79.5%, respectively.
Taouli et al.38,39found significant difference in ADC values between hepatic fibrosis patients at different stages in the adult population. They found a moderate negative correlation between stage and ADC values. Lewin et al.37 and Sandrasegaran et al.40also found negative correlations between ADC values and fibrosis stages. Lewin et al.37found that the advanced fibrosis group was lower compared to the mild fibrosis group in terms of mean liver ADC value. Bakan et al.41found that ADC values decreased as the fibrosis stage increased.
On the other hand, Soylu et al.42 concluded that there was no correlation between ADC values and the
Table 5 AUC, sensitivity and specificity values for certain cut-off mean liver ADC values
Patient group Mild fibrosis Advanced fibrosis
AUC (95% CI) 0.852 0.827 0.917
Cut-off value (61023s/mm2) #1.537 #1.537 #1.502
Sensitivity (%) (95% CI) 73.6 68.4 86.7
Specificity (%) (95% CI) 79.5 79.5 89.4
Note: AUC: area under the curve. CI: Confidence interval.
stage of hepatic fibrosis. In our study, there was no significant difference between different stages of fibrosis in terms of ADC values. However, as degree of fibrosis increased, there was a reduction in ADC values that was not statistically significant. In addi-tion, mean ADC values in the group with HCC were lower than the group without HCC, though this difference was not also statistically significant. Further studies with larger HCC population may give more discriminative data about this topic. In distinguishing between liver ADC values of the patient and control groups and determining a cut-off point for fibrosis diagnosis, we found a sensitivity value of 73.6% and a specificity value of 79.5%. When we tried to determine a certain cut-off point to distinguish the advanced fibrosis group from the control group in terms of ADC values, the sensitivity rose to 86.7% and specificity rose to 89.4%.
In the current study, ADC values from different lobes were different. This situation may be related to perfusion changes, but the difference may be created by artefacts created by the arterial beats in the caudate lobe and heart as well as intestinal move-ments.4,23,35There were statistical differences in ADC values between the different fibrosis groups and control group in the liver right lobe and left lobe (P,0.05). Caudate lobe mean ADC values were significantly lower in the F1 group when compared to mean values in the control group (P,0.05). Mean ADC values in the caudate lobe for the groups F2, F3 and F4 were lower than the control group, but the relevant P values were .0.05. We thought that this situation may be due to the low number of patients in these groups. When mean ADC values measured from the liver right lobe, left lobe and caudate lobe of mild and advanced fibrosis groups were compared, no statistical significance was observed. When mean ADC values of mild fibrosis group were compared with controls, and when mean ADC values of advanced fibrosis groups were compared with con-trols, statistically significant differences were noticed (P,0.05).
In the study by Cece et al.43 average spleen ADC values of chronic viral hepatitis patients were significantly higher than the ADC values of controls (P,0.05). Average spleen ADC values in the mild fibrosis group were not significantly different from those in the control group. There was a statistically significant difference in ADC values between the advanced fibrosis group and the control group. In our study, no significant difference in spleen ADC values between patient and control groups were found. Thus, we think that, the quantitative diffu-sion-weighted MR imaging of the spleen would be insufficient to diagnose and determine the stage of fibrosis in chronic liver disease patients.
Limitations to the study should be considered. First of all, the number of patients in the subgroups was low. Prospective randomized trials with larger series may give more conclusive data. Secondly, some artefacts linked to cardiac and abdominal movements might reduce the S/N ratio. Also, obtaining higher quality images are required to compare histopatho-logic results with ADC values.
In conclusion, as determined by previous studies, ADC values were found to be lower in chronic liver disease patients. In our study, although mean ADC values reduced as the stage of fibrosis increased, no statistically significant difference was observed. Quantitative DWI may help in the diagnosis of fibrosis in chronic liver disease patients, however as it does not show the degree of fibrosis, its use in treatment planning and follow-up of those cases is still controversial. Spleen DWI is not a sufficient method to diagnose and determine the degree of fibrosis in chronic liver disease patients.
References
1 Hoofnagie JE, Alter HJ. Chronic viral hepatitis. In: Vyas GN, Dienstay JL, Hoofhagie JH, editors. Viral hepatitis and liver disease. New York: Grune and Stratton; 1984. p. 97–113. 2 Schuppan D, Afdhal NH. Liver cirrhosis. Lancet. 2008;371:
838–51.
3 Strader DB, Wright T, Thomas DL, Seeff LB. Diagnosis, management, and treatment of hepatitis C. Hepatology. 2004;39:1147–71.
4 Kim AI, Saab S. Treatment of hepatitis C. Am J Med. 2005;118:808–15.
5 Gish RG. Current treatment and future directions in the management of chronic hepatitis B viral infection. Clin Liver Dis. 2005;9:541–65.
6 Solı´s Herruzo JA. Current indications of liver biopsy. Rev Esp Enferm Dig. 2006;98:122–39.
7 Tobkes AI, Nord HJ. Liver biopsy: review of methodology and complications. Dig Dis. 1995;13:267–74.
8 Yin M, Talwalkar JA, Glaser KJ, Manduca A, Grimm RC, Rossman PJ, et al. Assessment of hepatic fibrosis with magnetic resonance elastography. Clin Gastroenterol Hepatol. 2007;5: 1207–13.
9 Mitchell DG, Navarro VJ, Herrine SK, Bergin D, Parker L, Frangos A, et al. Compensated hepatitis C: unenhanced MR imaging correlated with pathologic grading and staging. Abdom Imaging. 2008;33:58–64.
10 Chen JH, Chai JW, Shen WC. Magnetization transfer contrast imaging of liver cirrhosis. Hepatogastroenterology. 1999;46: 2872–7.
11 Ziol M, Handra-Luca A, Kettaneh A, Christidis C, Mal F, Kazemi F, et al. Noninvasive assessment of liver fibrosis by measurement of stiffness in patients with chronic hepatitis C. Hepatology. 2005;41:48–54.
12 Rouvie`re O, Yin M, Dresner MA, Rossman PJ, Burgart LJ, Fidler JL, et al. MR elastography of the liver: preliminary results. Radiology. 2006;240:440–8.
13 Caste´ra L, Vergniol J, Foucher J, Le Bail B, Chanteloup E, Haaser M, et al. Prospective comparison of transient elasto-graphy, FibroTest, APRI, and liver biopsy for the assessment of fibrosis in chronic hepatitis C. Gastroenterology. 2005;128:343– 50.
14 Arda K, Ciledag N, Aribas BK, Aktas E, Ko¨se K. Quantitative assessment of the elasticity values of liver with shear wave ultrasonographic elastography. Indian J Med Res. 2013;137: 911–5.
15 Patanwala I, Fielding S, Akerboom K, Barr J, Cross T, Lombard M, et al. PTH-041 A High Quality Transient Elastography Service Can Successfully Be Delivered By Healthcare Assistants. Gut. 2014;63:A226–7.
16 Tapper EB, Krajewski K, Lai M, Challies T, Kane R, Afdhal N, et al. Simple non-invasive biomarkers of advanced fibrosis in the evaluation of non-alcoholic fatty liver disease. Gastroenterol Rep (Oxf). 2014. pii: gou034. [Epub ahead of print]
17 Trembling PM, Lampertico P, Parkes J, Tanwar S, Vigano` M, Facchetti F, et al. Performance of Enhanced Liver Fibrosis test and comparison with transient elastography in the identifica-tion of liver fibrosis in patients with chronic hepatitis B infection. J Viral Hepat. 2014;21:430–8.
18 Aube C, Racineux PX, Lebigot J, Oberti F, Croquet V, Argaud C, et al. Diagnosis and quantification of hepatic fibrosis with diffusion weighted MR imaging: preliminary results. J Radiol. 2004;85:301–6.
19 Yurdaydin C. Entecavir: a step forward in combating hepatitis B disease. Expert Opin Pharmacother. 2008;9:3095–109. 20 Kamal SM, El Tawil AA, Nakano T, He Q, Rasenack J,
Hakam SA, et al. Peginterferon {alpha}-2b and ribavirin therapy in chronic hepatitis C genotype 4: impact of treatment duration and viral kinetics on sustained virological response. Gut. 2005;54:858–66.
21 Boulanger Y, Amara M, Lepanto L, Beaudoin G, Nguyen BN, Allaire G, et al. Diffusion-weighted MR imaging of the liver of hepatitis C patients. NMR Biomed. 2003;16:132–6.
22 Amano Y, Kumazaki T, Ishihara M. Singleshot diffusion-weighted echo-planar imaging of normal and cirrhotic livers using a phased-array multicoil. Acta Radiol. 1998;39:440–2. 23 Kim T, Murakami T, Takahashi S, Hori M, Tsuda K,
Nakamura H. Diffusion-weighted single-shot echoplanar MR imaging for liver disease. AJR. 1999;173:393–8.
24 Koinuma M, Ohashi I, Hanafusa K, Shibuya H. Apparent diffusion coefficient measurements with diffusion-weighted magnetic resonance imaging for evaluation of hepatic fibrosis. J Magn Reson Imaging. 2005;22:80–5.
25 Ito K, Mitchell DG, Gabata T. Enlargement of hilar periportal space: a sign of early cirrhosis at MR imaging. J Magn Reson Imaging. 2000;11:136–40.
26 Le Bihan D, Turner R, Douek P, Patronas N. Diffusion MR imaging: clinical applications. AJR. 1992;159:591–9.
27 Le Bihan D. Molecular diffusion, tissue microdynamics and microstructure. NMR Biomed. 1995;8:375–86.
28 Poe LB, Manzione JV, Wasenko JJ, Kellman RM. Acute internal jugular vein thrombosis associated with pseudoabscess of the retropharyngeal space. AJNR Am J Neuroradiol. 1995;16:892–6.
29 Davis WL, Harnsberger HR, Smoker WR, Watanabe AS. Retropharyngeal space: evaluation of normal anatomy and diseases with CT and MR imaging. Radiology. 1990;174:59–64.
30 Naganawa S, Kawai H, Fukatsu H, Sakurai Y, Aoki I, Miura S, et al. Diffusion weighted imaging of the liver: technical challenges and prospects for the future. MRMS. 2005;4:175–86. 31 Guan S, Zhou KR, Zhao WD, Peng WJ, Tang F, Mao J. Magnetic resonance diffusion-weighted imaging in the diagnosis of diffuse liver diseases in rats. Chin Med J. 2005;118:639–44. 32 Nasu K, Kuroki Y, Sekiguchi R, Kazama T, Nakajima H.
Measurement of the apparent diffusion coefficient in the liver: is it a reliable index for hepatic disease diagnosis? Radiat Med. 2006;24:438–44.
33 Hsu FO, Chiou YY, Chen CY, Liu GC, Chu HC, Liu HC, et al. Diffusion-weighted magnetic resonance imaging of the liver in hepatitis B patients with Child-Pugh a cirrhosis. Kaohsiung J Med Sci. 2007;23:442–6.
34 Girometti R, Furlan A, Bazzocchi M, Soldano F, Isola M, Toniutto P, et al. Diffusion-weighted MRI in evaluating liver fibrosis: a feasibility study in cirrhotic patients. Radiol Med. 2007;112:394–408.
35 Hollingsworth KG, Lomas DJ. Influence of perfusion on hepatic MR diffusion measurement. NMR Biomed. 2006;19:231–5. 36 Talwalkar JA, Yin M, Fidler JL, Sanderson SO, Kamath PS,
Ehman RL. Magnetic resonance imaging of hepatic fibrosis: emerging clinical applications. Hepatology. 2008;47:332–42. 37 Lewin M, Poujol-Robert A, Boelle PY, Wendum D, Lasnier E,
Viallon M, et al. Diffusion-weighted magnetic resonance imaging for the assessment of fibrosis in chronic hepatitis C. Hepatology. 2007;46:658–65.
38 Taouli B, Tolia AJ, Losada M, Babb JS, Chan ES, Bannan MA, et al. Diffusion weighted MRI for quantification of liver fibrosis: preliminary experience. AJR. 2007;189:799–806. 39 Taouli B, Chouli M, Martin AJ, Qayyum A, Coakley FV,
Vilgrain V. Chronic hepatitis: role of diffusion-weighted imaging and diffusion tensor imaging for the diagnosis of liver fibrosis and inflammation. JMRI. 2008;28:89–95.
40 Sandrasegaran K, Akısık FM, Lin C, Tahir B, Rajan J, Saxena R, et al. Value of diffusion-weighted MRI for assessing liver fibrosis and cirrhosis. AJR. 2009;193:1556–60.
41 Bakan AA, Inci E, Bakan S, Gokturk S, Cimilli T. Utility of diffusion weighted imaging in the evaluation of liver fibrosis. Eur Radiol. 2012;22:682–7.
42 Soylu A, Kilic¸kesmez O, Poturog˘lu S, Dolapc¸iog˘lu C, Serez K, Sevindir I, et al. Utility of diffusion-weighted MRI for assessing liver fibrosis in patients with chronic active hepatitis. Diagn Interv Radiol. 2010;16:204–8.
43 Cece H, Ercan A, Yıldız S, Karakas E, Karakas O, Boyacı FN, et al. The use of DWI to assess spleen and liver quantitative ADC changes in the detection of liver fibrosis stages in chronic viral hepatitis. Eur J Radiol. 2013;82:e307–12.