Log-Periodic Antenna Design Using
Electromagnetic Simulations
Özgür Ergül* and Levent Gürel
Department of Electrical and Electronics Engineering Bilkent University
Ankara, Turkey
([email protected], [email protected])
1. Introduction
Log-periodic (LP) antennas are important with their ability to show nearly frequency independent characteristics over wide bands of frequencies, although they have relatively simple geometries. Numerous different configurations of LP antennas have been studied since late 1950s [1-3]. Among them, LP dipole arrays have been the most popular. Analysis and design procedures of LP dipole arrays can be found in antenna textbooks [4].
Frequency independence of LP antennas is based on strictly theoretical principles, which are difficult or impossible to satisfy in practical implementations. This forces the designers to rely on intuition, assumptions, and approximations. Consequently, an LP antenna that is designed using approximations of idealized theoretical recipes may not function as well as desired. A remedy can be supplied by computational electromagnetics, powered by the recent advances in both the solution algorithms and the computer hardware. In an electromagnetic simulation environment, performances of a series of designs can easily be checked, and the necessary corrections can be implemented on the antennas. In this paper, the benefit of employing electromagnetic simulations in addition to (not instead of) theoretical principles will be demonstrated.
2. Log-Periodic Antenna Design
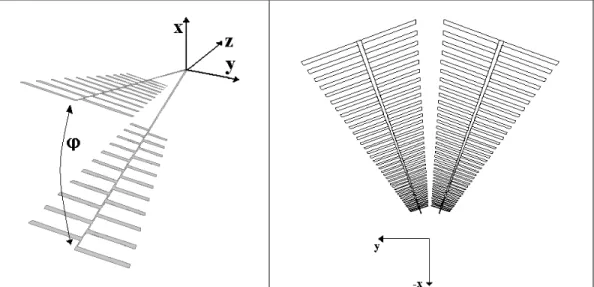
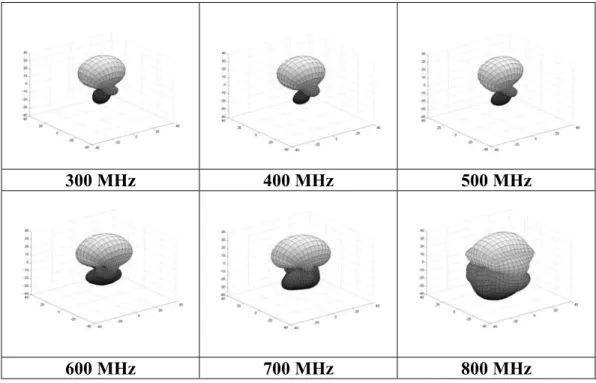
Figure 1(a) shows a trapezoidal-tooth LP antenna made of a thin sheet of perfect conductor in free space. The angle between the two arms of the antenna is 45°, and each arm has 22 teeth (elements), which have lengths, widths, and distances to the source location scaled according to the log-periodic rules. The growth ratio between the consecutive elements is 0.98, and the expansion angle of the arms from the source location is 30°. The largest element length is 22.3 cm, and this design is expected to operate almost independent of frequency in the 300-800 MHz range. Despite this theoretical prediction, the computationally obtained three-dimensional far-field radiation plots shown in Figure 2 are not displaying frequency-independent behavior in the 300-800 MHz frequency range. It is observed that the radiation characteristics change as the frequency approaches 800 MHz. Since the tip of the antenna is oriented in the z direction, the directive gain should be maximum in this direction. Radiation patterns in Figure 2 display this property in the lower half of the frequency band, but not for higher frequencies.
300 MHz 400 MHz 500 MHz
600 MHz 700 MHz 800 MHz
Figure 2: Three-dimensional radiation patterns of the log-periodic antenna.
It is known that, at a given frequency, the highest currents on a log-periodic antenna reside on the elements that are about a quarter wavelength long. These elements constitute the active region of the antenna. The location of the active region slides on the antenna as the frequency changes. Frequency independence of the operation requires that the active region is located on the antenna and away from the discontinuities, such as the physical limits of the antenna. The breakdown of the frequency-independent operation in Figure 2 occurs at high frequencies, and this suggest that the active region on the smaller elements is probably located too close to the end of the antenna. This problem can be
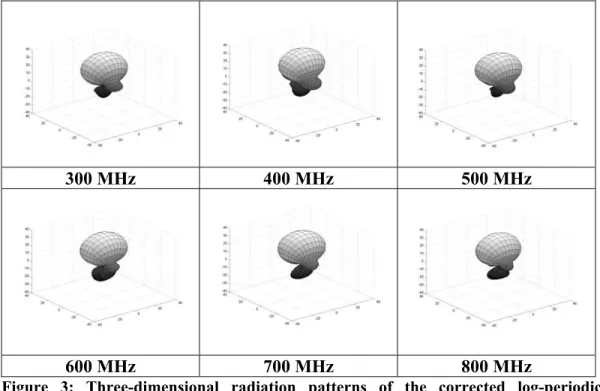
corrected by adding extra teeth on the source side since active region tends to move towards this end as the frequency increases. Figure 3 shows the radiation plots for another antenna with 16 extra teeth added to each arm. The effect of the corrective action of adding extra teeth is obvious since the radiation plots in Figure 3 become almost frequency independent in the entire frequency range.
300 MHz 400 MHz 500 MHz
600 MHz 700 MHz 800 MHz
Figure 3: Three-dimensional radiation patterns of the corrected log-periodic antenna.
3. Log-Periodic Array Design
Multiple LP antennas can be operated in an array configuration. In order to maintain a frequency-independent operation, the array configuration should be specified in terms of angles, similar to the LP antennas. Such a configuration can be achieved by placing the antennas on a circle.
Figure 1(b) shows two LP antennas in a circular array configuration with 40° separation. These antennas have shorter feed structures compared to the one in Figure 1(a) so that they do not touch each other at the center of the circle. The main beam of the array is expected to be in the –x direction if both of the antennas are excited identically. However, it is also possible to steer the main beam in other desired directions by adjusting the relative values of the excitations. Figure 4 shows the far-field radiation patterns of the array for a series of frequencies as the main beam is directed at two different angles. Since there are only two antennas, the required source combinations can easily be determined. Figure 4 presents the cases of the main beam steered to 170° and 160°, where φ=180° corresponds to the –x direction.
4. Concluding Remarks
It is essential to complement theoretical antenna design recipes with he numerical results obtained from electromagnetic simulations. In this paper, the benefit of such a hybrid procedure is demonstrated by using the design of an LP antenna as a case study. It is shown that significant performance improvements can be obtained by applying corrections suggested by the simulation results.
Arrays of LP antennas can also be designed and analyzed in an electromagnetic simulation environment. Design of arrays made up of several LP antenna elements can be achieved by coupling electromagnetic solvers to optimization methods, such as genetic algorithms.
φ=170°, 300 MHz φ=170°, 550 MHz φ=170°, 800 MHz
φ=160°, 300 MHz φ=160°, 550 MHz φ=160°, 800 MHz
Figure 4: Far-field radiation patterns of the log-periodic antenna array shown in Figure 1(b).
Acknowledgements
This work was supported by the Turkish Academy of Sciences in the framework of the Young Scientist Award Program (LG/TUBA-GEBIP/2002-1-12) and by Bilkent University under research fund EE-01-01.
References
[1] V. H. Rumsey, Frequency Independent Antennas. New York: Academic Press, 1966. [2] R. H. DuHamel and G. G. Chadwick, “Log-Periodic Antennas,” in Antenna
Engineering Handbook, R. C. Jackson and H. Jasik, Eds. New York: McGraw-Hill,
1984, Section 14.3.
[3] P. E. Mayes, “Frequency Independent Antennas,” in Antenna Handbook, Y. T. Lo and S. W. Lee, Eds. New York: Van Nostrand Reinhold, 1988, Chapter 9.
[4] W. L. Stutzman and G. A. Thiele, Antenna Theory and Design, New York: Wiley, 1981, Section 6.5.