> ί : - - f C
HG
S 7 Ô 6 .S
■ISê
S G ó '/ Э Н
C . fINTERDEPENDENCY
BETWEEN ISTANBUL STOCK EXCHANGE AND NEWYORK STOCK EXCHANGE
A THESIS
SUBMITTED TO THE DEPARTMENT OF MANAGEMENT AND THE GIU\DUATE SCHOOL OF BUSINESS ADMINISTRATION
OF BILKENT UNIVERSITY
IN PARTIAL FULFILLMENT OF THE REQUIREMENTS FOR THE DEGREE OF
MASTER OF BUSINESS ADMINISTRATION
BY ASLI BÖKESOY
с 5 q O b . D , % U À 3 Î ) 4 с . i
boafooj
J certify that I have read this thesis and in my opinion it is fully adequate, in scope and quality, as a thesis for the degree of Master of Business Administration.
Assoc. c(ilnm· Muradoğlu
1 certify that I have read this thesis and in my opinion it is fully adequate, in seope and quality, as a thesis for the degree of Master of Business Administration.
i C- (L.
Assist. ProL Ayşe Yüce
1 certify that 1 have read this thesis and in my opinion it is fully adequate, in scope and quality, as a thesis for the degree of Master of Business Administration.
Assoc. Prof Can Siifoga Mugan
Approved by the Graduate Sehool of Business Administration.
ABSTRACT
INTERDEPENDENCE BETWEEN ISTANBUL STOCK EXCHANGE AND
NEWYORK STOCK EXCHANGE
Ash Bökesoy M.B.A.
Supervisor: Assoc. Prof. Giilnur Muradoğlu June 1994, 63 Pages
Globalization of world stock markets and international diversification of securities portfolios are topics that are widely discussed in the recent years. Many markets were analyzed for interdependencies in the literature. This study tests the interdependence between Istanbul Stock Exchange and New York Stock Exchange for the period between April 1992 and December 1993 using daily return indexes. Results of the tests showed that stock price indexes in both markets were nonstationary and that they are interdependent. Therefore, they point out the possibility that the price movements in Istanbul Stock Exchange are affected from the price movements in NewYork Stock Exchange.
ÖZET
İSTANBUL MENKUL KIYMETLER BORSASI VE NEWYORK MENKUL KIYMETLER BORSASI
ARASINDAKİ ETKİLEŞİM
Aslı Bökesoy M.B.A.
Danışman: Doç. Dr. Gülnur Muradoğlu Haziran 1994, 63 Sayfa
Dünya sermaye piyasalarının küreselleşmesi ve uluslararası portfolyo yönetimi son yıllarda sıkça tartılışan konulardandır. Literatürde, pek çok sermaye piyasası etkileşimleri açısından incelenmiştir. Bu çalışmada, İstanbul menkul kıymetler borsası ve NewYork menkul kıymetler borsası Nisan 1992 den Aralık 1993 e kadar günlük indeksler kullanılarak karşılaştırılmıştır. Test sonuçları göstermektedir ki, iki market birbirlerinden etkilenmektedir. Bu sebepten dolayı, sonuç olarak diyebiliriz ki, NewYork menkul kıymetler borsasındaki hareketler İstanbul menkul kıymetler borsasındaki hareketleri etkiler.
ACKNOWLEDGEMENTS
I would like express my gratitude to Assoc. Prof. Giilnur Muradoğlu for her guidance, support and encouragement for the preparation of this thesis. I would like to thank to Assist. Prof. Ayşe Yüce for her corrections, guidance and suggestions. I am grateful to Demet Çetin and Ercüment Bölükbaş and to all my friends for their help and support. Finally, 1 would like to express my special thanks to my family especially to my mother for their support and encouragement during my M.B.A. education and during this study.
TABLE OF CONTENTS
1. INTRODUCTION... 1
2. LITERATURE REVIEW... 3
3. DATA AND METHODOLOGY... 7
3.1. DATA...7
3.2. TESTING PROCEDURE FOR ANALYSING INTERDEPENDENCE... 7
3.3. METHODOLOGY... 8
3.3.1. LINEAR REGRESSION MODEL (TESTING FOR INTERDEPENDENCE)...8
3.3.2. TESTING FOR NONSTATIONARITY... 9
3.3.3. TESTING FOR AUTOCORRELATION... 11
4. RESULTS... 13
4.1. LINEAR REGRESSION (INTERDEPENDENCE ANALYSIS)... 13
4.2. UNIT ROOT TESTS...13
4.3. DURBIN WATSON D TEST...15
5. CONCLUSION... 17
REFERENCES...20
1. INTRODUCTION
International diversification of securities portfolios and globalization of securities markets are topics that are discussed and that received increased attention in recent years. Decontrol of capital Hows, introduction of flexible exchange rates, advanced communications teclmology, computerized trading systems, relaxation of foreign investment ceilings, realized benefits of diversification of capital sources like increased demand and worldwide contacts advantageous for expansion of businesses are some of the factors which have encouraged the globalization of world stock markets.
The benefits of international diversification have been of increasing interest to both investment professionals and academicians. Many studies showed that interdependence of world markets have increased in 1980's. Comovements of stock markets in the United- States, Europe, Japan and some Asian countries have been studied in the literature and the correlation in the movements of the stock prices in these markets were tested. On the other hand, the number of foreign investors in worldwide equity markets have also
increased from one in sixteen in 1979 to one in seven in 1991 (Halpern,1993).
The purpose of this thesis is to analyse the interdependence between Istanbul Stock Exchange and NewYork Stock Exchange for the period between April 1992 and December 1993. Istanbul Stock Exchange, after it has been reorganized in 1986, attracted an increasing attention from domestic and foreign investors and trading volume of securities as well as initial security issues increased sharply since then. The return on
Istanbul Stock Exchange (ISE) also increased significantly reflecting the increase on the demand side. Since ISE is a young and developing market, such an analysis will serve as a tool for comparing the characteristics of the two markets besides helping to clarify the diversification benefits of investing in both markets. This study will also provide
opportunity for investors in forecasting movements in one market by analysing movements in the other.
In this study, ISE indices will be analysed for dependence on NewYork Stock Exchange (NYSE) indices. The testing procedure is as follows, first the regression analysis is performed for calculation of correlation coefficients, then two series are tested for nonstationarity using unit root tests and finally an interdependence test is performed for analysis of a possible common stochastic trend between the two indices.
As a result of this study, if an interdependence is found between ISE and NYSE, this will show the possibility of predicting the future stock prices, of one market by using the stock prices of the other. On the contraiy, if results of the study indicate no interdependence, this result will justify the chance for effective international diversification. An interdependence study will therefore be a useful tool for both domestic and international investors.
2. LITERATURE REVIEW
Globalization of world stock markets, interdependence of the movements in worldwide markets and opportunities for international diversification have been topics which have attracted increasing attention from academicians in last ten years.
The studies concerning the globalization of world markets can be divided into three categories. The first category includes papers discussing the reasons for globalization. An example is Halpern (1993), who discussed the factors that encouraged the integration of worldwide markets. These factors included relaxation in control of international capital flows, recognition of diversification benefits of capital sources by the issuers and increasing number of international investors taking advantage of world capital market opportunities. Besides explaining these factors, Halpern (1993) stated that the integration of world economies and stock ownership have lead to increased correlations across markets which enabled profitable arbitrage opportunities when price movements were large enough to compensate for the transaction costs.
The second group of studies test the possible existance of the correlation or comovements between several markets using many different test procedures. Regression and correlation tests and analysis of random walk behaviour are mainly used by these authors (Jean and Chiang, 1991).
The third group of studies are the ones who apply further tests on comovements of markets. An example is Kaplanis (1988), who examined the stability of the comovement measures of international stock index returns. The author studied ten stock markets and found that the correlation matrix of the stock returns of these markets was stable over
time, while the covariance matrix was less stable. Therefore he examined alternative models for improving covariance forecasts despite the unstable covariance matrix.
In the literature, the United States stock market has been a major market for analysis of interdependence. It has been studied by all the authors who analysed co-integration of stock markets. Many studies have shown that the U.S. market had a significant influence on other markets and that it played a leading role. Some of the studies analysing the U.S. market are summarized below.
The stock market crash of 1987 has been a significant evidence for globalization of stock markets since it showed how close the stock markets were linked together. Price declines in US market which were reflecting reactions to information about the trade deficit , proippted similar declines in markets around the world and as a result a global crash took place. As an article in Wall Street Journal of November 1987 stated, "When New York sneezes, Tokyo and London catch a cold". Many authors including Jean and Furstenberg (1990) and Bertea and Mayer (1990) studied stock markets around the crash.
Jean and Furstenberg (1990), focused on world's four largest stock markets. New York, London, Frankfurt and Tokyo for the period of 1986 tln'ough 1988 in order to analyze the effects of the stock market crash of October 1987. They used daily data and set up a four variable vector auto regression (VAR) system for investigating the interdependence of these markets. They concluded that the degree of international co-movements in stock price indices had increased significantly after the crash.
Bertera and Mayer (1990) analyzed the stock price indices and the structure 23 stock markets including Australia, Hong Kong, Malaysia, Mexico, Singapore, South Africa, New Zealand, Japan, United States and some European countries around the crash of
1987. They compared the size, trading volume and some trade characteristics and analyzed the interrelations between these markets. Their analysis also showed that the corre'lations between all regions increased and remained higher after the crash.
Mathur and Subrahmanyam (1990), discussed interdependencies between the US and Nordic stock markets. They used monthly stock price indices for the period between 1974 to 1985 and examined the data using the concept of Granger causality. They concluded that the United States market affected only one of the four Nordic markets-in Denmark. However, a high interdependence was observed between the Nordic markets and they concluded that it was possible to earn extra returns by anticipating stock price changes in one market by observing the changes in others.
Becker, Finnerty and Gupta (1990) studied the relation between United States and Japanese stock markets using daily data from 1985 to 1988. Because Tokyo is 14 hours ahead of New York, there is about three hour difference between the close of New York stock exchange and the open of Tokyo stock exchange. Regression and correlation results showed that the movements in the United States strongly influenced the Japanese market whereas Japan market has only a slight effect on New York stock exchange. However, profitable trading on Japanese market based on the movements on New York stock exchange was not possible due to the high trading costs in Japan.
Jean and Chiang (1991) analyzed daily stock price indices in the New York, London, Tokyo and Frankfurt stock exchanges during the period from 1975 to 1990. They first tested the hyphotesis that the stock price indices follow unit root processes by the testing procedure proposed by Dickey and Fuller (1981). The test results showed that stock prices for all four markets were nonstationary. Then, they analyzed the common stochastic trends by multivariate co-integration tests. The results showed a common
stochastic trend in the system. They also found evidence for greater globalization of world stock markets during the 1980's and concluded that the globalization of world stock markets is an ongoing process.
Chan, Gup and Pan (1992) analyzed stock prices in the US and major Asian countries (Hong Kong, South Korea, Singapore, Taiwan) using daily and weekly data. First they tested pairwise correlation among these markets. The obtained correlation coefficients were low indicating that international diversification among these markets could be effective. Second, to test for the random walk, they applied Perron-Phillips unit root tests. The null hyphoteses for unit roots in all markets were not rejected indicating the random walk behaviour of indices. Lastly, they applied co-integration tests and no evidence for co-integration between these markets was found. They concluded that international diversification among the tested markets will be effective.
In this thesis, stock price indices of ISE and NYSE are compared. Regression analysis, Dickey-Fuller (1981) unit root tests and Durbin-Watson interdependence test are used for the analysis of a possible existance of a common trend between the two stock exchanges. The results of this study will be useflil because any indication of interdedendence with the U.S. market will show that ISE acting on global basis since U.S. market is the main market influencing many other markets such as many European markets and Tokyo market.
3. DATA AND METHODOLOGY
3.1. Data:
Daily index data for NewYork Stock Exchange Dow Jones index and Istanbul Stock Exchange Composite index were examined for the period between April 1992 and December 1993. Some daily observations were deleted because of different holiday and trading day schedules in Turkey and U.S.. After matching the daily observations, we had 382 observations in both of the markets. The graphs of both indexes are given in Appendix 1.
3.2. Testing Procedure For Analysing Interdependence
For globalized world stock markets, the national stock prices are expected to have a common trend. In integrated markets, market prices are so closely linked that movements in prices in one national market immediately affect stock prices in other markets. This produces comovements of national stock prices through efficient information sharing and free accessibility to markets by domestic as well as foreign investors.
In this study, the testing procedure for analysis of a possible common trend between ISE and NYSE is as follows, first the two stock indices are regressed for analysis of interdependence. Then Dickey-Fuller unit root test is applied for both stock series and lastly the two series are tested for autocorrelation.
The reasoning behind this procedure is simple, regressing one nonstationary series against another can lead to spurious results as conventional significance tests may tend to indicate a relationship between the variables when in fact none exists. Ordinary Least Squares method would not yield a consistent parameter estimator in this case because a nonstationary series will not satisfy the assumptions of linear regression as it does not have a finite variance. This is the reason why testing for nonstationarity is important. If unit root tests fail to reject the hypothesis of a nonstationary' behaviour, further tests for analysing interdependence are necessary to investigate the possible common stochastic trend between the two series.
3.3 Methodology
3.3.1 Linear Regression Model (testing for interdependence):
Linear regression model is as follows; Yi =Bo + BiXj +ei
where
Yj ;dependent variable, ISE Composite index
X[ :independent variable, NYSE Dow Jones index
Bq : intercept
B ] :slope of the regression line ej :errorterm
i ;time for t==0,...,382
The assumptions for regression are as follows; - The mean of the probability distribution of e is 0.
- Variance of the probability distribution of e is constant for all values of the independent variable, X.
- Errors associated with two different observations are independent.
Assessing the usefulness of the linear regression model is as follows, The null hypothesis that the Dow Jones index provides no information for the prediction of ISE Composite index should be tested against the alternative hyphotesis that the two variables are at least linearly related:
Hq: B 1 is equal to zero Ha; B1 is different from zero
3.3.2. Testing For Nonstationarity:
Unit root tests proposed by David Dickey (1981) and Wayne Fuller (1981) are mainly used for testing for nonstationarity. The model used here is as follows, let Y j , which is growing over time, be described by the following equation;
Yt = A + Bt + PYt-i + e t where;
Yt : market return index A : drift variable
B : trend variable t ; time for t=0,...,380 P ; coefficient
There are two possible explanations for explaining the growing characteristic of , one possibility is that growth is because it has a positive trend (B>0) and would be stationary after detrending (i.e., P<1). In this case, could be used in a regression. Another possibility is that Yj has been growing because it is a nonstationary series with a positive drift (i.e., A>0, B=0, P=l). In this case, one would like to work with delta Y j .
Dickey and Fuller (1981) generated statistics for a F-test in order to test for nonstationarity. That is, for testing the hypothesis that B=0 and P=l. The test procedure is as follows ( Kendall, 1990);
Let Y\ be described by the following equation;
Yt - A + Bt + PYt_i +LidYt_i + e j Where
Yt : market return index A : drift
B : coefficient for trend t : time for t=0,...,380 P ; coefficient
e t : error term dYt.i : Yt - i - Yt - 2
The unrestricted equation;
Y f Yt-1 = A + Bt + (P-l)Y t.i +LidYt_i
Yt-Yt-1= A+L|dYt-l
should be rumied and the below F ratio should be calculated;
F = (N-k)(ESSR-ESSuR)/q(ESSuR) Where,
N ; number of observations
k : number of estimated parameters in unrestricted regression q : number of parameter restrictions
ESS : sum of squared residuals
Then, F distributions calculated by Dickey and Fuller (1981) are used for testing the hyphotesis of a nonstationarity(i.e., (A,B,P) = (A,0,1)).
3.3.3. Testing For Autocorrelation:
Durbin-Watson statistic is useful for performing interdependence regression. This statistics tests the following hypothesis;
Hq; No first order autocorrelation of residuals Positive first order autocorrelation of residuals
by the use of d-statistic. This statistic is given by the formula:
d = E ( R t - R t - l ) ' I -- 2 E(R t)' t-2 Where; R^ is defined as R^ = Yt - Yt n ; the number of observations,
4.1. Linear Regression (Interdependence analysis);
Regression results are tabulated below, where ISE is the dependent variable ie. Composite stock index for Istanbul Stock Exchange and NYSE is the independent variable ie. Dow Jones stock index. The resulting t statistic values are so large that the null hypothesis that Bj (Slope of the line) is equal to zero is rejected and it is concluded that two variables are at least linearly related.
4. RESULTS
Table 1 (Results of linear regression)
Equation o f the line: ISE = -84244.87 + 2.681NYSE
INTERCEPT NYSE
C o e ffic ie n t -84244.87 2.681
t S ta tistic -39.33 42.81
R S q u a re 0.8281
F V a lu e 1832.52
4.2. Unit root tests:
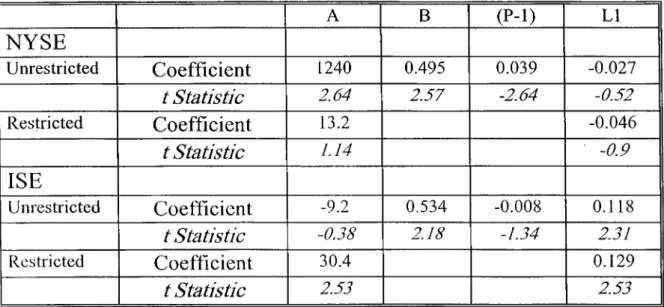
After running Dickey-Fuller unit root tests on ISE and NYSE indexes, (see Appendix 2 ) by first estimating the unrestricted regression and than the restricted equation, the results obtained are summarized in the table below;
Table 2 ( Summary of Dickey-Fuller tests) B
(P-1)
LlNYSE
Unrestricted Coefficient 1240 0.495 0.039 -0.027t Statistic
2.64 2.57 -2.64 -0.52 Restricted Coefficient 13.2 -0.046t Statistic
1.14 -0.9ISE
Unrestricted Coefficient -9.2 0.534 -0.008 0.118t Statistic
-0.38 2.18 -1.34 2.31 Restricted Coefficient 30.4 0.129t Statistic
2.53 2.53In each case, there were 380 observations. The F ratio defined by Dickey and Fuller (1981) to test for unit roots is then calculated by using the error sum of squares (ESS) using the formula given in methodology section. For NYSE the F ratio is (380- 4)(19093630-18726486)/(2)(18726486)=3.78 and for ISE it is (380-4)(20330316-
19973734)/(2)(19973734)=3.35.
Table 3 (Summary of F Ratio calculations)
ESS F Ratio NYSE Unrestricted 18726486 Restricted 19093630 3.78 ISE Unrestricted 19973734 Restricted 20330316 3.35
Comparing these values with the tabulated distribution tor F values (see Appendix 3), it iş apparent that we cannot reject the hypothesis of a nonstationarity for none of the markets even at the 10 percent level. Therefore, we can conclude that the market indexes of ISE and NYSE are consistent with the nonstationarity hypothesis during the period between April 1992 and December 1993.
These findings necessitate further interdependence tests for analysis of the interdependence between NYSE and ISE since market indexes series are nonstationary in both markets. The regression test performed in the first step of the interdependence analysis might not be accurate as regressing one nonstationary series against another could lead to spurious results. Therefore, Durbin-Watson test was performed for analysis of interdependence between the two markets.
4.3. Durbin Watson d Test:
First, residuals were calculated and the autocorrelation of neighboring residuals (time periods t and t+1) was tested using d-statistics in 100 day periods (App.4).
The value of d should always fall in the interval from 0 to 4. The interpretations of the values of d are as follows;
i- If the residuals are uncorrelated, then d=2
ii- 11 the residuals are positively autocorrelated, then d<2 and if the autocorrelation is very strong, then d=0
hi- If the residuals are negatively autocorrelated, then, d>2 and if the autocorrelation is very strong then, d=4
The results obtained for ISE and NYSE are as follows; Table 3 (Results of Durbin-Watson statistics)
Period
d-statistic
9/4/92-24/9/92
0.133828*25/9/92-23/2/93
0.203874*24/2/93-6/8/93
0.197447*9/8/93-8/12/93
0.061722** Significant at 1 percent level
The calculated DW statistic values were compared with tabulated values of d-statistics (see Appendix 5). All calculated d's were smaller than lower (dj^) bounds so it was concluded that there was a high positive autocorrelation between NYSE and ISE
Globalization of world stock markets and interdependencies between several markets have been widely diseussed in recent literature. A number of maeroeconomic and teehnical factors were discussed to have eontributions to the increased interdependencies among national stock exchanges. These factors included growing international cooperation in macroeconomic policy making and a number of technological advances in communications and trading operations.
Parallel to his leading role in the world economy, US. have been the major stoek market whose influence on other markets is analyzed. The influenee of NYSE on many markets including Tokyo, Many European markets and some Asian markets was studied and the results supported the hypothesis that most markets were co-integrated with NYSE.
ISE, after its rapid development in 1980's, was in its way of becoming an international market in 1990's. In November 1993, it was awarded as an "accepted foreign investment market" by the Securities Exchanges Commission (SEC) in US.. The purpose of this thesis is to study the interdependence between NYSE and ISE, which could be a useful tool for both domestie and international investors.
Daily stoek price indexes of NYSE and ISE were analyzed for the period between April 1992 and Deeember 1993. Regression results showed that movements of the two stock indexes were at least linearly related. As a second step, Dickey-Fuller unit root tests were performed for both markets. Results of these tests revealed that market indexes for both markets were nonstationaiy series. In the final step, interdependenee was analyzed using Durbin-Watson test in 100 day periods. The results of this test also supported the hypothesis that the two markets were strongly positively autocorrelated.
5. CONCLUSION
The findings of this study, that ISE is interdependent with NYSE , indicate the possibility to estimate the movements in ISE by examining the movements, in NYSE.
When price movements are small, the costs of buying and selling shares may exceed the . potential gains from international arbitrage, however, in times of big price movements, arbitrage could be more profitable between the two stock exchanges.
The results are also consistent with findings of most authors since NYSE was proved to influence many stock markets and globalization of world stock exchanges was spelled to be an ongoing process.
Additional research should be done in two points, first by investigating the possibility of interdependence of ISE with other international stock markets like London, Tokyo or Frankfurt where mutual trade relationships with Turkey are present, by integrating more than two stock price indexes into analysis and testing for interdependence in a multivariate framework. Secondly, the power of Dickey-Fuller test is discussed to be limited as it only allows us to reject (or fail to reject) the hypothesis that a variable is not' a nonstationary series although this test is widely used in the literature. Several alternative tests and variations of Dickey-Fuller test are proposed by many authors. Accuracy of some proposed tests could be compared for a similar study. The wealaiess of Dickey Fuller tests might also have affected the accuracy of the results in this study. Thirdly, the possibility of a profitable arbitrage between two markets should be investigated by taking several costs like investing in ISE from abroad and getting information about N YSE into consideration. Investing in foreign markets is a totally new concept in Turkey however some broker firms like AT A menkul kiymetler has begun acting in some international markets by opening liason offices in the U.S.. Finally, 382 days is a rather short period when compared with the length of the time series used in the
literature for interdependence analysis. The relationship between the two markets should be analysed for a longer time period for accuracy (at least for 5 years).
REFERENCES
Bailey, W. and Joseph Lim (1992) Evaluating the diversification benefits of the new country funds, The Journal o f Portfolio. Management, 74-80.
Becker, Kent G., J. E. Finnerty and M. Gupta (1990) The intertemporal relation between the US. and Japanese stock markets. The Journal o f Finance, 4, 1297-1306.
Bertero, Elisabetta and C. Mayer (1990) Structure and’ performance: Global interdependence of stock markets around the crash of 1987, European Economic
Review, 34, 1155-1180.
Brealey, Richard A. and S. C. Myers (1991) Principles o f Corporate Finance, Me Graw-Hill, NewYork.
Chan, Kam C., B. E. Gup and M. Pan (1992) An emprical analysis of stock prices in major Asian markets and the United States, The Financial Review, 27, 289-307.
Cochrane, John H. (1991) A critique of the application of unit root tests, Journal o f
Economic Dynamics and Control, 5, 275-284.
Coleman Mark (1990) Cointegration based tests of daily foreign exchange market efficiency. Economic Letters, 32, 53-59.
Copeland, Laurence S. (1991) Cointegration tests with daily exchange rate data, Oxford
Dickey, David A. and W. A. Fuller (1981) Likelihood ratio statistics for autoregressive time series with a unit root, Econometrics, 49, 1057-1072.
Hamao, Yasushi, R. M. Masulis and Victor Ng (1990) Correlations in price changes and volatility aeross international stock markets, The Review o f Financial Studies, 3, 281-307.
Hall, Alastair and K. Hasset (1991) Instrument choiee and tests for a unit root ,
Economic Letters, 35, 161-165.
Flalpern, Philip (1993) Investing abroad: A review of capital market integration and manager performance. The Journal o f Portfolio Management, 47-57.
Jeon, B. N. and T. C. Chiang (1991) A system of stock prices in world stock exchanges: common stochastic trends for 1975-1990?, Journal o f Economies and Business, 43, 329-338.
Jeon, B. N. and G. M. Von Furstenberg (1990) Growing international comovement in stoek price indexes. Quarterly Review o f Economics and Business, 30, 15-30.
Rasa, Kenneth (1992) Common stochastie trends in international stock markets, Journal
o f Monetary Economics, 29, 95-124.
Kendall, M. (1990) The analysis o f economic time series, J. Roy. Statistical Society Series, NewYork.
Lai, Kan S. and M. Lai (1991) A cointegration test for market efficiency. The Journal o f
Futures Markets, 11, 567-575.
Laurence, Martin M. (1986) Weak form efficiency in the Kuala Lumpur and Singapore stock markets. Journal ofBiinking and Finance, 10, 431-445.
Mathur, Ike and V. Subrahmanyam (1990) Interdependencies among the nordic and US. stock markets, Scandinavian Journal o f Economics, 4, 587-597.
McClave, James P. and P. G. Benson (1991) Statistics for Business and Economics, Dellen Publishing company, NewYork.
Pikkarainen, Pentti (1991) International portfolio diversification: The basket peg regime.
Journal o f International M oney and Finance, 10, 432-442.
Unal, Mustafa (1992) Weak form efficiency tests in Istanbul Stock Exchange, MBA Thesis, Bilkent University.
APPENDIX 1
ISE INDEX
20000 -18000 -16000 -14000 >< 12000 -£ 10000 -U1 52 8000 - 6000 - 40 0 0 r 2000+
i 0 --<d· o CM CM CM CM CM CM CM CM CM CM CM CT) O o o O) o CD o CD CD CD \ \ \ \ \ in CD CD rv 00 00 CD o \ \ \ \ 00 CM CD CM o rv 00 T-(N ro CM CM o o o CM CM ro ro ro ro ro ro ro ro ro ro ro ro o .CD G) CD CD CT) CD CD o CD CD CD o \ \ \ \ \ \ \ \ \ \ CM CM r- CM CM ro ro in in CD CD \ \ \ \ \ \ \ \ \ m CD 00 CM CD o ro o «d- in in CD r- CM CM CM r· CM r” CM r “ CM CM 1^ in O) (N ro ro ro ro ro ro ro ro ro ro ro CD CD CD CD G) CD G) CD G) CD CD \ \ \ \ \ \ \ \ 1^ 00 00 00 CD CD o o T” CM \ \ \ \ \ r- T" r- r· CM rv t- •d- 1^ \ \ \ \ CM ro CM 00 r-CM in r-00 CM DateN Y SE i n d e x ro K) C /4 C M C M C M C M C M C M C M C M 00 C O o hO C M ■pi c n 00 o o o o o o o o o o o o o o o o o o o o o o o o o o o o o o o o o 9 / 4 /9 2 2 4 / 4 /9 2 8 / 5 /9 2 2 / 6 /9 2 1 9 / 6 /9 2 2 / 7 /9 2 1 7 / 7 /9 2 3 0 / 7 /9 2 1 7 / 8 /9 2 2 8 / 8 /9 2 1 1 / 9 /9 2 2 4 / 9 /9 2 7 / 1 0 /9 2 2 0 / 1 0 /9 2 5 / 1 1 /9 2 1 8 / 1 1 /9 2 2 / 1 2 /9 2 1 5 / 1 2 /9 2 2 9 / 1 2 /9 2 1 3 / 1 /9 3 2 6 / 1 /9 3 8 / 2 /9 3 2 2 / 2 /9 3 9 / 3 /9 3 2 9 / 3 /9 3 1 3 / 4 /9 3 2 7 / 4 /9 3 1 0 / 5 /9 3 2 4 / 5 /9 3 1 4 / 6 /9 3 2 5 / 6 /9 3 9 / 7 /9 3 2 2 / 7 /9 3 4 / 8 /9 3 1 7 / 8 /9 3 3 1 / 8 /9 3 1 4 / 9 /9 3 2 7 / 9 /9 3 8 / 1 0 /9 3 2 1 / 1 0 /9 3 5 / 1 1 /9 3 1 8 / 1 1 /9 3 2 / 1 2 /9 3 ■< Ui a m X I
Ind ic e s o o o o to o o o o tn o o o o o o o o U1 o o o o CT) o o o o 9 / 4 /9 2 ; 2 4 / 4 /9 2 : 8 / 5 /9 2 : 2 / 6 /9 2 ; 1 9 / 6 /9 2 ; 2 / 7 /9 2 1 7 / 7 /9 2 3 0 / 7 /9 2 1 7 / 8 /9 2 2 8 / 8 /9 2 1 1 / 9 /9 2 2 4 / 9 /9 2 7 / 1 0 /9 2 2 0 / 1 0 /9 2 5 / 1 1 /9 2 1 8 / 1 1 /9 2 2 / 1 2 /9 2 1 5 / 1 2 /9 2 2 9 / 1 2 /9 2 1 3 / 1 /9 3 2 6 / 1 /9 3 8 / 2 /9 3 2 2 / 2 /9 3 9 / 3 /9 3 2 9 / 3 /9 3 1 3 / 4 /9 3 2 7 / 4 /9 3 1 0 / 5 /9 3 2 4 / 5 /9 3 1 4 / 6 /9 3 2 5 / 6 /9 3 9 / 7 /9 3 2 2 / 7 /9 3 4 / 8 /9 3 1 7 / 8 /9 3 3 1 / 8 /9 3 1 4 / 9 /9 3 2 7 / 9 /9 3 8 / 1 0 /9 3 2 1 / 1 0 /9 3 5 / 1 1 /9 3 1 8 / 1 1 /9 3 2 / 1 2 /9 3 0 0 m O Z oo o m 00 ¡2
APPENDIX 2 1 rime 11 12 4027 1 42 -25 4026 2 -1 42 4049 3 23 -1 4 020 4 -29 23 3896 5 -124 -29 3939 6 43 -124 3858 7 -81 43 3813 8 -45 -81 3717 9 -96 -45 3679 10 -38 -96 3691 11 12 -38 3686 12 -5 12 3756 13 70 -5 3760 14 4 70 3704 15 -56 4 3576 16 -128 -56 3596 17 20 -128 3531 18 -65 20 3601 19 70 -65 3701 20 100 70 3714 21 13 100 3219 22 -495 13 3233 23 14 -495 3297 24 64 14 3234 25 -63 64 3198 26 -36 -63 3141 27 -57 -36 3191 28 50 -57 3263 29 72 50 3462 30 199 72 3433 31 -29 199 3453 32 20 -29 3519 33 66 20 3614 34 95 66 3613 35 -1 95 3804 36 191 -1 3840 37 36 191 3942 38 142 36 4291 39 309 142 4313 40 22 309 4365 41 52 22 4407 42 42 52 4442 43 35 42 4 244 44 -198 35 4387 45 143 -198 4512 46 125 143 4 426 47 -86 125 4 384 48 -42 -86 44 0 8 49 24 -42 4254 50 -154 24 4222 51 -32 -154 4237 52 15 -32 4 304 53 67 15 4240 54 -64 67 4143 55 -97 -64 4091 56 -52 -97
42 1 0 59 151 58 4166 60 -44 151 4 200 61 34 -44 4245 62 45 34 4 264 63 19 45 4174 64 -90 19 4069 65 -105 -90 3943 66 -126 -105 3939 67 -4 -126 4062 68 123 -4 4066 69 4 123 4104 70 38 4 4076 71 -28 38 4053 72 -23 -28 4035 73 -18 -23 4013 74 -22 -18 4077 75 64 -22 4031 76 -46 64 4035 77 4 -46 4091 78 56 4 4 048 79 -43 56 4117 80 69 -43 4157 81 40 69 41 6 8 82 11 40 4 204 83 36 11 4207 84 3 36 4142 85 -65 3 42 5 4 86 112 -65 4283 87 29 112 4297 88 14 29 4322 89 25 14 4513 90 191 25 4 446 91 -67 191 4416 92 -30 -67 4312 93 -104 -30 4246 94 -66 -104 4171 95 -75 -66 4212 96 41 -75 4182 97 -30 41 4 090 98 -92 -30 4 144 99 54 -92 4 088 100 -56 54 4004 101 -84 -56 3976 102 -28 -84 4033 103 57 -28 3955 104 -78 57 3919 107 -36 -78 3814 108 -105 -36 3870 109 56 -105 3903 108 33 56 3940 109 37 33 4021 110 81 37 3934 111 -87 81 3916 112 -18 -87 3901 113 -15 -18 3894 114 -7 -15 3790 115 -104 -7 3712 116 -78 -104 3621 117 -91 -78 3537 118 -84 -91
3602 119 65 -84 3633 120 31 65 3642 121 9 31 3380 122 -262 9 3442 123 62 -262 3525 124 83 62 3548 125 23 83 3552 126 4 23 3502 127 -50 4 3565 128 63 -50 3508 129 -57 63 3535 130 27 -57 3534 131 -1 27 3471 132 -63 -1 3479 133 8 -63 3529 134 50 8 3560 135 31 50 3598 136 38 31 3709 137 111 38 3708 138 -1 111 3651 139 -57 -1 3841 140 190 -57 3786 141 -55 190 3883 142 97 -55 3943 143 60 97 3921 144 -22 60 3891 145 -30 -22 3833 146 -58 -30 3856 147 23 -58 3816 148 -40 23 3775 149 -41 -40 3801 150 26 -41 3823 151 22 26 3901 152 78 22 3890 153 -11 78 4 004 154 114 -11 4022 155 18 114 40 3 0 156 8 18 4075 157 45 8 4 094 158 19 45 4 058 159 -36 19 3938 160 -120 -36 3916 161 -22 -120 3955 162 39 -22 4072 163 117 39 4 0 7 8 164 6 117 4125 165 47 6 4 106 166 -19 47 4138 167 32 -19 4163 168 25 32 4145 169 -18 25 4 044 170 -101 -18 4011 171 -33 -101 4085 172 74 -33 4017 173 -68 74 3996 174 -21 -68 4047 175 51 -21 4 094 176 47 51
4207 179 90 55 4287 180 80 90 4 279 181 -8 80 4383 182 104 -8 4551 183 168 104 4 748 184 197 168 4787 185 39 197 4816 186 29 39 4671 187 -145 29 4863 188 192 -145 4972 189 109 192 4943 190 -29 109 5128 191 185 -29 5244 192 116 185 5302 193 58 116 5756 194 454 58 5760 195 4 454 5655 196 -105 4 5922 197 267 -105 5876 198 -46 267 6091 199 215 -46 5923 200 -168 215 5650 201 -273 -168 5637 202 -13 -273 5813 203 176 -13 6027 204 214 176 5883 205 -144 214 5932 206 49 -144 5864 207 -68 49 5654 208 -210 -68 5757 209 103 -210 5792 210 35 103 5620 211 -172 35 5611 212 -9 -172 5588 213 -23 -9 5656 214 68 -23 5764 215 108 68 5861 216 97 108 5864 217 3 97 6070 218 206 3 6307 219 237 206 6544 220 237 237 6740 221 196 237 6733 222 -7 196 6925 223 192 -7 6933 224 8 192 6860 225 -73 8 6967 226 107 -73 7341 227 374 107 6574 228 -767 374 6609 229 35 -767 6921 230 312 35 6914 231 -7 312 7013 232 99 -7 7229 233 216 99 7570 234 341 216 7896 235 326 341 7807 236 -89 326 7805 237 -2 -89 7480 238 -225 -2
7556 239 -24 -225 7505 240 -51 -24 7383 241 -122 -51 7864 242 481 -122 7812 243 -52 481 7952 244 140 -52 8349 245 397 140 8276 246 -73 397 8229 247 -47 -73 8024 248 -205 -47 7919 249 -105 -205 7926 250 7 -105 8008 251 82 7 8201 252 193 82 8045 253 -156 193 8096 254 51 -156 8375 255 279 51 8583 256 208 279 8537 257 -46 208 8687 258 150 -46 8835 259 148 150 9760 260 925 148 9804 261 44 925 9660 262 -144 44 9921 263 261 -144 10460 264 539 261 11140 265 680 539 11276 266 136 680 11412 267 136 136 11607 268 195 136 11338 269 -269 195 10967 270 -371 -269 11109 271 142 -371 10778 272 -331 142 11145 273 367 -331 11794 274 649 367 11328 275 -466 649 11263 276 -65 -466 10789 277 -474 -65 10282 278 -507 -474 10745 279 463 -507 10365 280 -380 463 10144 281 -221 -380 10443 282 229 -221 10617 283 174 299 10450 284 -167 174 10303 285 -147 -167 10166 286 -137 -147 9897 287 -269 -137 9759 288 -138 -269 9370 289 -389 -138 9071 290 -299 -389 9714 291 643 -299 9956 292 242 643 10077 293 121 242 10295 294 218 121 10032 295 -263 218 9868 296 -164 -263
9487 299 ! -142 -86 9643 300 156 -142 9821 301 178 156 9548 302 -273 178 9741 303 193 -273 10199 304 458 193 10354 305 155 458 10448 306 94 155 10915 307 467 94 11149 308 234 467 11189 309 40 234 11370 310 181 40 11671 311 301 181 11776 312 105 301 12020 313 244 105 12357 314 337 244 12171 315 -186 337 12223 316 52 -186 11655 317 -568 52 12526 318 871 -568 12725 319 199 871 12838 320 113 199 12948 321 110 113 13555 322 607 110 13362 323 -193 607 13826 324 464 -193 14026 325 200 464 14459 326 433 200 14126 327 -333 433 14188 328 62 -333 14502 329 314 62 14886 330 384 314 15046 331 160 384 15386 332 340 160 15777 333 391 340 15328 334 -449 391 15079 335 -249 -449 15952 336 873 -249 16243 337 291 873 15862 338 -381 291 15698 339 -164 -381 15596 340 -102 -164 15439 341 -157 -102 14617 342 -822 -157 15241 343 624 -822 15361 344 120 624 15054 345 -307 120 15194 346 140 -307 14928 347 -266 140 14958 348 30 -266 14981 349 23 30 14826 350 -155 23 14320 351 -506 -155 14069 352 -251 -506 13954 353 -115 -251 14500 354 546 -115 13935 355 -565 546 13638 356 -297 -565 13633 357 -5 -297 14136 358 503 -5
14486 359 350 503 15085 360 599 350 14711 361 -374 599 14871 362 160 -374 15197 363 326 160 15177 364 -20 326 15787 365 610 -20 15702 366 -85 610 15789 367 87 -85 16091 368 302 87 16526 369 435 302 16727 370 201 435 16443 371 -284 201 16721 372 278 -284 17426 373 705 278 18426 374 1000 705 18977 375 551 1000 18883 376 -94 551 18675 377 -208 -94 17893 378 -782 -208 17382 379 -511 -782 17335 380 -47 -511 l=ISE Index Ïl=l(t)-I(M ) 12-км )-l(t-2)
APPENDIX 2_______ N :Time İNİ N2 32553 ¡ 1 ΐ 146 : ” 7 304 ' 32699 ! 2 ! 362 ~ Ϊ4 6 3306Î i ...з ’ [ 476 ■ 362 33537 ! 4 ! 128 i 476 33665 Г 5 -302 i 128 33363 i б ί 69 ; -302 33432 i '" Г Г -45 1 69 33387 : 8 i 132 i ___ -45 33519 ! 9 1 -474 T 132~ 33045 I ΐ ο ' Γ 34 T ” ” :474 ' 33079 : 11 i 252 : 34 33331 I ... . ....12 2~60 ' 252 33591 ! 13 1 -208 260 33383 ! 14 1 398 -208 33781 ! 15 i -188 ' 398 33593 16 ! 40 -188 33633 ! 17 1 61 ' 40 33694 1 18 : 281 : 61 3397”5 , 19 ... -124 " ’ 281 ’ 33851 i 20 i 68 ' " '.1~24 33919 i 21 * -114 33805 ' 22 ' -163 -114 ' 33642 ■ 23 i 342 -163 33984 i 24 , -16 342 33968 ; 25 164 -16 34132 i 26 ' -171 164 33961 i 27 : 108 -l7l 34069 1 28 1 -72 108 33997 ^ 29 ' -11 -72 33986 ' 30 ' 55 -11 34041 1 31 1 -205 55 33836 ! 32 ; -542 -205 332’94 ^ 33 ; -417 -542 32877 i 34 1 -136 -417 32741 í 35 ' 112 -136 32853 I 36 1 -45 i 112 32808 , 37 48 -45 32856 38 51 48 32907 I 39 -67 51 32840 40 -16 ' -67 32824 I 41 1 374 i -16 33198 i 42 i Ί 3 374 33185 43 ^ 219 i -13 33404 44 ! -102 ; 219 33302 4Γ " 90 ! -102 33392 46 -441 90 32951 47 -19 1 -441 32932 48 ! 373 -19 33305 1 49 i 68 373 33373 50 210 1 68 33583 i 51 -129 1 210 33454 i 52 i 162 i -129 33616 53 i -300 i 162 33316 54 I -286 ' -300 33030 1 55 ! 54 I -286 33084 i 56 ' -308 ' 54 32776 i 57 i 51 1 -308 32827 58 -3 51
32824 59 111 -3 32935 i 60 ' 386 ΐ ι ΐ 33321 i 'б 1 j ’ 7 " 4 7 0 386 33791 I ... 62 ■ ""İ27 470 ~ 33913" : 63 ! 19 : T2 7 33937 i 64 T -286 i J 9 33651 1 65 i '^ 4 6 -286 33405 i 66 i -84 i -246 33321 j 67 i 54 -84 33375 1 68 I -167 54 33208 ^ ...69 ^ ... -7б”7 ... -167 33132 i 70 1 157 : -7 6 33289 i 71 1 -41 i 157 33248 ! 72 ! 46 1 -41 33294 , 73 i -224 : 46 33070 j 74 : -22 : -224 33048 ' 75 -507 -22 32541 i -305 -507_ ~32236 : 77 1 87 : "-305 32323 78 ! 145 87 32468 . 79 i 78 145 32546 80 ; 130 78 32676 ' 81 -103 130 32573 ; 82 ; 89 -103 ' 32662 i 83 1 241 8 9 ' 32903 i 84 i 19 ‘ ’ 241 ’ 32922 1 85 ' -103 19 32819 ! __86_ : -214 -103 32605 ! 87 T ~ 108 -214 32713 ! 88 1 338 108 33051 ; 89 6 338 ... 3 3 0 5 7 'T 90 705 6 33762 ; 91 -487 . 705 33275 1 92 ! -83 -487 33192 93 i -35 -83 33157 1 94 ! 113 -35 33270_"] 95 ‘ -62 113 332Ö8 1 96 i -400 -62 32808 ¡ 97 ; -22 -400 32786 i 98 ' 92 -22 32878 i 99 1 -375 · 92 32503 100 I 259 -375 32762 101 1 -94 259 32668 102 1 48 : -94 32716 i 103 ! -173 48 32543 104 -537 -173 32006 1 0 5П -216 -537 31790 106 ’ -9 ' -216 31781 107 1 -259 ! -9 31522 108 i 238 : -259 31760 109 ' -395 ; 238 31365 1 1 0 ! 379 1 -395 31744 111 270 i 379 32014 1 1 1 2 1 -60 : 270 31954 ■ 113 i -208 i -60 31746 i 114 ' -2 ' -208 31744 ! 115 i 140 i -2 31884 i 116 i -24 ^ 140
32006 i 119 ' 70 135 32076 : 1 2 0] ...3 6 5 · T o _ 3~2441 i Ï 2 Ï Г ...-84 " i 32357 ' 122 ■ 266 i -84" 32623 T 123 : -99 ' 266 32524 I 124 1 -294 1 -99 32230 I 125 i 208 : -294 32438 i 126 ! -38 ' 208 32400 Г 127 : S i -38 324Ö8 i 128 : -154 ' 8 32254 ; 129 ; 149 ; -154 32408 i 130 i -6 i 149 32397 ¡ 131 i -67 ; -6 32330 i 132 ; 0 ! -67 32330 ! 133 , -397 1 0 3 Î9 3 3 ! 134 ! 140 -397 32073 i 135 i 22 i 140 32095 136 ! 173 1 22 32273 ; 137 ! -43 ! 178 32230 I 138 ; 257 -43 32487 I 139 : 175 i 257 32662 i 140 i 1160 ! 175 33822 ■ 141 ' -771 ' 1160 33051 i 142 ' -108 ! -771 32943 : 143 -81 ; -108 32862 i 144 -97 ' -81 32765 i 145 ! 121 ; -97 32886 i 146 ; 187 121 33073 i 147 : 148 187 33221 148 17 148 33238 149 -165 17 33073 150 -33 -165 33040 ' 151 1 -717 , -33 32323 ‘ 152 ' 520 ' -717 32843 ! 153 ■ -292 520 32551 i 154 i 141 ' -292 32692 i 155 i 440 i 141 33132 i 156 i -8 i 440 33124 I 157 I 87 -8 33211 158 ' -76 : 87 33135 159 11 127 ' -76 33262 160 i 71 1 127 33333 161 1 -225 i 71 33108 i 162 i 103 · -225 33211 Г 163 i -119 ! 103 33092 1 164 i -14 1 -119 33078 ! 165 1 -27 ! -14 33051 1 166 I -362 : -27 32689 167 -173 i -362 32516 ; 1 6 81 65 i -173 32581 169 ; 65 , 65 32646 I 170 ! -11 : 65 32635 1 171 43 1 -11 32678 ; 172 33 ! 43 32711 1 175 38 i 33 32749 ' 173 -190 i 38 32559 i 174 -140 1 -190 32419 1 176 : 1 1 1 ■ -140 32530 1 177 ! 38 i 111 1 32568 ' 178 355 38
32923 : 179 ; 66 355 3*2989 ! 180 1 ” -76 _ ’б6 32913 Ï8 1 T 149 "i I I Z : Z \ 33062 182 1 .... 38']' ’~ Í4 9 3 3 100 I ' л в ъ i' 221 i 38 33321 j -35 " 221 33286 j *185 1 451 ! -35 3'3737 Í 186 ! 430 451 34167 j 187 1 257 i 430 3 4 424 I 188 1 -49 I 257 34375 Í 189 ' -230 ! -49 34145 ! 190_! -21 i -230 3 4 124 1 191 i 102 i -21 3 4226 ' 1 9 2 İ -302 1 102 33924 ; 193 1 -830 ; -302 33094 i 194 Г 27 -830 33121 ' 195 1 -100 ; 27 33021 i 196 ¡ 200 ' -100 33221 ! 197 : 208 , 200 334~2'9 198 j -197 : 2*08 33232 ' 199 333 ; -197' 33565 I...'2 0 0 145 ; 333 3 3 710 ' 201 ' -156 ■ 145 33554 ; 202_J 451 : -156 34005 ! 2Ó3 1 35 1 451 34040 ; 204 i -51 : 35 3 3 9 8 9 ~ r 205 'i 705 1 -51 3 4 694 1 206 ' 27 705 34721 1 207 j 62 ! ....27 34783 ! 208 i -213 34570 ' 209 ! -292 : -213 3 4278 i 210 ' 146 -292 34424 2 1 1 ' -157 146 34267 i 212 ; 9 4 1 -157 34361 ! 213 1 354 I 94 34715 i 214 ! -81 ' 354 34634 i 215 i -83 i -81 34551 j 216 ! 21 ! -83 34572 ! 217 i -221 21 34351 i 218 ^ 43 -221 34394 i 219 ! -686 43 33708 1 220 ! 83 1 -686 33791 221 -16 : 83 33775 222 195 ; -16 33970 223 310 1 195 34280 224 160 1 310 34440 225 113 i 160 34553 226 6 : 113 34559 227 1 227 6 34786 228 i1 -117 1 227 34669 229 1 -235 ! -117 34434 ! 230 -40 i -235 34394 ! 231 -103 i -40 34291 i 232 -308 I -103 33983 233 176 ! -308 34159 234 -24 : 176 34135 235 116 ! -24 34251 i 236 24 ' 116
34461 : 239 30 -3 344~91 ' 240 ^ У ” .. -72 " 30 ' 34419 i ... 2;4l” ^ -48 ; 3 '4371" ! ' ...’ e i ~ 4 s" 34432 243~ ' 255 61 34687 I 244 ; 136 255 34823 ¡ 245 ' -344 ! 136 34479 i 246 : -49 ’ -344 34430 I 247 i 66 -49 34496 ! 248 i -53 : 66 34443 ' 249 ; _ 789 i -53 35232 ! 250 1 -304 ! 789 34928 I 251 1 149 1 -304 35077 ! 252 !" 89 i 149 35166 253 : 235 ; 89 35401 : 254 ! 147 : 235 35548 255 ' -274 ! 147 35274 ' 256 ■ 47 : -274 35321 i 257 : -202 ; 47 35119 ! 258 i -202 -202 34917 ■ 259 ! 133 ! -202 35050 1 260 ¡ 96 133 35146 j 261 i -226 · 96 34920 ; 262 i 196 : -226 35116 1 263 102 Ϊ9 6 35218 ! 264 1 -271 102 34947 ! 265 1 161 1 -271 35108 i 266 ' -133 , 161 34975 ! 267 ^ -307 ^ -133 34668 I 268 i 238 -307 34906 ; 269 2 238 ' 34908 7 270 ; 3 94 ' 2 35302 ; 271 i -114 394 35188 i 272 ! -28 -114 35160 ; 273 ; -55 -28 35105 i 274 i -266 : -55 34839 275 1 -340 i -266 34499 ! 276 1 257 ; -340 34756 277 ' 388 i 257 35144 ' 278 ' 66 ' 388 3521Ö~T 279 ! 33 66 35243 1 280 1 •39 ! 33 35154 i 281 ! 271 -89 35425 282 1 84 i 271 35509 283 -224 ¡ 84 35285 1 284 67 1 -224 35352 ' 285 95 1 67 35447 ii 286 1j 107 1 95 36554 11 287 1 -302 j 107 35252 1 288 215 ; -302 35467 ; 289 ! 210 215 35677 290 -23 1 210 35654 291 -120 1 -23 35534 i 292 i 140 1 -120 35674 ! 293 1 -280 j 140 35394 1 294 1 215 ! -280 35609 295 1 3 1 215 35612 ! 296 i -92 i 3 35520 1 297 ^ -31 i -92 35489 298 115 -31