YAŞAR UNIVERSITY
GRADUATE SCHOOL OF NATURAL AND APPLIED SCIENCES
THE DISTRIBUTION NETWORK MODEL OF PETROLEUM
PRODUCT – NIGERIAN DOWNSTREAM SECTOR AS A CASE
STUDY
Oyewale LAWAL
Thesis Advisor: Asst. Prof. Dr. Ömer ÖZTÜRKOĞLU
Department of Industrial Management and Information Systems
Bornova – İZMİR
This study titled “SUPPLY CHAIN DISTRIBUTION OF OIL DOWN STREAM SECTOR (NIGERIA AS A CASE STUDY)” and presented as M.ScThesis by Oyewale LAWAL has been evaluated in compliance with the relevant provisions of Y.U Graduate Education and Training Regulation and Y.U Institute of Science Education and Training Direction and jury members written below have decided for the defense of this thesis and it has been declared by consensus / majority of votes that the candidate has succeeded in thesis defense examination dated………..
Jury Members: Signature:
Head: ……… ………...
Rapporteur Member: ………. ………
ÖZET
PETROL ÜRÜNÜ İÇİN DAĞITIM AĞ MODELİ - NİJERYA SEKTÖRÜ’NDE VAKA ÇALIŞMASI
LAWAL, Oyewale
Yüksek Lisans Tezi, Endüstriyel Yönetim ve Bilişim Sistemleri Bölümü
Tez Danışmanı: Yrd.Doç.Dr. Ömer Öztürkoğlu
Temmuz 2013, 45 sayfa
Nijerya hem dünyada hem de Afrika’da büyük petrol üreticileri arasında yer almaktadır. Petrol İhraç Eden Ülkeler Örgütü (OPEC)’nün istatistiklerine ve bu topluluk içerisindeki yerine rağmen, Nijerya’nın sürekli olarak benzin yokluğu çekmesi ve tedarik ağını en iyi şekilde oluşturamaması paradoksal bir durum oluşturmaktadır. Böylece, bu tez ülke ekonomisine katkı sağlamak amacıyla petrol ürünlerinin son kullanıcılara etkin kanallar yoluyla en etkin bir şekilde dağıtımını sağlayacak bir model oluşturarak ülkede yaşanılan yoksunluğu incelemek ve bu konuya katkıda bulunmayı amaçlamaktadır. Böylece, bu çalışmada nihai kullanıcılara kadar olan taşıma maliyetlerini düşürmek için tedarikçi ülkelerden eyaletlerde bulunan son kullanıcılara kadarki ağı analiz etmekteyiz. Modelimizde yağmacılık, yıkıcılık, kötü yönetim, altyapıda yaşanılan sıkıntılar gibi üretim krizlerine ve çatışmalarına neden olan unsurları gözönünde bulundurmayıp, mükemmel durum altında modelimizi geliştirdik.En son olarak, Nijerya petrol endüstrisine ait toplanan veriler ile modelimizi çalıştırdık ve sonuçlar gösterdi ki bazı boru hatları en iyi dağıtım yapısında etkin bir şekilde kullanılmamakta, ama ağın bazı bölgelerinde ortaya çıkabilecek bozulmalara karşı dağıtım ağını destekleyici önemli bir rol üstlenmektedir.
ABSTRACT
THE DISTRIBUTION NETWORK MODEL OF PETROLEUM PRODUCT – NIGERIAN DOWNSTREAM SECTOR AS A CASE STUDY
LAWAL, Oyewale
M.Sc, Department of Industrial Management and Information Systems Supervisor: Asst. Prof. Dr. Ömer ÖZTÜRKOĞLU
July 2013,45pages
Nigeria ranks high among the community of oil producers both in Africa and the world at large. It is, therefore, paradoxical that Nigeria, with such profile in Organization of Petroleum Exporting Countries (OPEC) statistics finds it difficult to optimize its supply distribution spending so much money on transportation and experiencing regular fuel scarcity. This thesis thus reviews the petroleum product supply and distribution systems in the country to ascertain the extent to which the system may have contributed to the present product scarcity in Nigeria thus creating a model to effective distribute the product to the end user at the most effective channel to the interest of the economy of the country. Hence, weanalyzes of the distribution network from the supplying country to the end users in the states to reduce the cost of transportation to the door-step of the end user. In our model, we assume a perfect condition in the petroleum industry irrespective of the production crises and conflicts like pipeline vandalism, communal instability, mismanagement and infrastructural dilapidation. Last, we run our model for the collected data of the Nigerian petroleum industry, and the results show that some of the pipelines are not used efficiently in the optimal distribution, but plays an important role to support the the distribution network in case of any distruptions in some part of the network.
ACKNOWLEDGEMENTS
I would like to thank my supervisor Asst. Prof. Dr. Omer Ozturkoglu for his guidance and patience during this study.
TEXT OF OATH
I declare and honestly confirm that my study titled “supply chain distribution of oil downstream sector (Nigeria as a case study)”, and presented as Master’s Thesis has been written without applying to any assistance inconsistent with scientific ethics and traditions and all sources I have benefited from are listed in bibliography and I have benefited from these sources by means of making references.
12/6/2013 Oyewale LAWAL
TABLE OF CONTENTS
Page
ABSTRACT ... ix
ACKNOWLEDGEMENTS ... x
TEXT OF OATH ... xi
TABLE OF CONTENT ... xii
INDEX OF FIGURES ... xvii
INDEX OF TABLES ... xviii
1.0 INTRODUCTION ... 1
1.1 Introduction ... 1
1.2 Scope of the Thesis ... 1
1.3 History of Nigerian Petroleum Industry ... 2
1.4 Sectors in the petroleum Industry ... 2
1.4.1 Upstream Sector ... 3 1.4.2 Downstream Sector ... 3 2.0 LITERATURE REVIEW ... 4 3.0 METHODOLOGY ... 6 3.1 Scope Description ... 6 3.2 Network Description ... 6
TABLE OF CONTENTS (continue) 3.3 Data Collection ... 8
3.3.1 Supply Countries Data... 8
3.3.2 Pipeline Data ... 9
3.3.3 Demand Data ... 9
3.4 Model Formulation ... 12
3.4.1 Model Assumptions ... 12
4.0 RESULTS AND DISCUSSION ... 15
4.1 RESULTS ... 15
4.3 CASE SCENARIO ... 18
5.0 CONCLUSION AND RECOMMENDATIONS ... 21
5.1 Conclusion ... 21
5.2 Recommendation... 21
APPENDIX ... 22
INDEX OF FIGURE
FIGUREPAGE
3.1 Representation of Supply Chain Network of Petroleum Industry
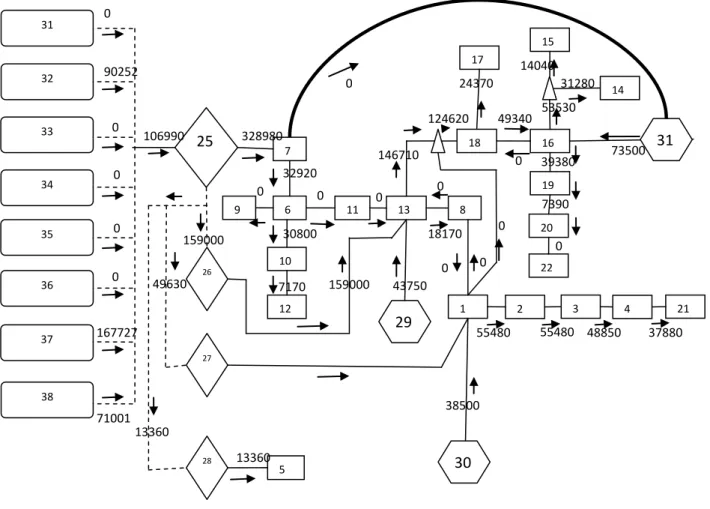
in Nigeria ... 7 4.1 Solution Network of the Product Distribution Solved by AMPL software ... 18
INDEX OF TABLE
TABLE PAGE
3.1 Depot/Pump station Nodes ... 8
3.2 Seaports, Refinery and Supply country nodes ... 8
3.3 Distance between International supply countries to Lagos Port ... 9
3.4 Pipeline distances and Transportation cost ... 10
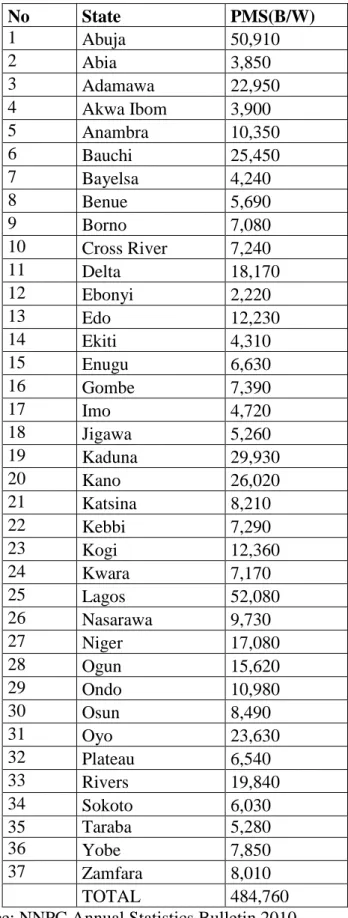
3.5 State Demand of Premium Motor Spirit (PMS) ... 11
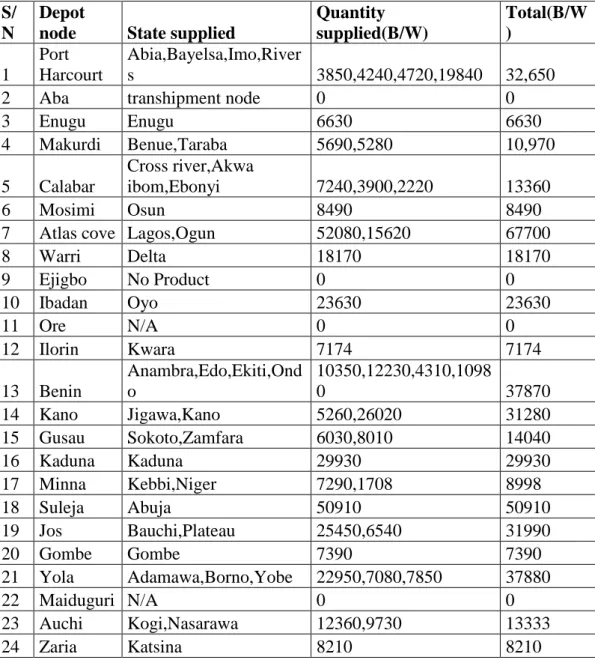
4.1 Result Table highlighting proposed depot capacity ... 17
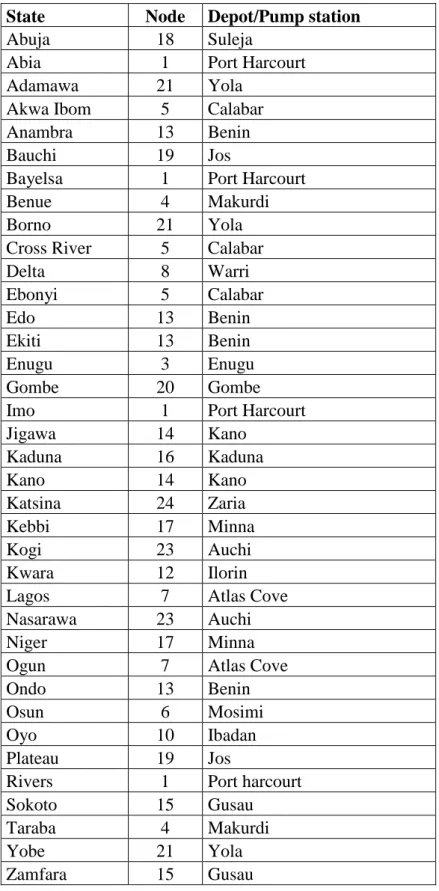
4.2 Depot/Pump station nodes and their recipient States ... 18
CHAPTER 1: INTRODUCTION
1.1 INTRODUCTION
Nigeria is a natural resource abundant country. In particular, over the past fifty years, the country’s oil subsector has grown phenomenally. Both production and exports have increased enormously since commercial production in 1958. For example, crude oil production increased from 395.7 million barrels in 1970 to 776.01 million barrels in 1998. The production increased to 919.3 million barrels in 2006. The Figure however decreased to 777.5million barrels in 2009. In the same way, crude oil exports increased from 139.5 million barrels in 1966 to 807.7 million barrels in 1979(OPEC). The volume of crude oil exports dropped to 390.5 million barrels in 1987 but increased to 675.3 million barrels in 1998. The trend continued for most years after 2000. In the same way, oil revenue increased from 166.6 million Nigerian naira in 1970 to 1, 591,675.00 million Nigerian naira and 6,530,430.00 million Nigerian naira in 2000 and 2008 respectively (Central Bank of Nigeria Statistical Report).
The huge revenues from oil, of course, presented net wealth and thus provided opportunity for increased expenditure and investment; however, the huge revenues complicated macroeconomic management and also made the economy highly oil dependent. In spite of the huge rent from oil, the economy still grapples with rising unemployment and poverty. The dismal performance of the Nigerian economy in the face of huge rents from oil has rekindled interest on the importance of oil in the growth and development process in Nigerian. Hence, the objective of the paper is to examine the effect of minimizing the transportation cost of single product petroleum –Premium Motor Spirit (PMS) relativeto its efficiency in meeting the customer demand using the available transportation network. Specifically, we examine the prospective product availability channels relative to their prices and hence recommend the most reasonable one with the least transportation cost satisfying the demand of the locations considered.
1.2 Scope of the thesis
This thesis is limited to petroleum distribution in Nigeria, the network diagram, parameters and data used in the evaluation are Nigeria sourced, in order to achieving an optimal solution in the distribution of the imported petroleum
product coupled with supply from the local refinery to timely satisfy the demanding population centroid.
1.3History of Nigerian Petroleum Industry
Oil was discovered in Nigeria in 1956 at Oloibiri in the Niger Delta after half a century of exploration. The discovery was made by Shell-BP, at the time the sole concessionaire. Nigeria joined the ranks of oil producers in 1958 when its first oil field came on stream producing 5,100 bpd. After 1960, exploration rights in onshore and offshore areas adjoining the Niger Delta were extended to other foreign companies.
In 1970, the end of the Civil war coincided with the rise in the world oil price, and Nigeria was able to reap instant riches from its oil production. Nigeria joined the Organization of Petroleum Exporting Countries (OPEC) in 1971 and established the Nigerian National Petroleum Company (NNPC) in 1977; a state owned and controlled company which is a major player in both the upstream and downstream.
Following the discovery of crude oil by Shell D’Arcy Petroleum, production began in 1958 from the company’s oil field in Oloibiri in the Eastern Niger Delta. By the late sixties and early seventies, Nigeria had attained a production level of over 2 million barrels of crude oil a day. Although production figures dropped in the eighties due to economic slump, 2004 saw a total rejuvenation of oil production to a record level of 2.5 million barrels per day. Petroleum production and export play a dominant role in Nigeria's economy and account for about 90% of her gross earnings. This dominant role has pushed agriculture, the traditional mainstay of the economy, from the early fifties and sixties, to the background.
1.4 Sectors in the Petroleum Industries
The sectors in the Nigeria petroleum industry are mainly classified into upstream Sector and downstream Sector.
1.4.1 Upstream Sector
The upstream sector involves oil exploration, oil production and gas production through the Joint Venture Operations (JVO). The Joint Operating Agreements (JOA) is the basic, standard agreement between the NNPC and the operators. It sets the guidelines and modalities for running the operations. It is different from the Memorandum of Understanding (MOU). While it contains the basic understanding on the joint Venture, the MOU is a response to the specifics of fiscal incentives. One of the partners is designated the operator. The NNPC reserves the right to become an operator. All parties are to share in the cost of operations. Each partner can lift and separately dispose its interest share of production subject to the payment of Petroleum Profit Tax (PPT) and Royalty. The operator is the one to prepare proposals for program of work and budget of expenditure joint on an annual basis, which shall be shared on holdings.
Each party can opt for and carry on sole risk operations. Technical matters are discussed and policy decisions are taken at operating committees where partners are represented on the basis of equity holding.
There are six Joint Venture Operation (JVO) involved in Oil Exploration which are Shell Petroleum Development Company of Nigeria Limited (SPDC), Chevron Nigeria Limited (CNL), Mobil Producing Nigeria Unlimited (MPNU), Nigerian Agip Oil Company Limited (NAOC), Elf Petroleum Nigeria Limited (EPNL) and Texaco Overseas Petroleum Company of Nigeria Unlimited (TOPCON).
1.4.2 Downstream Sector
Downstream Sector involves three refineries, at Kaduna, Port Harcourt and Warri solely controlled by the NNPC having a combined installed capacity of 445,000 barrels per day, a comprehensive network of pipelines and Depots strategically located throughout Nigeria that links these refineries. NNPC, through its subsidiary, the Pipelines and Products Marketing Company (PPMC), supplies only to bulk customers. They, in turn, meet the needs of millions of customers across the country for products ranging from gasoline and jet fuel to diesel, fuel oil and liquefied petroleum gas.
CHAPTER 2: LITERATURE REVIEW
In Nigeria, the 2003 deregulation of the petroleum industry is expected to give room for competition and maximize supply sources in order to enhance price reduction and deflate scarcity. Nigeriapetroleum industry fall out in meeting the countries petroleum demand due to the inability of the available refinery to run at installedcapacities, prompting importation of the finished petroleum. The private investors were also not willing to take over the dilapidated, disrepair and poorly performed state - owned facilities (refineries, depots and pipeline system). Thus, the industry is so plagued by, not only, low utilization of the refineries, but also inadequate distribution (pipeline, rail and road) networks and storage facilities, increased treasury loss to and poor maintenance of facilities and infrastructure by government, products diversion and adulteration, black-marketing, sabotage by oil cartels, fire incidents, smuggling, as well as inefficient monopolistic approach by the government in controlling the industry. (Oriyoosu, 2007:113-115). Alsoemphasized is the low level of maintenance, investment and non-cost recovery in all the downstream chain (Kupolokun, 2007).
The result widespread petroleum products shortage and unending price hikes are the daily reports bringing untold hardship to the rapid growing Nigerian population. Hence, the low petroleum products from local refineries, inadequacy of the product importation at international prices, and particularly, inefficiency of domestic prices of petroleum product set by the government, stand out as the fore setbacks on the downstream. They are not only affect government treasury via lower prices in relation to international prices and the lump-sum subsidy cost of 420billion naira(Nigerian currency) annually, but it also result to low profit margins to the private investors, hence, causing the widespread shortage. The consequent erratic supply of petroleum product subsequently fuel up systemic failure of the sector by setting the stage for negative outcomes of the markets such as price discrimination, black-marketing, diversion, sabotage, adulteration, smuggling of petroleum product and the ultimate higher prices, hence, a vicious cycle. Nigeria aspires, via the downstream sector, to ensure domestic self-sufficiency as well as efficient supply and distribution system. More compelling is the fact that, in the last decades the nation had continuously witnessed the trauma of petroleum product scarcity and higher prices. Equally, compelling is the need
to develop the gas sector which has the potential of doubling the nation's revenue and to come up with alternative(s) to oil. What is the relationship among petroleum products prices, imports, locally refined, sales and domestic demand and distribution in Nigeria? What is the impact of the supply modes and appropriate pricing on petroleum products distribution in the Nigerian economy? The main objective of this study is to provide an assessment of the supply of petroleum products distributionin Nigeria with Premium motor spirit (PMS) as a case study, with emphasis on the short and long run effects of petroleum product prices, imports, local refineries output and effective distribution of the petroleum product. Therefore, this study will contribute to the issue here-in by, not only providing an expository analysis of the inherentinconsistencies in the downstream sector resulting to the non-sustainability of deregulation policy, but also provide a knowledge-based policy formulation and implementation framework to even-out petroleum product scarcity and higher prices through the most optimal distribution cost via available transportation network.
Alternatively, additional pipeline network could be introduced to the network to appreciable and effective aid the product distribution at relatively reasonable cost.
CHAPTER 3: METHODOLODY
3.1 Scope Description
This study basically focuses on the distribution of petroleum products in the downstream sector of Nigerian Petroleum industry with Premium Motor Spirit (P.M.S.) prices, imported and locally refined as well as the sales as determining variables through the transportation cost at various nodes of the network. This study is not time based; it is a simple, single product problem which is liable to expansion to multi product and time series problems relative to available data. The data for this study depend mainly on secondary sources gotten from Nigerian National Petroleum Corporation (NNPC) Statistical Report, OPEC Report Statistics, Petroleum Products Price Regulatory Agency (PPPRA) Pricing Template, text books and papers presented on related issue which are fully referenced.
3.2 Network Description
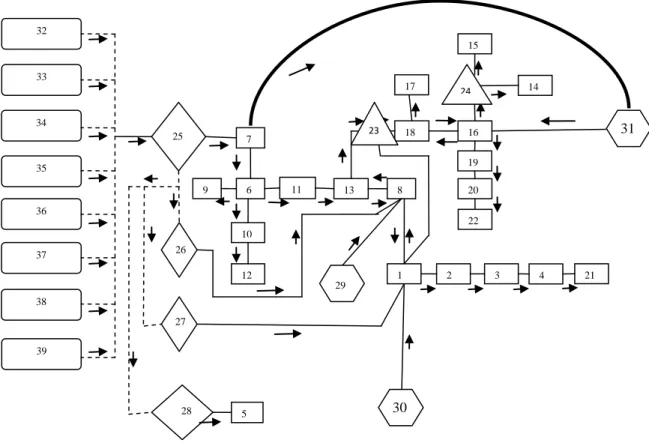
The supply chain distribution of the petroleum industry in Nigeria is represented as a network of nodes (see Figure 3.1). The supplying nodes in the network are the supplying countries and the local refineries. The sea ports serve as transshipment nodes connecting the supplying countries to the depot/pump station nodes. The nodes represent represents supplying countries, seaports, localrefineries, depots/pump stations and states. Supplying countries and local refineries are the supply nodes.There are so many filling stations defined as customers, hence we take the center of mass of each state as the demand node.Seaport and depot/pump station nodes serve as transshipment nodes connecting the supply nodes and demand nodes. The network connects each depot/pump station node to all the states which is not represented on the network diagram for clarification reason.
Figure 3.1 Representation of supply chain network of petroleum industry in Nigeria. 32 33 38 37 36 35 34 39 7 10 8 6 9 12 13 33 33 18 16 15 14 22 20 19 17 1 2 3 4 21 5 30 31 11 25 26 27 28 29 24 23
InFigure 3.1, Nodes 32 to 38 are the supplying country nodes, nodes 25 to 28 are the seaport nodes, nodes 29 to 31 are the refinery nodes while nodes 1 to 24 are the depot/pump station nodes.The dotted lines represents sea transportation, the single line represents pipeline transportation while the thick line represents trucking transportation. Transportation from the depot/pump station nodes is also by trucking transportation. Table 3.1 and Table 3.2 explains what these nodes represent in Nigeria.
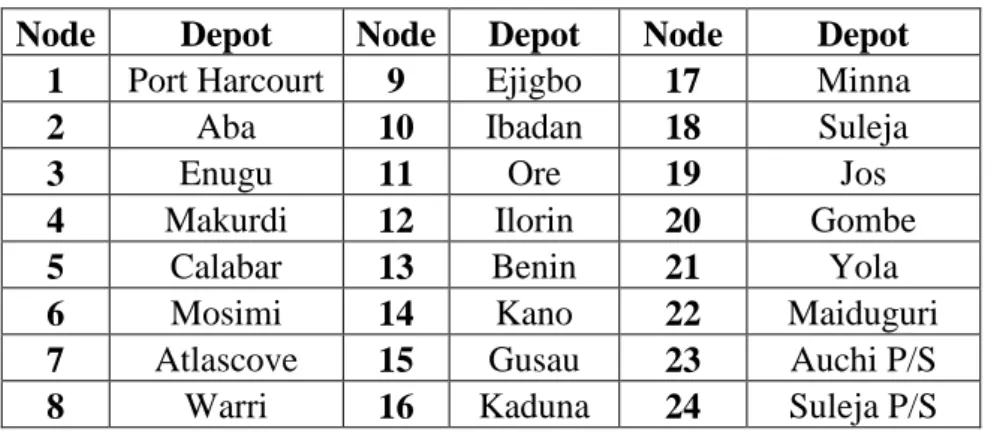
Table 3.1 Depot/pump Station nodes:
Node Depot Node Depot Node Depot 1 Port Harcourt 9 Ejigbo 17 Minna
2 Aba 10 Ibadan 18 Suleja
3 Enugu 11 Ore 19 Jos
4 Makurdi 12 Ilorin 20 Gombe
5 Calabar 13 Benin 21 Yola
6 Mosimi 14 Kano 22 Maiduguri
7 Atlascove 15 Gusau 23 Auchi P/S
8 Warri 16 Kaduna 24 Suleja P/S
Table 3.2Seaport, Refinery and supplying country nodes:
Node Seaport Node Refinery Node
Supplying
country Node
Supplying country
25 Lagos 29 Warri 32 India 36 Netherland
26 Delta 30 P/Harcort 33 France 37 Singapore 27 P/Harcourt 31 Kaduna 34 Italy 38 Portugal
28 Calabar 35 S/Korea 39 Ivory coast
3.3 Data Collection
3.3.1 Supply countries data
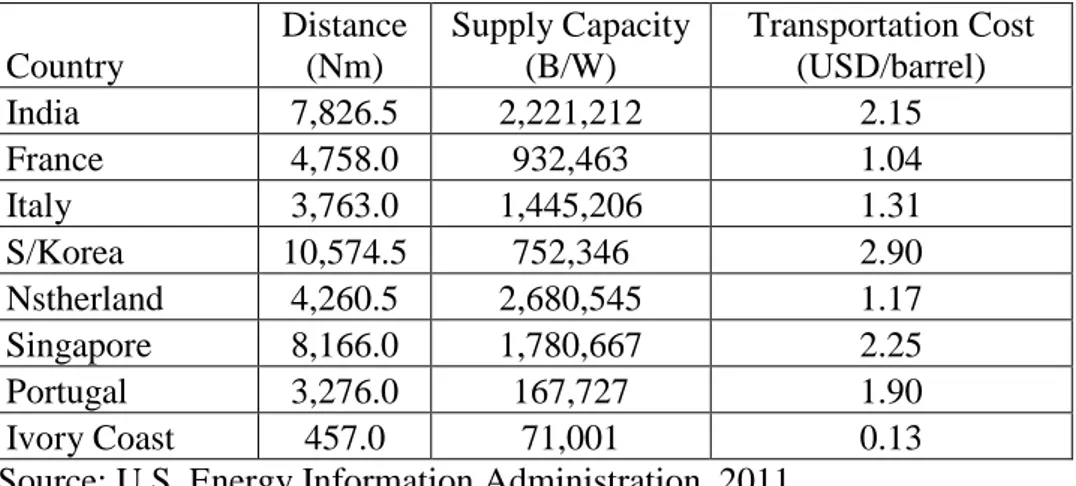
Because of issues in production of finished petroleum product in Nigeria, Nigeria purchases finished products from OPEC countries. In Table 3.3, we show the excess capacity in barrels per week of OPEC countries according to their consumption and production . Table 3.3 also shows the distances in nautical miles (Nm) between these countries and Nigeria, as well the transportation cost in U.S dollar per barrel(USD/barrel).When calculating transportation cost between OPEC countries and Lagos Port, Nigeria, we take real transportation cost between
Nigeria and North western Europe (10 USD/per metric ton) as base, then calculate for others considering distances.
Table 3.3Distances between International Supply Countries to Lagos Port
Country Distance (Nm) Supply Capacity (B/W) Transportation Cost (USD/barrel) India 7,826.5 2,221,212 2.15 France 4,758.0 932,463 1.04 Italy 3,763.0 1,445,206 1.31 S/Korea 10,574.5 752,346 2.90 Nstherland 4,260.5 2,680,545 1.17 Singapore 8,166.0 1,780,667 2.25 Portugal 3,276.0 167,727 1.90 Ivory Coast 457.0 71,001 0.13
Source: U.S. Energy Information Administration, 2011.
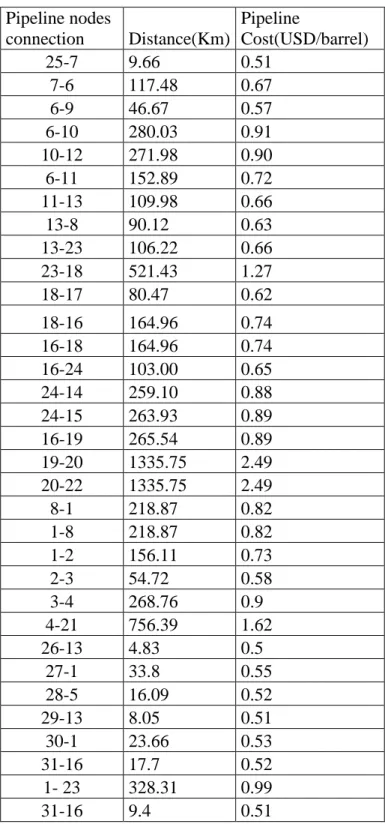
3.3.2 Pipeline Data
The pipeline flow cost between the depot nodes is a function of fixed and variable cost with respect to the length of the pipeline,
Pipeline cost = ).
Using this function, we calculated the pipeline cost between each connected pairs of nodes (see Table 3.4). The distance unit was quoted in the source in miles; hence, the data was converted to kilometers for the sake of our model.
3.3.3 Demand Data
The demand of states is the yardstick for the performance efficiency of the model. Hence the state demand becomes a necessary factor in determining the delivery satisfaction to the state centroid.
Table 3.4 Pipeline distances and transportation cost Pipeline nodes connection Distance(Km) Pipeline Cost(USD/barrel) 25-7 9.66 0.51 7-6 117.48 0.67 6-9 46.67 0.57 6-10 280.03 0.91 10-12 271.98 0.90 6-11 152.89 0.72 11-13 109.98 0.66 13-8 90.12 0.63 13-23 106.22 0.66 23-18 521.43 1.27 18-17 80.47 0.62 18-16 164.96 0.74 16-18 164.96 0.74 16-24 103.00 0.65 24-14 259.10 0.88 24-15 263.93 0.89 16-19 265.54 0.89 19-20 1335.75 2.49 20-22 1335.75 2.49 8-1 218.87 0.82 1-8 218.87 0.82 1-2 156.11 0.73 2-3 54.72 0.58 3-4 268.76 0.9 4-21 756.39 1.62 26-13 4.83 0.5 27-1 33.8 0.55 28-5 16.09 0.52 29-13 8.05 0.51 30-1 23.66 0.53 31-16 17.7 0.52 1- 23 328.31 0.99 31-16 9.4 0.51
Table 3.5 State demand of premium motor spirit (PMS). No State PMS(B/W) 1 Abuja 50,910 2 Abia 3,850 3 Adamawa 22,950 4 Akwa Ibom 3,900 5 Anambra 10,350 6 Bauchi 25,450 7 Bayelsa 4,240 8 Benue 5,690 9 Borno 7,080 10 Cross River 7,240 11 Delta 18,170 12 Ebonyi 2,220 13 Edo 12,230 14 Ekiti 4,310 15 Enugu 6,630 16 Gombe 7,390 17 Imo 4,720 18 Jigawa 5,260 19 Kaduna 29,930 20 Kano 26,020 21 Katsina 8,210 22 Kebbi 7,290 23 Kogi 12,360 24 Kwara 7,170 25 Lagos 52,080 26 Nasarawa 9,730 27 Niger 17,080 28 Ogun 15,620 29 Ondo 10,980 30 Osun 8,490 31 Oyo 23,630 32 Plateau 6,540 33 Rivers 19,840 34 Sokoto 6,030 35 Taraba 5,280 36 Yobe 7,850 37 Zamfara 8,010 TOTAL 484,760
3.4 Model Formulation 3.4.1 Model Assumptions
There are several assumptions that accompany the model. The model is assumed to be multiple sourcing, that is, a particular demand node is met by the best optimally possible supply node(s).The model assumes that the transportation cost on a given route is directly proportional to the distance between supply node and demand node. The depot/pump station node is assumed to have an infinity capacity pending the outcome of the solution of the model. The model also assumes no network breakdown, no pipeline vandalism and no change in price and cost. It’s a single period model; hence the working period in the model is one week.
All nodes are represented in a set where for every node i, depots/pump stations are 1 to p, and p+1 to m are the refinery nodes, seaport nodes and supply country nodes, while for every node j,depots/pump stations are 1 to q, and q+1 to n are the refinery nodes, seaport nodes and supply country nodes.
i = 1, 2...p, (p+1)...m; j = 1, 2... q, (q+1)...n;
k =1, 2...a state population centroid.
m = 1, 2 ...b vessel.
r = 1, 2, 3 vessel routes: for connections 26), 27) and
(25-28)respectively.
The model variables are as follows:
Cij = unit cost of transporting of product from node i to node j;
This include the transportation (shipping) cost from supply countries, pipeline cost within depot connections and trucking cost to node.
Pik= unit cost of trucking of product from node i to state k
This is the trucking cost from the depot/pump station nodes to the corresponding states.
Dk =state demand of the product.
Vm= capacity of each vessel m.
Tr = cycle time for each available vessels on this routes.
Sc =capacity of the supply nodes.
w= working period;
Xij= quantity of product transported from point i to point j Yik= quantity of product transported from point i to k
Ymr= number of trips that each vessel m make through route r
In formulating the model, the objective (Z) is to minimize total cost of transportation of PMS from supplying country and local refineries through depots involving pipeline network to the states. The quantity of product that’s transported from node i to j and vice versa where applicable and the quantity of product transported from node i to state k.
The unit transportation cost ( ) for each node connection is obtained as ( ( ) )
Where = cost factor for transporting each barrel of PMS per location distance between nodes. For all locations, ( > 0). The parameter,
=pipeline distance between nodes.
Likewise,
Where = cost factor for transporting each barrel of PMS per location distance from node to state. For all locations, ( > 0). The parameter,
=trucking distance from node to state.
∑ ∑ ∑ ∑
Equation (1) is the objective function which expresses the goal of the problem. Minimization of the additional cost of transportation from one node to the other connected in the network diagram plus the transportation (trucking) cost from node 1 to 24 to the 37 states.
∑ ∑ ∑
Equation (2) is the demandconstraint, for i and j = 1 to 24 which supplies the state population centroid (k= 1 to 37); node input minus node output is equal to the amount of product supplied to the corresponding state centroid (k).
∑ ∑
Equation (3) is the supply constraint for i and j =25 to 39, summation of input minus summation of output is less than the supply capacities Sc.
∑
Equation (4) is the state demand constraint, for all k = 1, 2 to a, summation of products sent from nodes i = 1 to k is greater or equals to the state demand Dk. Vessel constraint
∑
Equation (5) is the vessel constraint, since we have a working period of 7 days, all vessels have the potential of running on each route at a stipulated period, relative to the travel time (to and fro) each routes. Hence, the total number of trip each vessel (m) make through route r multiply by the cycle time for route is equal to 7. Therefore, [ ] ∑ [ ] ∑ [ ] ∑ b m 1
Product sent between nodes [25-26], [25-27] and [25-28] are less than or equal to summation of number of vessel capacities (Vm) for m=1 to 17 multiply by the
number of trips that vessel m makes through route r = 1, 2 and 3 respectively.
Equation (6) is the non-negativity constraints where all possible decision variables are equal or greater than 0.
CHAPTER 4: RESULT AND DISCUSSION 4.1. RESULTS
The result of this study emphasizes two important factors in the distribution of PMS in the downstream of the Nigerianpetroleum industry to the target customers.
1. The demand of the target customer.
2. The most economical distribution channel considering the transportation costs relative to their distances to achieve considerably cheapest transportation network. As shown in the solution network above, from the importing countries supply node, it is most economical to purchase the product from France, Portugal and Ivory Coast out of the whole eight potential suppliers to compliment the locally refined PMS to satisfy the overall customer demand.
Atlas cove Depot supplies Mosimi depot as connected which in turns supplies Ibadan and Ilorin, but does not supply Ejigbo, Ore, and Benin depots as connect. Benin depot otherwise gets its product from Warri refinery and the supply from Delta sea port to satisfy his environ demands.
The network solution did not create any connection between Warri depot (node 8) and Port Harcourt depot (node 1) as no product is transported to and fro these depots as indicated in the connection. Port Harcourt depot got its products from the Port Harcourt refinery and Port Harcourt sea port to satisfy its attaching depots (nodes 2, 3, 4, and 21).
Kaduna refinery fed Kaduna depot which in turn serve its attaching nodes as seen at the upper right hand of the network. The solution also did not recommend the supply from Lagos to Kaduna refinery considering the high transportation factor. Furthermore, as connected Calabar depot (node 5) is served by Calabar seaport. Since we assume an infinity depot/pump station capacity, hence, from the result; an approximate depot/pump station capacity was suggested by evaluating the node accumulation for recommendations to Nigerian depot managers.
Depot nodes with its capacity equal to 0 is referred to as transshipment nodes as in case of Aba depot (node 2).Table 4.1 shows the resultsthat highlights the states served by each depot and the quantity served.
Figure 4.1 Solutionnetwork of the product distribution solved by AMPL Optimization Software. 31 32 37 36 35 34 33 38 25 7 10 8 6 9 11 12 13 33 33 18 16 15 14 22 20 19 17 1 2 3 4 21 26 27 28 5 30 31 29 0 0 0 0 0 90252 167727 71001 159000 49630 13360 13360 328980 106990 32920 0 0 0 30800 7170 159000 55480 55480 48850 37880 38500 73500 146710 18170 0 0 0 0 43750 124620 24370 0 49340 39380 7390 0 14040 31280 53530 0
4.2 DISCUSSION
Deductively, the Total (B/W) column from Table 4.1 is the depot/pump station capacity in barrels per week, considering these values which are a possible capacity of these depots, there is no need for depot expansion nor pipeline expansion as these delivery capacity is attainable in a week as proposed.
Table 4.1 shows the depot that serves each state relative to their distance and transportation cost to satisfy their demand. Hence it was discovered that nodes 9 and 11 which are Ejigbo depot and Ore Depot are dormant, hence resources channeled to their management could be used to develop other dilapidated infrastructures. Likewise pipeline connection between nodes 1 and 8 - Port Harcourt and Warri did not send any product in either direction .
Table 4.1 Result table highlighting proposed depot capacity. S/
N
Depot
node State supplied
Quantity supplied(B/W) Total(B/W ) 1 Port Harcourt Abia,Bayelsa,Imo,River s 3850,4240,4720,19840 32,650
2 Aba transhipment node 0 0
3 Enugu Enugu 6630 6630 4 Makurdi Benue,Taraba 5690,5280 10,970 5 Calabar Cross river,Akwa ibom,Ebonyi 7240,3900,2220 13360 6 Mosimi Osun 8490 8490
7 Atlas cove Lagos,Ogun 52080,15620 67700
8 Warri Delta 18170 18170 9 Ejigbo No Product 0 0 10 Ibadan Oyo 23630 23630 11 Ore N/A 0 0 12 Ilorin Kwara 7174 7174 13 Benin Anambra,Edo,Ekiti,Ond o 10350,12230,4310,1098 0 37870 14 Kano Jigawa,Kano 5260,26020 31280 15 Gusau Sokoto,Zamfara 6030,8010 14040 16 Kaduna Kaduna 29930 29930 17 Minna Kebbi,Niger 7290,1708 8998 18 Suleja Abuja 50910 50910 19 Jos Bauchi,Plateau 25450,6540 31990 20 Gombe Gombe 7390 7390 21 Yola Adamawa,Borno,Yobe 22950,7080,7850 37880 22 Maiduguri N/A 0 0 23 Auchi Kogi,Nasarawa 12360,9730 13333 24 Zaria Katsina 8210 8210
Table 4.2 Depot/Pump Station Nodes and their recipient State State Node Depot/Pump station
Abuja 18 Suleja
Abia 1 Port Harcourt
Adamawa 21 Yola
Akwa Ibom 5 Calabar
Anambra 13 Benin
Bauchi 19 Jos
Bayelsa 1 Port Harcourt
Benue 4 Makurdi
Borno 21 Yola
Cross River 5 Calabar
Delta 8 Warri Ebonyi 5 Calabar Edo 13 Benin Ekiti 13 Benin Enugu 3 Enugu Gombe 20 Gombe
Imo 1 Port Harcourt
Jigawa 14 Kano Kaduna 16 Kaduna Kano 14 Kano Katsina 24 Zaria Kebbi 17 Minna Kogi 23 Auchi Kwara 12 Ilorin
Lagos 7 Atlas Cove
Nasarawa 23 Auchi
Niger 17 Minna
Ogun 7 Atlas Cove
Ondo 13 Benin
Osun 6 Mosimi
Oyo 10 Ibadan
Plateau 19 Jos
Rivers 1 Port harcourt
Sokoto 15 Gusau
Taraba 4 Makurdi
Yobe 21 Yola
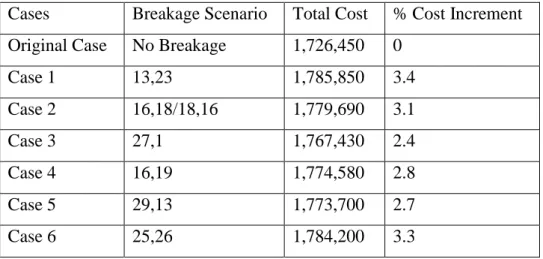
4.3 SCENARIO ANALYSIS
After obtaining the network solution, different breakages scenario in the pipeline network were considered as shown in Table 4.3
Table 4.3 Case Scenario Table
Cases Breakage Scenario Total Cost % Cost Increment Original Case No Breakage 1,726,450 0
Case 1 13,23 1,785,850 3.4 Case 2 16,18/18,16 1,779,690 3.1 Case 3 27,1 1,767,430 2.4 Case 4 16,19 1,774,580 2.8 Case 5 29,13 1,773,700 2.7 Case 6 25,26 1,784,200 3.3
In Case 1, we assume that there is a breakage in the reversible-flow pipeline connection between node 16 and node 18 –Kaduna depot and Suleja depot.It is observed that depots 19, 20 and 22 becomes dormant due to lack of product supply while there initial recipient are served by best alternative depots.The detailed solution can be seen in Table 6.8 and Table 6.9.The solution is represented in Figure 6.1 in the appendix.
Case 3: This scenario occur when there is a breakage in the pipeline connection between node 27 and node 1 –PortHarcourt Seaport and PortHarcourt depot.It is observed that product through other local sea transportation means are increased i.e nodes 26 and 28 to satisfy the recipient of the broken pipeline linkage.The detailed solution can be seen in Table 6.10 and Table 6.11.The network solution is represented in Figure 6.2.
Case 4: This senerio occur when there is a breakage in the pipeline connection between node 16 and node 19 –Kaduna depot and Jos depot.It is observed that the supply chain in the that portion of the network (from nodes 16 to 19 to 20 to 22) remain dormant due to lack of product while the initial recipient are supplied by the best possible alternative.The detailed solution can be seen in Table 6.12 and Table 6.13.The network solution is represented in figure 6.3.
Case 5: This scenario occur when there is a breakage in the pipeline connection between node 29 and node 13 –Warri refinery and Benin depot.Its is observed that flows in the cheapest means of transportationt (local sea transportation) are increased for sufficient flow in the network system to satisfy the initial recipient of the broken pipleline and an increase in the supply of node 33 to compensate for the supply from the broken refinery linkage.The detailed solution can be seen in Table 6.14 and Table 6.15.The network solution is represented in figure 6.4.
Case 6: This scenario occur when there is a breakage in the pipeline connection between node 25 and node 26 –Lagos Seaport and Delta Seaport.It is observed that product flow in the other two local sea port and to node 7 are increased to compensate for the supply deficiency from the broken sea transportation network.The detailed solution can be seen in Table 6.16 and Table 6.17.The network solution is represented in figure 6.5.
5.0 CONCLUSION AND RECOMMENDATION 5.1 Conclusion
Resources saving is an important objective in the industry today, every progressive industry want procure as much saving as possible despite their interest of completing required production which the petroleum industry is not an exemption .Through this model a lot of resources that would be useful in other sector of development could be saved if utilized sighting the fact that only 1,726,450 U.S dollar is required for this product distribution for a period of one week, which would be more exorbitant using any alternative mean.
Furthermore, this model is liable to reasonable manipulation relative to more data availability while it still serve as a saving mechanism to transportation of petroleum product and enhancing prompt delivery as required.
5.2 Recommendation
From this case study, it is advisable to evacuate dormant nodes and pipeline from this network to save enough resources that would be useful in other sector of life in the Nigerian economy, thus saving transportation and distribution cost and reduces or eradicates petrol station long unnecessary queues due to product unavailability. Furthermore, it is recommended that trucking connection (25-31) – trucking from Atlas cove to Kaduna should be an alternation if there is pipeline connection problem like vandalization or leakage, otherwise, it should be abandoned.
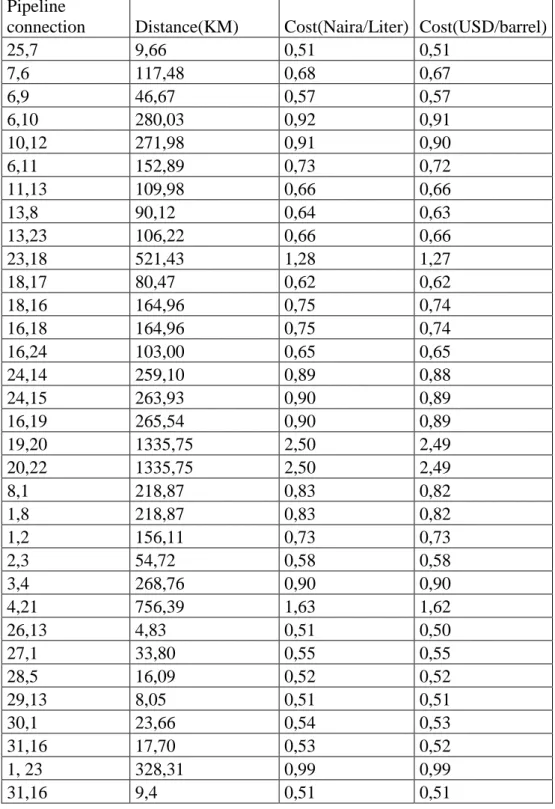
6.0 APPENDIX 6.1. INPUT DATA
Table 6.1 Nodes connections, Distances and Costs (OPEC Annual Statistics
Bulletin 2012)
Pipeline
connection Distance(KM) Cost(Naira/Liter) Cost(USD/barrel)
25,7 9,66 0,51 0,51 7,6 117,48 0,68 0,67 6,9 46,67 0,57 0,57 6,10 280,03 0,92 0,91 10,12 271,98 0,91 0,90 6,11 152,89 0,73 0,72 11,13 109,98 0,66 0,66 13,8 90,12 0,64 0,63 13,23 106,22 0,66 0,66 23,18 521,43 1,28 1,27 18,17 80,47 0,62 0,62 18,16 164,96 0,75 0,74 16,18 164,96 0,75 0,74 16,24 103,00 0,65 0,65 24,14 259,10 0,89 0,88 24,15 263,93 0,90 0,89 16,19 265,54 0,90 0,89 19,20 1335,75 2,50 2,49 20,22 1335,75 2,50 2,49 8,1 218,87 0,83 0,82 1,8 218,87 0,83 0,82 1,2 156,11 0,73 0,73 2,3 54,72 0,58 0,58 3,4 268,76 0,90 0,90 4,21 756,39 1,63 1,62 26,13 4,83 0,51 0,50 27,1 33,80 0,55 0,55 28,5 16,09 0,52 0,52 29,13 8,05 0,51 0,51 30,1 23,66 0,54 0,53 31,16 17,70 0,53 0,52 1, 23 328,31 0,99 0,99 31,16 9,4 0,51 0,51
Table 6.2 Transportation Cost from depots to states centroid ABUJ A ABIA ADAMAWA AKWA IBOM ANAMBR
A BAUCHI BAYELSA BENUE BORNO
CROSS
RIVER DELTA EBONYI EDO
Aba 6,8 0,5 9,4 0,9 2,0 9,2 1,7 4,5 13,0 3,4 2,5 2,0 3,1 PH 7,2 1,2 10,0 1,5 2,3 10,4 1,4 5,1 13,6 4,0 2,2 2,6 3,4 Enugu 4,4 1,6 8,0 2,4 0,9 7,5 3,0 2,8 11,6 2,0 3,2 0,9 2,7 Makurdi 3,1 4,3 6,6 5,1 3,3 4,7 5,7 0,7 10,3 2,5 5,6 2,8 5,1 Calabar 6,9 1,7 9,4 1,2 3,4 9,3 3,4 4,5 13,0 1,6 4,2 2,0 4,7 Warri 6,1 3,0 11,5 3,5 2,5 10,4 1,6 5,9 15,1 5,4 0,3 4,2 1,5 Benin 5,1 3,1 10,9 3,9 1,9 9,4 2,5 5,3 14,5 4,8 1,2 3,6 0,5 Auchi 3,6 3,1 9,6 3,9 2,0 7,9 3,7 3,9 13,5 3,9 2,7 2,8 1,0 Mosimi 7,0 6,7 13,5 7,5 5,5 11,4 6,1 7,7 17,0 8,4 4,8 7,1 4,1 Atlascove 7,9 7,4 14,4 8,2 6,2 12,0 6,8 8,7 17,7 9,1 5,5 7,9 4,8 Satellite 7,9 7,4 14,4 8,2 6,2 12,0 6,8 8,7 17,7 9,1 5,5 7,9 4,8 Ibadan 7,2 7,6 14,6 8,4 6,4 11,0 7,0 8,9 16,6 9,4 5,7 8,1 5,0 Ore 5,5 4,3 12,1 5,1 3,1 9,8 3,7 6,5 15,7 6,0 2,4 4,8 1,7 Ilorin 5,0 6,3 12,4 7,2 5,2 9,4 6,3 6,7 14,4 7,7 5,0 6,6 6,6 Kaduna 2,0 7,8 7,9 8,6 6,3 4,3 8,8 5,3 9,3 7,1 7,8 7,2 6,1 Kano 4,6 10,4 6,8 11,2 8,9 3,6 11,4 7,3 7,4 9,1 10,4 9,9 8,7 Minna 1,7 7,1 9,7 7,9 5,5 6,2 8,0 5,0 11,1 6,8 7,0 6,5 5,3 Suleja 0,6 6,1 8,7 6,9 4,6 5,2 7,1 3,9 10,2 5,7 6,1 5,6 4,4 Zaria 2,9 8,8 7,8 9,6 7,2 4,2 9,7 6,6 8,7 8,4 8,7 8,2 7,0 Gusau 4,9 10,7 9,7 11,5 9,1 6,2 11,6 8,5 10,5 10,3 10,6 10,1 8,9 Jos 2,6 7,6 5,5 8,5 6,7 2,0 9,0 4,1 7,0 5,9 9,0 6,2 7,3 Gombe 5,6 10,2 2,5 11,0 9,7 2,1 12,3 7,2 3,9 8,1 12,1 8,9 10,4 Yola 8,2 9,0 0,2 9,8 9,0 4,9 11,1 6,0 5,0 7,0 11,3 7,7 10,8 Maiduguri 8,8 12,0 4,3 12,7 12,0 4,5 14,0 8,9 0,6 9,9 14,2 10,7 13,7
Table 6.2 Transportation Cost from depots to states centroid (Continue)
EKITI ENUGU GOMBE IMO JIGAWA KADUNA KANO KATSINA KEBBI KOGI KWARA LAGOS
Aba 4,8 2,0 10,9 0,9 12,4 8,4 10,9 11,8 12,0 4,4 7,1 7,4 PH 5,3 2,8 11,5 1,2 12,8 9,1 11,3 11,7 12,6 5,1 7,7 7,2 Enugu 3,5 0,1 9,1 1,7 10,5 6,4 8,9 9,8 10,2 2,7 6,3 7,0 Makurdi 4,6 2,8 6,4 4,4 7,5 5,1 6,7 8,5 10,6 2,8 7,6 8,2 Calabar 6,4 2,9 10,7 2,5 12,1 9,2 11,7 12,6 12,9 5,5 8,7 9,0 Warri 3,2 3,4 12,1 2,4 11,8 7,7 10,2 11,1 10,5 4,1 5,6 5,4 Benin 2,1 2,8 11,1 2,5 10,8 6,7 9,2 10,1 9,4 3,1 4,5 4,3 Auchi 1,7 1,9 9,6 2,5 9,3 5,2 7,7 8,6 9,3 1,6 4,4 5,2 Mosimi 3,1 6,4 13,0 6,1 11,8 7,9 10,2 10,3 8,1 4,9 3,2 0,8 Atlascove 3,8 7,1 13,7 6,9 12,5 8,6 10,9 11,0 8,8 5,9 3,9 0,1 Satellite 3,8 7,1 13,7 6,8 12,4 8,6 10,9 11,0 8,8 5,9 3,9 0,2 Ibadan 3,5 7,3 12,6 7,0 11,4 7,5 9,8 10,0 6,5 5,7 2,9 2,6 Ore 1,7 4,0 11,4 3,7 11,1 6,9 9,6 10,5 8,4 3,4 3,5 2,9 Ilorin 1,6 5,4 10,5 5,8 9,2 6,4 7,7 7,2 5,6 3,5 0,7 3,1 Kaduna 5,7 6,0 5,4 7,7 4,4 0,3 2,8 3,3 6,2 3,7 5,0 8,4 Kano 8,4 8,6 4,3 10,3 1,6 3,8 0,4 1,6 7,0 6,3 7,3 10,7 Minna 3,6 5,3 7,2 6,9 6,3 3,3 4,8 5,2 4,8 2,9 3,3 6,7 Suleja 4,1 4,3 6,2 6,0 5,9 2,2 4,4 4,8 7,0 2,0 4,0 7,4 Zaria 6,7 7,0 5,3 8,6 3,3 2,1 1,7 2,2 5,4 4,6 5,6 9,0 Gusau 7,7 8,9 7,2 10,5 4,5 4,0 3,6 2,2 4,2 6,5 5,7 9,1 Jos 7,0 5,9 3,0 7,7 4,2 1,4 2,8 4,7 8,8 4,9 6,9 10,3 Gombe 10,1 8,9 0,1 11,0 4,4 4,4 4,0 5,8 11,5 8,0 10,0 13,4 Yola 11,0 8,4 2,7 9,8 7,0 7,0 6,6 8,5 14,1 9,5 12,6 14,3 Maiduguri 13,3 11,3 3,4 12,8 4,8 7,6 6,2 8,0 13,3 11,2 13,2 16,6
Table 6.2 Transportation Cost from depots to states centroid (Continue)
NASARAWA NIGER OGUN ONDO OSUN OYO PLATEAU RIVERS SOKOTO TARABA YOBE ZAMFARA
Aba 5,3 9,1 7,3 4,7 5,5 6,4 7,6 0,7 13,4 6,9 11,9 11,8 PH 6,5 9,7 7,4 4,6 5,6 7,3 8,2 0,4 13,8 7,5 12,5 12,2 Enugu 3,5 7,2 6,9 4,3 5,1 6,0 5,8 2,7 11,5 5,5 10,5 9,8 Makurdi 2,9 7,7 8,0 6,7 5,8 6,8 3,1 5,4 10,1 4,1 8,1 8,5 Calabar 6,0 10,0 8,9 6,3 7,1 8,0 7,3 2,4 14,2 6,9 11,8 12,6 Warri 5,8 7,6 5,3 2,7 3,6 4,4 8,9 2,0 12,3 8,9 13,8 11,1 Benin 4,9 6,5 4,2 1,6 2,5 3,3 8,3 3,0 11,2 8,4 12,8 10,1 Auchi 3,4 6,4 5,1 2,4 2,8 3,9 6,4 3,6 10,3 7,1 11,3 8,6 Mosimi 6,7 5,2 0,8 2,0 1,7 1,4 11,3 6,5 9,9 11,0 14,8 8,5 Atlascove 7,6 5,9 0,8 2,7 2,4 2,1 12,0 7,3 10,6 11,9 15,5 9,2 Satellite 7,6 5,9 0,6 2,7 2,4 2,1 12,0 7,2 10,6 11,9 15,5 9,2 Ibadan 7,5 4,8 2,0 2,8 2,2 0,4 10,9 7,4 9,6 12,1 14,4 8,2 Ore 7,9 5,4 3,2 0,3 1,4 3,0 9,5 4,2 10,6 9,6 13,2 8,8 Ilorin 7,2 2,7 3,0 2,7 1,6 2,0 8,8 6,7 7,8 9,9 12,2 6,0 Kaduna 4,2 3,8 8,4 6,8 7,0 7,3 4,4 8,7 5,4 7,6 7,3 3,7 Kano 5,8 5,9 10,6 9,4 9,2 9,6 5,0 11,3 5,2 8,7 5,0 3,5 Minna 4,0 2,3 6,7 4,9 4,4 5,6 5,5 7,9 7,0 8,1 8,9 4,3 Suleja 2,8 4,0 7,4 5,1 5,3 6,3 4,5 7,0 6,9 7,0 8,0 5,3 Zaria 5,0 4,2 9,0 7,8 7,5 7,9 4,5 9,6 4,3 7,7 6,2 2,6 Gusau 7,0 3,4 9,1 8,7 7,6 8,0 6,4 11,5 2,4 9,7 8,0 0,8 Jos 2,5 6,3 10,2 8,0 8,2 9,2 0,5 8,7 6,8 5,2 4,8 5,2 Gombe 5,5 7,9 13,3 11,2 11,3 12,3 3,2 12,0 9,6 4,4 2,8 7,9 Yola 6,8 10,5 14,4 12,2 12,1 14,0 4,3 10,8 12,2 3,2 3,8 10,5 Maiduguri 8,7 11,0 16,6 15,1 14,5 15,5 6,8 13,8 11,6 6,2 1,5 10,0
Table 6.3 Time statistics it takes for Vessels to travel from Lagos ports to local ports Lagos port to Travel time(days) return time(days) Av. Waiting time(days) Loading and offloading time(days) Total time (days) Delta port 0,7 0,455 1,34 0,66 3,155 PortHarcourt 1,3 0,845 1,34 0,66 4,145 Calabar port 1,6 1,04 1,34 0,66 4,64
The total time is the time it takes vessel m to travel from Lagos port to the local ports in the network. The total time is the accumulation of the travel time, return time which is evaluated at 65% of the travel time due to the zero content of the vessels at the traveling period, waiting times; both at the loading point and at the discharge point, and the loading and offloading times.
Table 6.4 Supply countries distance and cost calculation
SUPPLYING COUNTRIES DISTANCE (NM) TRANSPORTATION COST/MT(U.S $) TRANSPORTATION COST (USD/BARREL) INDIA 7826.5 18.37 2.15 FRANCE 3790 8.90 1.04 ITALY 4758 11.20 1.31 S/KOREA 10547.5 24.76 2.90 NETHERLAND 4260.5 10.00 1.17 SINGAPORE 8166 19.20 2.25 PORTUGAL 3276 7.70 0.90 IVORY COAST 457 1.10 0.13
Using the conversion rates; 1 Metric ton = 8.53 Barrels, while the transportation cost is 10 Metric ton from North western Europe which Netherland is a member. (Source; Nigerian House of Assembly Ad-hoc committee report on subsidy, 2012)
Table 6.5 Distance from Lagos to Local seaports
Lagos Calabar Delta(Pennington) Port Harcourt
Lagos 0 391 166 311
Calabar 391 0 226 159
Delta(Pennington) 166 226 0 149
Table 6.6 Transportation cost from Lagos to local sea ports
Lagos Calabar Delta(Pennington) Port Harcourt
Lagos 0,00 0,11 0,05 0,09
Calabar 0,11 0,00 0,06 0,04
Delta(Pennington) 0,05 0,06 0,00 0,04
Port Harcourt 0,09 0,04 0,04 0,00
Table 6.7 Available Vessels (Barges) and their Capacity
Vessel Name Vessel Owner Capacity(MT)
Capacity (BARREL)
DESIRE I Runner Marine LTD. 2974 25368,2
DESIRE II Runner Marine LTD. 4272 36440,2
DERA I Runner Marine LTD. 3808 32482,2
DERA II Runner Marine LTD. 2674 22809,2
MARVEL I Runner Marine LTD. 4746 40483,4
PRAISE I Runner Marine LTD. 2432 20745
PRAISE II Runner Marine LTD. 2440 20813,2
MNEMOSYNE Saje Shipping NIG. LTD. 4393 37472,3 SAJE 460 Saje Shipping NIG. LTD. 8926 76138,8
HERA Saje Shipping NIG. LTD. 5811 49567,8
KIRIKIRI
Saje Shipping NIG.
LTD.. 6574 56076,2
DEMETRA Saje Shipping NIG. LTD. 2191 18689,2
S215 Saje Shipping NIG. LTD. 10379 88532,9
RHEA Saje Shipping NIG. LTD. 4398 37514,9
HESTIA Saje Shipping NIG. LTD. 6574 56076,2 ENERGY 7001 Ringardas NIG. LTD. 3186 27176,6 ENERGY 6503 Ringardas NIG. LTD. 2897 24711,4
6.2. Results of Scenario Analysis
Figure 6.1 : Network solution of Case 1 Scenario
32 33 38 37 36 35 34 39 25 7 10 8 6 9 11 12 13 33 33 18 16 15 14 22 20 19 17 1 2 3 4 21 2 6 2 7 2 8 5 30 31 29 0 0 0 0 0 90252 167727 71001 147800 60830 13360 13360 106990 328980 39290 0 0 0 30800 7170 147800 66680 66680 60050 45270 38500 73500 135510 18170 0 0 0 0 0 113420 24370 0 0 28180 0 0 14040 31280 45320 0 24 23
Table 6.8: Case 1 Depot –state Analysis I
S/N Depot node State supplied Quantity supplied(B/W) Total(B/W)
1
Port
Harcourt Abia,Bayelsa,Imo,Rivers 3850,4240,4720,19840 32,650
2 Aba transhipment node 0 0
3 Enugu Enugu 6630 6630 4 Makurdi Benue,Taraba,Plateau 5690,5280,3810 14,780 5 Calabar Cross river,Akwa ibom,Ebonyi 7240,3900,2220 13360 6 Mosimi Osun 8490 8490
7 Atlas cove Lagos,Ogun 52080,15620 67700
8 Warri Delta 18170 18170 9 Ejigbo No Product 0 0 10 Ibadan Oyo 23630 23630 11 Ore N/A 0 0 12 Ilorin Kwara 7170 7170 13 Benin Anambra,Edo,Ekiti,Ondo 10350,12230,4310,10980 37870 14 Kano Jigawa,Kano 5260,26020 31280 15 Gusau Sokoto,Zamfara 6030,8010 14040 16 Kaduna Kaduna 0 29930 17 Minna Kebbi,Niger 7290,17080 24370 18 Suleja Abuja,Kaduna,Katsina 50910,29930,8210 89050 19 Jos Bauchi,Plateau 25450,2730 28180 20 Gombe No Product 0 0 21 Yola Adamawa,Borno,Yobe 22950,7080,7850,7390 45270 22 Maiduguri N/A 0 0 23 Auchi Kogi,Nasarawa 12360,9730 22090 24 Zaria Katsina 0 0
Table 6.9 Case 1 Depot –state Analysis II
State Node Depot/Pump station
Abuja 18 Suleja
Abia 1 Port Harcourt
Adamawa 21 Yola
Akwa Ibom 5 Calabar
Anambra 13 Benin
Bauchi 19 Jos
Bayelsa 1 Port Harcourt
Benue 4 Makurdi
Borno 21 Yola
Cross River 5 Calabar
Delta 8 Warri Ebonyi 5 Calabar Edo 13 Benin Ekiti 13 Benin Enugu 3 Enugu Gombe 21 Yola
Imo 1 Port Harcourt
Jigawa 14 Kano Kaduna 18 Suleja Kano 14 Kano Katsina 18 Suleja Kebbi 17 Minna Kogi 23 Auchi Kwara 12 Ilorin
Lagos 7 Atlas Cove
Nasarawa 23 Auchi
Niger 17 Minna
Ogun 7 Atlas Cove
Ondo 13 Benin
Osun 6 Mosimi
Oyo 10 Ibadan
Plateau 4,19 Makurdi,Jos
Rivers 1 Port Harcourt
Sokoto 15 Gusau
Taraba 4 Makurdi
Yobe 21 Yola
Figure 6.2: Network solution of Case 2 Scenario 32 33 38 37 36 35 34 39 25 7 10 8 6 9 11 12 13 33 33 18 16 15 14 22 20 19 17 1 2 3 4 21 2 6 2 7 2 8 5 30 31 29 0 0 0 0 0 90252 167727 71001 199500 0 22490 22490 106990 328980 39290 0 0 0 30800 7170 199500 28640 28640 28640 22950 38500 73500 168270 32390 0 0 0 9980 43700 139550 24370 0 64270 54310 14470 7080 14040 31280 53530 0 24 23
Table 6.10 Case 2 Depot –state Analysis I
S/N
Depot
node State supplied
Quantity
supplied(B/W) Total 1
Port
Harcourt Rivers 19840 19840
2 Aba transhipment node 0 0
3 Enugu No Product 0 0
4 Makurdi Benue 5690 5690
5 Calabar
Abia, Akwa ibom, Cross river, Ebonyi,Taraba 3850,3900,7240, 2220,5280 22490 6 Mosimi Osun 8490 8490 7 Atlas cove Lagos,Ogun 52080,15620 53642 8 Warri Bayelsa 4240 4240 9 Ejigbo Delta 18170 18170 10 Ibadan Oyo 23630 23630 11 Ore N/A 0 0 12 Ilorin Kwara 7170 7170 13 Benin Anambra,Edo,Ekiti, Imo,Ondo 10350,12230,4310, 4720,10980 42590 14 Kano Jigawa,Kano 5260,26020 31280 15 Gusau Sokoto,Zamfara 6030,8010 14040 16 Kaduna Kaduna 29930 29930 17 Minna Kebbi,Niger 7290,17080 24370 18 Suleja Abuja 50910 50910 19 Jos Bauchi,Plateau,Yobe 25450,6540,7850 39840 20 Gombe Gombe 7390 7390 21 Yola Adamawa 22950 22950 22 Maiduguri Borno 7080 7080 23 Auchi Enugu,Kogi,Nasarawa 6630,12360,9730 28720 24 Zaria Katsina 8210 8210
Table 6.11 Case 2 Depot –state Analysis II
State Node Depot/Pump station
Abuja 18 Suleja
Abia 1 Port Harcourt
Adamawa 21 Yola
Akwa Ibom 5 Calabar
Anambra 13 Benin
Bauchi 19 Jos
Bayelsa 1 Port Harcourt
Benue 4 Makurdi
Borno 21 Yola
Cross River 5 Calabar
Delta 8 Warri Ebonyi 5 Calabar Edo 13 Benin Ekiti 13 Benin Enugu 3 Enugu Gombe 21 Yola
Imo 1 Port Harcourt
Jigawa 14 Kano Kaduna 16 Kaduna Kano 14 Kano Katsina 24 Zaria Kebbi 17 Minna Kogi 23 Auchi Kwara 12 Ilorin
Lagos 7 Atlas Cove
Nasarawa 23 Auchi
Niger 17 Minna
Ogun 7 Atlas Cove
Ondo 13 Benin
Osun 6 Mosimi
Oyo 10 Ibadan
Plateau 4 Makurdi
Rivers 1 Port Harcourt
Sokoto 15 Gusau
Taraba 4 Makurdi
Yobe 21 Yola
Figure 6.3: Network solution of Case 3 Scenario 32 33 38 37 36 35 34 39 25 7 10 8 6 9 11 12 13 33 33 18 16 15 14 22 20 19 17 1 2 3 4 21 2 6 2 7 2 8 5 30 31 29 0 0 0 0 0 90252 167727 71001 145070 63560 13360 13360 106990 328980 39390 0 0 0 30800 7170 145070 69410 69410 62780 45270 38500 73500 132780 18170 0 0 0 0 43750 110690 24370 0 354120 0 0 0 14040 31280 53530 0 24 23
Table 6.12 Case 3 Depot –state Analysis I
S/N
Depot
node State supplied
Quantity supplied(B/W) Total 1 Port Harcourt Abia,Bayelsa,Imo ,Rivers 3850,4240,4720,19840 32650
2 Aba transhipment node 0 0
3 Enugu Enugu 6630 6630 4 Makurdi Benue,Plateau,Taraba 5690,6540,5280 17510 5 Calabar Akwa ibom,Cross river, Ebonyi 3900,7240,2220 17210 6 Mosimi Osun 8490 8490
7 Atlas cove Lagos,Ogun 52080,15620 53642
8 Warri Delta 18170 18170 9 Ejigbo No Product 0 0 10 Ibadan Oyo 23630 23630 11 Ore N/A 0 0 12 Ilorin Kwara 7170 7170 13 Benin Anambra,Edo,Ekiti ,Imo,Ondo 10350,12230,4310, 4720,10980 42590 14 Kano Jigawa,Kano 5260,26020 31280 15 Gusau Sokoto,Zamfara 6030,8010 14040 16 Kaduna Bauchi,Kaduna 25450,29930 55380 17 Minna Kebbi,Niger 7290,17080 24370 18 Suleja Abuja 50910 50910 19 Jos No Product 0 0 20 Gombe No Product 0 0 21 Yola Adamawa,Borno, Gombe,Yobe 22950,7080,7390, 7850 45270 22 Maiduguri No Product 0 0 23 Auchi Kogi,Nasarawa 12360,9730 22090 24 Zaria Katsina 8210 8210
Table 6.13 Case 3 Depot –state Analysis II
State Node Depot/Pump station
Abuja 18 Suleja
Abia 1 Port Harcourt
Adamawa 21 Yola
Akwa Ibom 5 Calabar
Anambra 13 Benin
Bauchi 16 Kaduna
Bayelsa 1 Port Harcourt
Benue 4 Makurdi
Borno 21 Yola
Cross River 5 Calabar
Delta 8 Warri Ebonyi 5 Calabar Edo 13 Benin Ekiti 13 Benin Enugu 3 Enugu Gombe 21 Yola
Imo 1 Port Harcourt
Jigawa 14 Kano Kaduna 16 Kaduna Kano 14 Kano Katsina 24 Zaria Kebbi 17 Minna Kogi 23 Auchi Kwara 12 Ilorin
Lagos 7 Atlas Cove
Nasarawa 23 Auchi
Niger 17 Minna
Ogun 7 Atlas Cove
Ondo 13 Benin
Osun 6 Mosimi
Oyo 10 Ibadan
Plateau 4 Makurdi
Rivers 1 Port Harcourt
Sokoto 15 Gusau
Taraba 4 Makurdi
Yobe 21 Yola
Figure 6.4: Network solution of Case 4 Scenario 32 33 38 37 36 35 34 39 25 7 10 8 6 9 11 12 13 33 33 18 16 15 14 22 20 19 17 1 2 3 4 21 2 6 2 7 2 8 5 30 31 29 0 0 0 0 0 134002 167727 71001 202750 49630 13360 13360 106990 372730 39290 0 0 0 30800 7170 202750 55480 55480 48850 37880 38500 73500 146710 18170 0 0 0 0 00 124620 24370 0 49340 39380 7390 0 14040 31280 53530 0 24 23
Table 6.14 Case 4 Depot –state Analysis I
S/N
Depot
node State supplied
Quantity supplied(B/W) Total(B/W) 1 Port Harcourt Abia,Bayelsa,Imo,Rivers 3850,4240,4720, 19840 32650
2 Aba transhipment node 0 0
3 Enugu Enugu 6630 6630
4 Makurdi Benue, Taraba 5690 ,5280 10970
5 Calabar
Akwa ibom,Cross river,
Ebonyi 3900,7240,2220 17210 6 Mosimi Osun 8490 8490 7 Atlas cove Lagos,Ogun 52080,15620 53642 8 Warri Delta 18170 18170 9 Ejigbo No Product 0 0 10 Ibadan Oyo 23630 23630 11 Ore N/A 0 0 12 Ilorin Kwara 7170 7170 13 Benin Anambra,Edo,Ekiti,Ondo 10350,12230,4310 ,10980 37870 14 Kano Jigawa,Kano 5260,26020 31280 15 Gusau Sokoto,Zamfara 6030,8010 14040 16 Kaduna Kaduna 29930 29930 17 Minna Kebbi,Niger 7290,17080 24370 18 Suleja Abuja 50910 50910 19 Jos Bauchi,Plateau 25450,6540 31990 20 Gombe Gombe 7390 7390 21 Yola Adamawa,Borno,Yobe 22950,7080 ,7850 37880 22 Maiduguri No Product 0 0 23 Auchi Kogi,Nasarawa 12360,9730 22090 24 Zaria Katsina 8210 8210
Table 6.15 Case 4 Depot –state Analysis II
State Node Depot/Pump station
Abuja 18 Suleja
Abia 1 Port Harcourt
Adamawa 21 Yola
Akwa Ibom 5 Calabar
Anambra 13 Benin
Bauchi 19 Jos
Bayelsa 1 Port Harcourt
Benue 4 Makurdi
Borno 21 Yola
Cross River 5 Calabar
Delta 8 Warri Ebonyi 5 Calabar Edo 13 Benin Ekiti 13 Benin Enugu 3 Enugu Gombe 20 Gombe
Imo 1 Port Harcourt
Jigawa 14 Kano Kaduna 16 Kaduna Kano 14 Kano Katsina 24 Zaria Kebbi 17 Minna Kogi 23 Auchi Kwara 12 Ilorin
Lagos 7 Atlas Cove
Nasarawa 23 Auchi
Niger 17 Ilorin
Ogun 7 Atlas Cove
Ondo 13 Benin
Osun 6 Mosimi
Oyo 10 Ibadan
Plateau 19 Jos
Rivers 1 Port Harcourt
Sokoto 15 Gusau
Taraba 4 Makurdi
Yobe 21 Yola
Figure 6.5: Network solution of Case 5 Scenario 32 33 38 37 36 35 34 39 25 7 10 8 6 9 11 12 13 33 33 18 16 15 14 22 20 19 17 1 2 3 4 21 2 6 2 7 2 8 5 30 31 29 0 0 0 0 0 90252 167727 71001 0 180570 13360 13360 135050 328980 67350 0 10890 0 47880 24250 0 65830 65830 48850 37880 38500 73500 27210 0 0 18170 0 102420 0 43750 107540 7290 0 49340 39380 7390 0 14040 31280 53530 0 24 23
Table 6.16: Case 5 Depot –state Analysis
S/N
Depot
node State supplied
Quantity supplied(B/W) Total(B/W) 1 Port Harcourt Abia,Bayelsa,Imo,Rivers 3850,4240,4720, 19840 32650
2 Aba transhipment node 0 0
3 Enugu Anambra,Enugu 10350,6630 16980
4 Makurdi Benue, Taraba 5690 ,5280 10970
5 Calabar
Akwa ibom,Cross river,
Ebonyi 3900,7240,2220 17210
6 Mosimi Osun 8490 8490
7 Atlas cove Lagos,Ogun 52080,15620 53642
8 Warri Delta 18170 18170 9 Ejigbo No Product 0 0 10 Ibadan Oyo 23630 23630 11 Ore Ondo 10980 10980 12 Ilorin Kwara,Niger 7170,17080 24250 13 Benin Edo,Ekiti 12230,4310 16540 14 Kano Jigawa,Kano 5260,26020 31280 15 Gusau Sokoto,Zamfara 6030,8010 14040 16 Kaduna Kaduna 29930 29930 17 Minna Kebbi 7290 7290 18 Suleja Abuja 50910 50910 19 Jos Bauchi,Plateau 25450,6540 31990 20 Gombe Gombe 7390 7390 21 Yola Adamawa,Borno,Yobe 22950,7080 ,7850 37880 22 Maiduguri No Product 0 0 23 Auchi Kogi,Nasarawa 12360,9730 22090 24 Zaria Katsina 8210 8210
Table 6.17 : Case 5 Depot –state Analysis II
State Node Depot/Pump station
Abuja 18 Suleja
Abia 1 Port Harcourt
Adamawa 21 Yola
Akwa Ibom 5 Calabar
Anambra 3 Enugu
Bauchi 19 Jos
Bayelsa 1 Port Harcourt
Benue 4 Makurdi
Borno 21 Yola
Cross River 5 Calabar
Delta 8 Warri Ebonyi 5 Calabar Edo 13 Benin Ekiti 13 Benin Enugu 3 Enugu Gombe 20 Gombe
Imo 1 Port Harcourt
Jigawa 14 Kano Kaduna 16 Kaduna Kano 14 Kano Katsina 24 Zaria Kebbi 17 Minna Kogi 23 Auchi Kwara 12 Ilorin
Lagos 7 Atlas Cove
Nasarawa 23 Auchi
Niger 12 Ilorin
Ogun 7 Atlas Cove
Ondo 11 Ore
Osun 6 Mosimi
Oyo 10 Ibadan
Plateau 19 Jos
Rivers 1 Port Harcourt
Sokoto 15 Gusau
Taraba 4 Makurdi
Yobe 21 Yola
REFERENCES
Nigerian National Petroleum Corporation (NNPC),2010- Annual Statistic Bulletin(Oil and Gas) .
Organization of the Petroleum Exporting Countries (OPEC),2012- Annual Statistic Bulletin.
Mehring, J.S and Gutterman, M.M “Supply and Distribution Planning
Support for Amoco Interfaces Volume,20, No.4.1990 pp.95-104.
Madueke,D.,Issues in petroleum products distribution chain –This day newspaper,11 Nov.
Osi S. Akpoghomeh,Dele Badejo,2006.Petroleum product scarcity: a
review of the supply and distribution of petroleum distribution products in Nigeria- wiley online library,8 Mar.
Philips, A.O and Osayinwese, I. (1977): On the 1978 Increases in the
Retail Prices of Petroleum Products,The Nigerian Journal of Economics
and Social Studies, NES, vol 19(3), Nov. 1997, Pp. 307 –324
Garba, A.G. (2000): Deregulation of the Petroleum Industry in the context
of globalization and Nigeria’sexternal debt, Being a paper presented at the
One-Day Seminar of the Nigerian Economic Society(NES), held on April 18, 2000 at the Federal Palace Hotel, Victoria Island, Lagos.
Dantizig, G.B “Application of the simplex method to a transportation
problem” chapter (23), in Koopmans 1951b pp.359-373
AMPL Optimization LLC,copyright,2007.
Robert F.,David M.G.,Brain W.K., A Modeling Language for
Mathematical Programming, The scientific Press, South San Francisco,
CA 94080-7014
Nigeria House of Assembly 2012,Report of the Ad-Hoc committe to verify
and determine the actual subsidy requirements and monitor the implementation of the subsidy regime in Nigeria.
Chineme O.,Nigerian Refinery rated worst among 42 African
Refineries:Thisday Newspaper:13,Nov.,2012.