464
New Trends and Issues
Proceedings on Humanities
and Social Sciences
ISSN 2421-8030 www.prosoc.eu
Issue 3 (2017) 464-476
Selected paper of 5th Cyprus International Conference On Educational Research (Cyicer-2016) 31 March-02 April 2016, University Of Kyrenia, Kyrenia North Cyprus
The Effects Of Educational Games, Feedback And Correction On The
Learning Level And The Retention Of Knowledge
Bekir Yildirim a*, Mus Alparslan Universiy , Mus Alparslan University Campus, Rector, Diyarbakir Road 7 km 49250- Mus, 49250, Turkey
Ali Murat Sunbul b , Necmettin Erbakan University, Nisantasi Mah., Ph.D. Mehmet Hulusi Baybal Cd. No: 12, 42060 Selcuklu / Konya, Turkey
Suggested Citation:
Yildirim, B. & Sunbul, A. M. (2016). The Effects of Educational Games, Feedback And Correction On The Learning Level And The Retention Of Knowledge. New Trends and Issues Proceedings on Humanities and Social Sciences [Online]. 00, pp 464-476. Available from: www.prosoc.eu
Selection and peer review under responsibility of Assist. Prof. Dr. Cigdem Hursen, Near East University ©
2017 SciencePark Research, Organization & Counseling. All rights reserved.
Abstract
The effects of educational games and feedback-correction on the success of 6th grade students and the retention of the knowledge were investigated in this study. 6th grade students in a secondary school in Meram district of Konya comprise the study sample. Two classes of 6th grade with equal probability in this secondary school were determined as the experimental group while another class of 6th grade was determined as the control group. The electricity and systems unit was taught for 4 hours per week for 10 weeks by means of educational games in the experimental group 1, by means of educational games and feedback-correction in the experimental group 2 and according to the current MNE (Ministry of National Education) curriculum in the control group. The learning level test developed by the Yildirim (2015) was used in the study to measure the learning levels of the students and the retention of the knowledge. T-test and one way ANOVA were applied for independent and dependent groups. According to the findings obtained in the study, it was statistically determined that the educational games and feedback-correction applied in the experimental group 2 and educational games applied in the experimental group 1 were more effective in terms of retention of knowledge and learning levels compared to the current curriculum applied in the control group. On the other hand, it was also statistically determined that teaching by means of educational games, which was the method used for the experimental group 1, increased the learning level compared to the control group, on which the current curriculum was applied; however, there was no difference in terms of retention of the knowledge.
Keywords: Games, Educational Games, Feedback-Correction, Learning Level, Retention
* ADDRESS FOR CORRESPONDENCE: Bekir Yildirim, Mus Alparslan Universiy, Mus Alparslan University Campus, Rector, Diyarbakir Road 7 km 49250- MUS, 49250, Turkey
1. Introduction
Technology and science are advancing under the light of knowledge. These advances spread from the west to east and from the south to north as a result of cultural interactions. According to these advances, the need for knowledge increases and individuals learn new information, produce new information from the information they learn and cover their needs in daily life under the light of such information. Individuals need to obtain the information by researching and questioning rather than having it in a passive manner in order to cover their needs in the daily life. For this reason, individuals needed methods and models through which they will actively obtain the information instead of passively acquiring it.
Individuals developed and still carry on developing different teaching-learning approaches according to their needs. Individuals obtained information thanks to these approaches and applied this information to their daily lives. One of these approaches is Teaching by Means of Educational Games.On the other hand, providing feedback to students and correcting their mislearning, if any, play an important role for the learning process.
According Varisoglu, Seref, Gedik and Yilmaz (2013), educational games are defined as the whole of activities affecting the physical, mental and spiritual development of a child positively, creating feelings of happiness and joy in children and giving them good behaviors and habits. Educational games were considered as a method which ensures the retention and reinforcement of the knowledge that was learned and allows it to be repeated in more comfortable environments. Educational games are classified in different ways due to these qualities. This classification is made in a wide range since educational games have a versatile nature. In this context, educational games are classified in two according to (i) the ways they are applied and (ii) the purpose for playing and making students play them.
According to another classification, educational games are divided into three groups by their purpose of being played and making students play them. (i) Fun oriented educational games, (ii) Education oriented educational games, (iii) Health oriented educational games.
On the other hand, using educational games in education has many benefits. These are, respectively; (i) They ensure that students actively participate in the process. (ii) They make the lesson and the subject more interesting. (iii) They ensure that the information that is learned is prepared in a fun environment and become permanent this way. (iv) They make it easier to remember the information that is learned. (v) They are supportive in terms of reaching the objectives of the lesson.
In additional to these, other benefits and superior aspects of educational games (Sel, 1987: 5) are that (i) They help students satisfy their emotional needs. They help nervous kids to relax and angry kids to calm down. (ii) They make the new things to be learned easier and more meaningfully. (iii) They ensure that the things learned before (information, skills and abilities) are used. (iv) The drive for playing games is satisfied thanks to this technique.
As in many methods and techniques, there are some limitations with educational games, too. Some of those limitations are specified below (Demirel, 1999: page 123). These are, respectively, as follows; (i) The application of this technique requires more attention, creativity, imagination, joking skills and synthesis power. (ii) Developing criteria to measure what the games teach requires certain education. (iii) The games may cause the thought of "who will win" to emerge and dominate the situation by turning into a competitive environment.
The general aim of this study is to determine the effect of educational games and feedback-correction activities in the 6th grade science lesson on the learning level of the students and the retention of the knowledge. The problem sentence intended for this purpose was specified as "What is the effect of educational games and feedback-correction activities in the science lessons of
secondary school 6th grade on the learning level of the students and the retention of the knowledge?”. The problem sentence is comprised of six sub-problems.
1. Is there a significant difference in favor of experimental group 2 between the learning levels of the students in the experimental group 1, on whom teaching by educational games approach was applied, and the students in the experimental group 2, on whom teaching by educational games and feedback-correction approach was applied, after the application?
2. Is there a significant difference in terms of learning level learning in favor of the experimental group 1 between the students in the experimental group 1, on whom teaching by educational games approach was applied, and the students in the control group?
3. Is there a significant difference in terms of learning level learning in favor of the experimental group 2 group between the students in the experimental group 2, on whom teaching by educational games and feedback-correction approach was applied, and the students in the control group?
4. Is there a significant difference in favor of experimental group 2 group in terms of the retention of knowledge between the experimental group 1, on whom teaching by educational games approach was applied and the experimental group 2 where teaching by educational games and feedback-correction were applied?
5. Is there a significant difference in terms of the retention of knowledge in favor of the experimental group 1 between the students in the experimental group 1, on whom teaching by educational games approach was applied, and the students in the control group?
6. Is there a significant difference in terms of the retention of knowledge in favor of the experimental group 2 group between the students in the experimental group 2, on whom teaching by educational games and feedback-correction approach was applied, and the students in the control group?
2. Method
2.1.The Study Model
This study, which aims to determine the effect of educational games and teaching based on feedback and corrections on the learning levels and the retention of knowledge in science lessons, is a quantitative study. The study was designed and conducted according to pretest-post-test model with a control group which is one of the experimental models. There are three groups formed by means of selection with equal probability method in this design. Two of these groups were assigned as experimental groups while the other one was assigned as the control group. Measurements were conducted before and after the experiments in all three groups. Independent variables of the study are educational games and feedback and correction activities.
2.2.Study Group
The study group is composed of 6th grade students attending the 6B, 6C and 6D sections of the Konya Meram Telafer Middle School in the second term of 2013-2014 academic year. The experimental and control groups are determined with isoprobability assignment method. 6D (17 girls, 17 boys) is assigned as the control, 6C (15 girls, 16 boys) and 6D (14 girls, 14 boys) are assigned as the experimental groups.
6C class became the experimental group 1, on which activities based on educational games would be done, while 6B class became the experimental group 2 group, on which activities based on educational games and feedback-correction would be done. On the other hand, activities predicted in the current teaching curriculum of the science lesson were done in 6D class.
The following criteria were taken into consideration in equalizing the experimental and control groups.
1. Learning Level Test and Pretest Results
2. Science Lesson grades by the End of the First Semester
Criteria determined above were used to determine whether the working group was at a similar level or not. One way factor analysis (One Way ANOVA) is applied to test whether or not the difference between two or more unrelated samples are significantly different from zero (Buyukozturk, 2011). Statistical data regarding the study group are specified in Table 1, Table 2, Table 3 and Table 4.
Tablo 1. Distribution of the Study Group by Gender Cinsiyet
Female Male Total
6B (Experimental 2 Group) N 14 14 28
6C (Experimental 1 Group) N 15 16 31
6D (Control Group) N 17 17 34
As shown in the table 1, The experimental group 1 was comprised of 31 students while the
experimental group 2 group was comprised of 28 students and the control group was comprised of 34 students. In addition to that, it can be said that the numbers of girls and boys in the groups were close to each other.
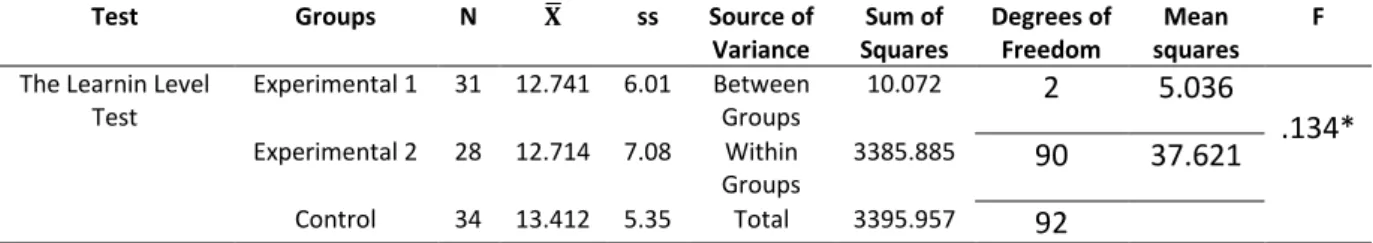
Tablo 2. Descriptive Statistics and ANOVA Results According to Pretest Results Obtained from the Groups
Test Groups N ̅ ss Source of
Variance Sum of Squares Degrees of Freedom Mean squares F The Learnin Level
Test Experimental 1 31 12.741 6.01 Between Groups 10.072 2 5.036 .134* Experimental 2 28 12.714 7.08 Within Groups 3385.885 90 37.621 Control 34 13.412 5.35 Total 3395.957 92 *p>,05
As shown in the table 2, when the results of the ANOVA performed to compare the learning levels of the groups are taken into consideration, it is seen that there is no significant difference between pretest scores that the students in both the experimental and the control groups got from the “Learning Level Test” (p>,05). Therefore, it can be said that the pretest scores of the experimental and control groups were equal.
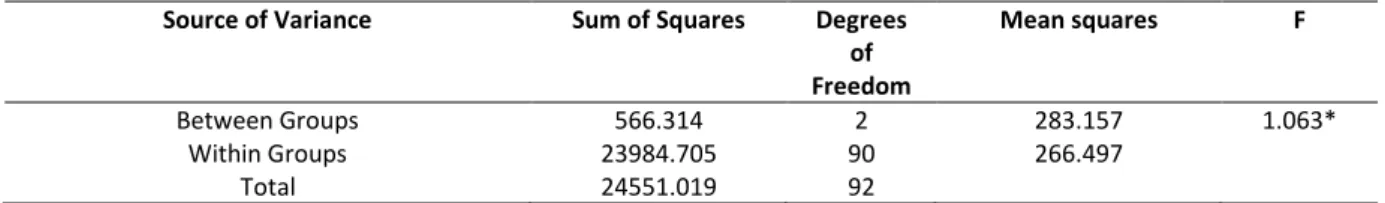
Tablo 3.One way ANOVA results for the first semester grades of the groups Source of Variance Sum of Squares Degrees
of Freedom Mean squares F Between Groups 566.314 2 283.157 1.063* Within Groups 23984.705 90 266.497 Total 24551.019 92 *p>,05
As shown in the table 3, he grades students in groups got in science course in the first semester were not significantly different. According to these results, it can be said that the pretest scores of the experimental and control groups were equal.
2.3. Data Collection Tools
It was necessary to collect two types of data in order to fulfill the purpose of the study. These types of data are related to (i) students’ science lesson learning levels and (ii) the retention of students' science lesson knowledge Science Lesson Learning Level Test was used for collecting the data in the first and the second items.
Feedback-Correction Tests with Learning Level Test:
Learning Level Test developed by the researcher was used to measure the learning levels of the
students while Feedback-Correction Tests were used to determine incomplete or inaccurate learning of the students. These tests include the subjects that sixth grade students learned in "Electricity and Systems" unit. Firstly, subject analysis was made during the test development stage for the tests that were prepared to be able to represent the relevant unit, the unit analysis table was prepared after this subject analysis and finally a table of specifications was prepared in accordance with the unit analysis table. Learning Level Test: This test is made up of 50 questions on Electricity and Systems unit. Opinions of the experts were taken for the learning level test formed of 50 questions and learning level test was given its final form according to these opinions. After the experts' opinions were taken, item analysis works regarding learning level test were made with 310 6th graders. KR-20 reliability coefficient of the test was determined as 0.86 (n=310).
As a result of the study, the reliability coefficient of the feedback-correction tests was determined as 65 for the follow-up test coefficient which contains the electricity unit, as 68 for the circulatory system test, as 64 for the respiratory system test and as 69 for the support motion system. The fact that the reliability coefficients of these tests are low can be explained with the low variance of the group.
2.4. Data Collection Process
The research data was collected during 2013-2014 spring semester period. Accordingly, measurement tools used in this study started to be prepared. Findings obtained for the theoretical part as a result of literature scanning were used in the application stage of the study. The learning level test developed by the researcher was used as the pretest, post-test and retention test in the experimental part. Data is comprised of information obtained from this test.
2.5. Data Analysis
One way variance analysis (ANOVA) was used to determine whether or not there is a significant difference between the learning level scores of the students in the experimental group 2, on whom educational games and feedback-correction approach was applied, the students in the experimental group 1, on whom learning by educational games approach was applied, and the students in the control group before and after the experiments. Tukey test, which is a paired comparison technique, was used in order to determine from which groups the significant difference between the groups sourced. In addition to that, descriptive statistics method was used in order to show the relationship between groups.
3. Findings
Educational games and feedback and correction approaches were applied in this study and findings of the study obtained with the assessment tools and comments on these findings are presented in this section.
Sub-problem 1: Post-test mean scores of the groups and the standard deviations of the groups
were calculated to answer the question "Is there a significant difference in favor of experimental group 2 between the learning levels of the students in the experimental group 1, on whom teaching by educational games approach was applied, and the students in the experimental group 2, on whom teaching by educational games and feedback-correction approach was applied, after the application?" and the significance of the post-test mean scores of the groups was checked by means of t test.
Table 4.Independent Groups t-Test Results of the Posttest Scores of the Experimental 1 and 2 Groups
Group N ̅ S sd t
Experimental 1 31 22.613 6.706 57 2.990*
Experimental 2 28 27.821 6.656
*p<.05 (The mean difference is significant at the .05 level)
As shown in the table 4, it can be observed that there is a statistically significant difference between the sciences course learning level scores of students in the experimental 1 and 2 groups (t(57)=2.990;
p<,05). When the mean learning level scores of the groups are examined, it can be observed that the mean scores of the experimental 2 group ( ̅=27.821) is higher than the experimental 1 group ( ̅= 22.613).
Sub-problem 2: The second sub-problem of the study was determined as Is there a significant
difference in terms of learning level learning in favor of the experimental group 1 between the students in the experimental group 1, on whom teaching by educational games approach was applied, and the students in the control group? and the significance of the post-test mean scores of the groups was checked by means of t test.
Table 5.Independent Groups t-Test Results of the Posttest Scores of the Experimental 1 and Control Groups
Gruplar N ̅ S sd t
Experimental 1 31 22.613 6.706 63 3.549*
Control 34 17.206 5.564
*p<.05
As shown in the table 5, it can be observed that there is a statistically significant difference between the sciences course learning level scores of students in the experimental 1 and 2 groups (t(63)=3.549;
p<,05). When the mean learning level scores of the groups are examined, it can be observed that the mean scores of the experimental 1 group ( ̅=22.613) is higher than the control group ( ̅= 17.206).
Sub Problem 3: Is there a significant difference in terms of learning level learning in favor of the
experimental group 2 group between the students in the experimental group 2, on whom teaching by educational games and feedback-correction approach was applied, and the students in the control group? and the significance of the post-test mean scores of the groups was checked by means of t test.
Table 6.Independent Groups t-Test Results of the Posttest Scores of the Experimental 2 and Control Groups
Gruplar N ̅ S sd t
Experimental 2 28 27.821 6.656 60 6.842*
Control 34 17.206 5.564
*p<.05 (The mean difference is significant at the .05 level)
As shown in the table 6, it can be observed that there is a statistically significant difference between the science course learning level scores of students in the experimental 2 and control groups (t(60)=6.842; p<,05). When the mean learning level scores of the groups are examined, it can be
observed that the mean scores of the experimental 2 group ( X =27.821) is higher than the control group ( X =17.203). Thus, it can be said that the significant difference in learning level scores is in favor of the experimental 2 group and the learning level of the students in the experimental 2 group were higher at the end of the process.
Table 7. Descriptive Statistics and ANOVA Results According to Post-test Results Obtained from the Groups Test Groups N ̅ ss Source of
Variance Sum of Squares Degrees of Freedom Mean squares F Anlamli fark The Learnin Level Test Experimental 1 31 22.61 6.707 Between Groups 1738.097 2 869.049 21.927* 1-2 Experimental 2 28 27.82 6.656 Within Groups 3567.021 90 39.634 1-3 Control 34 17.21 5.564 Total 5305.118 92 2-3
*p<.05 (The mean difference is significant at the .05 level)
As a result of the methods that was applied, it was determined that the post-test learning level mean scores of the students differed significantly according to the method that was applied [F (2.90) = 21.927; p<.05]. In other words, post-test learning level mean scores of the students differed according to the groups. When post-test learning level mean score of the groups are taken into consideration, it is seen that the lowest mean score belongs to the control group, on which the current program is being applied, while the highest mean score belonged to the experimental group 2, on which educational games and feedback-correction approach was applied.
The Tukey test indicated statistically significant difference between the groups at α=0.05 level of confidence between Experimental I, Experimental II and control groups.
Sub-problem 4: Is there a significant difference in favor of experimental group 2 group in terms of
the retention of knowledge between the experimental group 1, on whom teaching by educational games approach was applied and the experimental group 2 where teaching by educational games and feedback-correction were applied? and the significance of the post-test mean scores of the groups was checked by means of t test.
Table 8.Independent Groups t-Test Results of the Permanence test Scores of the Experimental 1 and 2 Groups
Gruplar N ̅ S Sd t
Experimental 1 31 21.387 6.322 57 3.655*
Experimental 2 28 27.607 6.745
*p<.05 (The mean difference is significant at the .05 level)
As shown in the table 8, it can be observed that there is a statistically significant difference between the science course permanence scores of students in the experimental 1 and 2 groups (t(57)=3.655;
p<,05). When the mean permanence scores of the groups are examined, it can be observed that the mean scores of the experimental 2 group ( X =27.821) is higher than the experimental 1 group ( X =21.387). Thus, it can be said that the significant difference in permanence scores is in favor of the experimental 2 group and the permanence of the students in the experimental 2 group were higher at the end of the process.
Sub Problem 5: Is there a significant difference in terms of the retention of knowledge in favor of
the experimental group 1 between the students in the experimental group 1, on whom teaching by educational games approach was applied, and the students in the control group? and the significance of the post-test mean scores of the groups was checked by means of t test.
Table 9.Independent Groups t-Test Results of the Permanence test Scores of the Experimental 1 and Control Groups
Gruplar N ̅ S Sd t
Experimental 1 31 21.387 6.322 63 4.051*
Control 34 15.735 4.888
*p<.05 (The mean difference is significant at the .05 level)
As shown in the table 9, it can be observed that there is a statistically significant difference between the science course permanence scores of students in the experimental 1 and control groups (t(63)=4.051; p<,05). When the mean permanence scores of the groups are examined, it can be
observed that the mean scores of the experimental 1 group ( X =21.387) is higher than the control group ( X =15.735). Thus, it can be said that the significant difference in permanence scores is in favor of the experimental 1 group and the permanence of the students in the experimental 1 group were higher at the end of the process.
Sub Problem 6: Is there a significant difference in terms of the retention of knowledge in favor of
the experimental group 2 group between the students in the experimental group 2, on whom teaching by educational games and feedback-correction approach was applied, and the students in the control group? and the significance of the post-test mean scores of the groups was checked by means of t test.
Table 10.Independent Groups t-Test Results of the Permanence test Scores of the Experimental 2 and Control Groups
Gruplar N ̅ S Sd t
Experimental 2 28 27.607 6.745 60 8.023*
Control 34 15.735 4.888
*p<.05 (The mean difference is significant at the .05 level)
As shown in the table 10, it can be observed that there is a statistically significant difference between the science course permanence scores of students in the experimental 2 and control groups (t(60)=8.023; p<,05). When the mean permanence scores of the groups are examined, it can be
observed that the mean scores of the experimental 2 group ( X =27.607) is higher than the control group ( X =15.735). Thus, it can be said that the significant difference in permanence scores is in favor of the experimental 2 group and the permanence of the students in the experimental 2 group were higher at the end of the process.
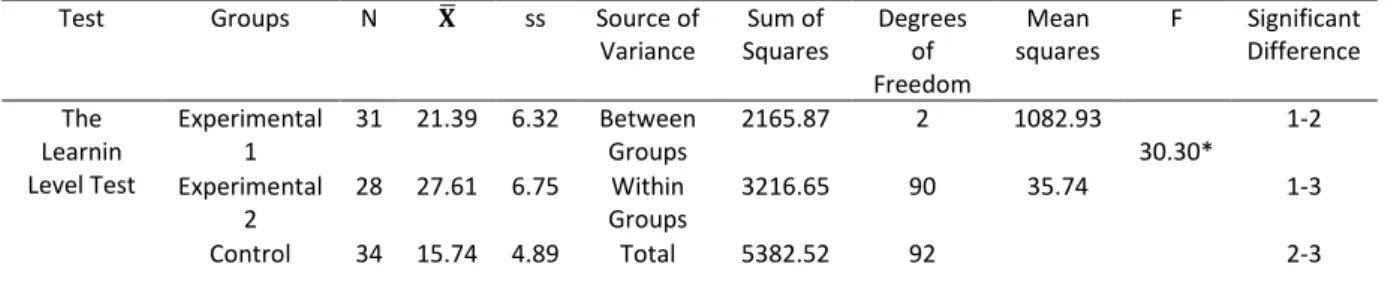
Table 11.Descriptive Statistics and ANOVA Results According to Retention Scores of the Groups Test Groups N ̅ ss Source of
Variance Sum of Squares Degrees of Freedom Mean squares F Significant Difference The Learnin Level Test Experimental 1 31 21.39 6.32 Between Groups 2165.87 2 1082.93 30.30* 1-2 Experimental 2 28 27.61 6.75 Within Groups 3216.65 90 35.74 1-3 Control 34 15.74 4.89 Total 5382.52 92 2-3
**Maksimum puan= 50, *p<.05 (The mean difference is significant at the .05 level)
As shown in the table 11, ANOVA analysis results indicate that there is a significant difference between the retention of knowledge grades of the students [F (2.90) = 30.300; p<0.05]. According to these results, there is a significant difference in favor of the experimental group 2 between the scores of students on retention of knowledge test.
The Tukey test indicated statistically significant difference between the groups at α=0.05 level of confidence between Experimental I, Experimental II and control groups.
Table 12.ANOVA results of the pretest, post-test and retention test scores of experimental group 1 Source of Variance Sum of
Squares
Degrees of Freedom
Mean squares Source of Variance Significant Difference Between-subject Study 3549.978 30 115.33 Measurement 1794.667 2 897.33 311.815* 1-2 Error 172.667 60 2.878 1-3 Total 5427.312 92 2-3
*p<.05 (The mean difference is significant at the .05 level), **1:Pre-test 2: Post- test 3: Permanence testi
As shown in the table 12, It was determined that there was a significant difference between the pretest, post-test and retention test results of the experimental group 1 [F (2.60) = 311.815, p<.05]. The post-test mean score ( ̅= 22.613) is higher than the retention test mean score ( ̅= 21.387) and pretest mean score ( ̅= 12.742).
Table 13.ANOVA results of the pretest, post-test and retention test scores of experimental group 2 Source of Variance Sum of
Squares
Degrees of Freedom
Mean squares Source of Variance Significant Difference Between-subject Study 3535.810 27 130.956
Measurement 4200.643 2 2100.321 463.514 1-2
Total 791.143 83
*p<.05 (The mean difference is significant at the .05 level), **1: On test 2: Son test 3: Kalicilik testi
As shown in the table 13, It was determined that there was a significant difference between the pretest, post-test and retention test results of the experimental group 2 [F (2.54) = 463.514, p<.05]. The post-test mean score ( ̅= 27.821) is higher than the retention test mean score ( ̅= 27.607) and pretest mean score ( ̅= 12.714).
Table 14.ANOVA results of the pretest, post-test and retention test scores of control group Source of Variance Sum of
Squares
Degrees of Freedom
Mean squares F Significant
Difference Between-subject Study 2599.922 33 78.786
Measurement 248.843 2 124.422 52.475 1-2
Error 156.490 66 2.371 1-3
Total 3005.255 101 2-3
*p<.05 (The mean difference is significant at the .05 level), **1: on test 2: son test 3: kalicilik testi
As shown in the table 14, It was determined that there was a significant difference between the pre-test, post-test and retention test results of the control group [F (2.66) = 52.475, p<.05]. The Post-test mean score ( ̅= 17.206) is higher than the retention test mean score ( ̅= 15.735) and pretest mean score ( ̅= 13.412).
4. Discussion, Conclusion and Suggestions
Relevant findings were presented in the previous section of the study in which the effects of educational games and feedback-correction on the level of learning and retention of knowledge in sixth grade science lessons in secondary school were investigated. In this section, on the other hand, findings obtained were interpreted by discussing them according to the studies in the literature.
During the study answers were sought for problems such as “Is there a significant difference in favor of the experimental group 2 between the learning levels of the first and second experimental groups after the application?” as the first sub-problem of the study, "Is there a significant difference in favor of the experimental group 2 between the first experimental group and the control group after the application?" as the second sub-problem of the study and "Is there a significant difference in favor of the experimental group 2 between the learning levels of the experimental group 2 and the control group after the application?" as the third sub-problem of the study.
Post-test mean scores of the experimental and the control groups on the learning level tests were compared to test these sub-problems. It was determined that the post-test scores all 3 groups significantly increased compared to their pretest scores. It was determined that the post-test score of the experimental group 2 was significantly higher than the other two groups and the post-test score of the first experimental group was higher compared to the control group. Activities conducted in the experimental group 2 significantly improved the learning level of the students and the retention of their knowledge.
These results obtained in the study are similar to the results in Gulsoy's (2013) post graduate thesis named "The Effect of Educational Games on Improving the Vocabulary of the 6th Grade Students". There are many studies whose results are similar to the results of this study(Canbay, 2012; Sonmez,
2012; Yesilkaya, 2013; Kekec, 2013; Ulas, 2014; Coskun, Akarsu and Kariper, 2012; Bayat, Kilicarslan and Senturk, 2014; Kaya and Elgun, 2015).
During the study answers were sought for four sub-problems such as "Is there a significant difference in favor of the experimental group 2 in terms of the retention of knowledge after the application between the experimental group1 and 2" while answers were sought for the fifth sub-problem of the study "Is there a significant difference in favor of the experimental group 2 in terms of the retention of the knowledge after the application between the experimental group 1 and the control group" and answers were sought for the sixth sub-problem of the study; "Is there a significant difference in terms of the retention of knowledge after the application between the experimental group 2 and the control group after the application?". According the findings obtained in the study, it was seen that there was a significant difference in favor of the experimental group 2 on which educational games and feedback-correction approach was applied. However, no positive results were obtained in terms of the retention of knowledge in the experimental group1 and 2.
During this study, experimental studies conducted in this area were investigated and their findings were compiled numerically in order to determine the effect of educational games and feedback-corrections on the learning level of the students and the retention of their knowledge. It was determined that in general and in terms of content area, education level and application period educational games, feedback and correction improved the learning levels of the students and the retention of their knowledge significantly. It was seen that educational games, feedback and correction had a positive effect on the learning level and the retention of knowledge when the literature was taken into consideration. It is stated in many studies that teaching by educational games or educational games and feedback-correction had positive effects on many aspects such as academic success, attitude, vocabulary etc(Gulsoy, 2013; Ulas, 2014; Ibrahim and et al., 2011; Deger, 2012; Mubaslat, 2012; Ulas, 2013; Guler, 2011; Yesilkaya, 2013; Karamustafaoglu & Kaya, 2013).
When the studies, in which variables affecting teaching quality and the teaching methods were used together, or the studies, in which effects of the variables affecting the teaching quality are investigated, are taken into consideration, it is seen that in many studies more effective results were obtained (Yunt, 1978; Oguz, 1993; Demir, 1994; Gonenc, 1998; Demirbas, 2005).. The results of these studies that were conducted are in parallel with the results obtained by the approach using educational games and feedback-correction. It was seen that using variables affecting teaching quality and the teaching methods together gave more effective results.
It was concluded that educational games, feedback and corrections were effective on improving the learning level and the retention of knowledge when other studies were compared with the results of this study. Findings that were obtained indicate that using educational games, feedback and corrections together will be more effective on improving the learning level and the retention of knowledge.
The following suggestions for further studies are presented in the light of these results:
1. Effects of educational games, feedback and corrections on the learning level and the retention of knowledge were investigated in this study. Apart from this study, the effects of using the elements forming the teaching service qualities on the learning level and the retention of knowledge can be investigated. The effects of educational games, feedback and corrections on the learning level and the retention of knowledge were investigated in this study. The effect of activities based on this application on many other aspects such as attitude and scientific process skills can be investigated in other studies.
2. It was determined that the educational games and feedback and correction activities were effective in this study investigating the effects of educational games, feedback and corrections applied during the 6th grade science lessons in a secondary school on the learning level and the
retention of knowledge. Therefore, it can be appropriate to include activities based on educational games, feedback and corrections to the programs.
3. We should try to motivate students as much as possible during this process since educational games are interesting activities for children.
References
Bayat, S., Kilicarslan, H. & Senturk, S. (2014). Fen ve Teknoloji dersinde egitsel oyunlarin yedinci sinif
ogrencilerinin akademik basarisina etkisinin incelenmesi. Abant Izzet Baysal Universitesi Egitim Fakultesi Dergisi, 14 (2), 204-216.
Buyukozturk, S. (2011). Sosyal bilimler icin veri analizi el kitabi (13. bs). Ankara: Pegem Akademi. Canbay, I. (2012). Matematikte Egitsel Oyunlarin 7. Sinif Ogrencilerinin Ozduzenleyici Ogrenme
Stratejileri, Motivasyonel İnanclari ve Akademik Basarilarina Etkisinin İncelenmesi. Yayinlanmis
Yuksek Lisans Tezi, Marmara Universitesi, Egitim Bilimleri Enstitusu, Istanbul.
Coskun, H., Akarsu, B. & Kariper, I. A. (2012). Bilim Oykuleri Iceren Egitsel Oyunlarin Fen ve Teknoloji
Dersindeki Ogrencilerin Akademik Basarilarina Etkisi. Ahi Evran Universitesi Kirsehir Egitim Fakultesi Dergisi, 13(1), 93-109.
Deger, A. C. (2012). Cocuk Korolarinin Egitiminde Bir Yaklasim Olarak Egitsel Oyun Kullaniminin
Ogrencilerin Muziksel Erisi Duzeylerine Etkisi. Yayinlanmis Doktora Tezi, Gazi Universitesi, Egitim
Bilimleri Enstitusu, Ankara.
Demir, N. (1994). Ilkokul 4. ve 5. Sinif Turkce Ogretiminde Pekistirme, Katilim ve Donut-Duzeltme
Degiskenlerinin Bir Arada Kullanilmasinin Ogrencilerin Erisisine Etkisi. Yayinlanmamis Yuksek Lisans
Tezi, Hacettepe Universitesi, Sosyal Bilimler Enstitusu, Ankara.
Demirbas, M. (2005). Fen Bilgisi Ogretiminde Sosyal Ogrenme Teorisinin Ogrenme Urunlerine Etkisinin
Incelenmesi. Yayinlanmis Doktora Tezi, Gazi Universitesi, Egitim Bilimleri Enstitusu, Ankara.
Demirel, O. (1999). Planlamadan Degerlendirmeye Ogretme Sanati, Ankara: Pegem Yayicilik.
Gonenc, F. K. (1998). Ilkogretim 1. Kademe 1. Devre 3. Siniflarda Donut ve Duzeltmelerin Ogrenci
Basarisina Etkisi. Yayinlanmamis Yuksek Lisans Tezi, Pamukkale Universitesi, Sosyal Bilimler
Enstitusu, Denizli.
Guler, T. D. (2011). 6. Sinif Fen ve Teknoloji Dersindeki Hucre ve Organelleri Konusunun Egitsel Oyun
Yoluyla Yontemiyle Ogretilmesinin Ogrencilerin Akademik Basarilarina Olan Etkisi. Yayinlanmamis
Yuksek Lisans Tezi, Ataturk Universitesi, Egitim Bilimler Enstitusu, Erzurum.
Gulsoy, T. (2013). 6. Sinif Ogrencilerinin Kelime Haznesinin Gelistirilmesinde Egitsel Oyunlarin Etkisi. Yayinlanmis Yuksek Lisans, Nigde Universitesi, Egitim Bilimler Enstitusu, Nigde.
Ibrahim, R.,Wahab, S., Yusoff, R. C.M., Khalil, K. & Jaafar, A. (2011). Student Perceptions of
Educational Games in Higher Education: An Empirical Study. Issues in Information Systems, 8 (1),
120-133.
Karamustafaoglu, O. & Kaya, M. (2013). Egitsel Oyunlarla ‘Yansima ve Aynalar’ Konusunun Ogretimi:
Yansimali Kosu Ornegi. Arastirma Temelli Etkinlik Dergisi (ATED), 3 (2), 41-49.
Kaya, S. & Elgun, A. (2015). Egitsel Oyunlar Ile Desteklenmis Fen Ogretiminin Ilkokul Ogrencilerinin
Kekec, M. A. (2013). Duzenli Egitsel Oyun Oynayan 11-12 yas Grubu cocuklarda Problem Cozme
Becerilerinin İncelenmesi. Yayinlanmis Yuksek Lisans Tezi, Gazi Universitesi, Egitim Bilimleri
Enstitusu, Ankara.
Mubaslat, M. M. (2012). The Effect of Using Educational Games on the Students Achievement in
English Language for Primary Stage, Amman-Jordan. MEB, (2011). Cocuk Gelisimi ve Egitimi,
Ankara.
Oguz, A. (1993). Fen ogretiminde Ipuclari ve Donut- Duzeltme isleminin erisi Duzeyine Etkisi. Yayinlanmis Yuksek Lisans Tezi, Anadolu Universitesi, Sosyal Bilimler Enstitusu, Eskisehir.
Sel, R. (1987). Egitsel Oyun, Ankara: Ogretmen Yay.
Sonmez, M. T. (2012). 6. Sinif Matematik Derslerinde Web Uzerinden Sunulan Egitsel Matematik
Oyunlarinin Ogrenci Basarisina Etkisi. Yayimlanmis Yuksek Lisans Tezi, Cukurova universitesi, Sosyal
Bilimler Enstitusu, Adana.
Ulas, M. (2014). Temel Basketbol Egitimde Egitsel Oyun ile Ogretimin 10-12 Yas Grubu Cocuklarin
Bilissel ve Psikomotor Gelisim Duzeylerine Etkisi, Yayinlanmis Yuksek Lisans Tezi, Gazi Universitesi,
Egitim Bilimleri Enstitusu, Ankara.
Varisoglu, B., Seref, I., Gedik, M. & Yilmaz, I. (2013). Turkce Dersinde Uygulanan Egitsel Oyunlara
Yonelik Tutum Olcegi: Gecerlilik ve Guvenilirlik Calismasi, Adiyaman Universitesi Sosyal Bilimler Enstitusu Dergisi Turkcenin Egitimi Ogretimi Ozel Sayisi, 6 (11), 1059-1080.
Yesilkaya, I. (2013). 7.Sinif Sosyal Bilgiler Dersi "Zaman İcinde Bilim" Unitesinin Egitsel Oyun Yontemi
İle Ogretimi. Yayinlamamis Yuksek Lisans Tezi, Inonu Universitesi, Egitim Bilimleri Enstitusu,
Malatya.
Yunt, P. O. (1978). Donut Duzeltme Etkilerinin Okulda Ogrenmeye Etkileri. Yayinlanmis Doktora Tezi, Hacettepe Universitesi Sosyal Bilimler Enstitusu, Ankara.