KADIR HAS UNIVERSITY SCHOOL OF GRADUATE STUDIES INDUSTRIAL ENGINEERING PROGRAM
ENERGY TRANSITION SCENARIO ANALYSIS FOR TURKEY USING LONG-RANGE ENERGY ALTERNATIVES PLANNING (LEAP)
DANIEL JULIUS MASSAGA
MASTER’S THESIS
DA NI EL JU L IU S MAS S AG A M.S .The sis 20 19 S tud en t’ s Fu ll N ame P h.D. ( or M .S . or M .A .) T he si s 20 11
ENERGY TRANSITION SCENARIO ANALYSIS FOR TURKEY USING LONG-RANGE ENERGY ALTERNATIVES PLANNING (LEAP)
DANIEL JULIUS MASSAGA
Submitted to the School of Graduate Studies in partial fulfillment of the requirements for the degree of
Master of Science In
INDUSTRIAL ENGINEERING
KADIR HAS UNIVERSITY
DECLARATION OF RESEARCH ETHICS / METHODS OF DISSEMINA TION I, DANIEL JULIUS MASSAGA, hereby declare that;
• this master's thesis is my own original work and that due references have been appropriately provided on all supporting literature and resources;
• this master's thesis contains no material that has been submitted or accepted for a degree or diploma in any other educational institution
• I have followed Kadir Has University Academic Ethics Principles prepared in accordance with The Council of Higher Educalion 's Eıhical Conduct Principles in addition, I understand that any false claim in respect of this work will result in disciplinary action in accordance with University regulations.
Furthermore, both printed and electronic copies of my work will be kept in Kadir Has Information Center under the following condition as indicated below (SELECT ONL Y ONE, DELETE THE OTHER TWO):
-./ The full content of my thesis will be accessible from everywhere by all means.
D The full content of my thesis will be accessible only within the campus of Kadir Has University.
D The full content of my thesis will not be accessible for _ years. If no extension is required by the end of this period, the full content of my thesis will be automatically accessible from everywhere by all means.
DANIEL JULIUS MASSAGA
Table of Contents ABSTRACT ... i ÖZET ... ii LIST OF TABLES ... v LIST OF FIGURES ... vi ABBREVIATIONS ... viii 1. INTRODUCTION ... 1 1.1. Opening Statement ... 1
1.2. Purpose of The Study ... 4
1.3. Scope of the Study ... 6
1.4. Literature Review ... 7
2. OVERVIEW OF TURKISH ELECTRICITY SECTOR ... 13
2.1. The Turkish Electricity Market ... 13
2.2. Current Electricity Market in Turkey ... 16
2.3. Electricity Consumption in Turkey ... 18
2.3.1. Industry sector ... 21
2.3.2. Residential sector ... 23
2.3.3. Commercial and services sector ... 25
2.4. Electricity Generation in Turkey ... 26
2.5. Electricity Generating Resources in Turkey ... 29
2.5.1. Natural gas ... 29
2.5.2. Coal ... 30
2.5.4. Renewable energy resources ... 33
3. METHODOLOGY ... 47
3.1. Introduction to LEAP ... 47
3.2. Turkey’s LEAP Electricity Model ... 48
3.2.1. Current accounts... 49
3.2.2. Design of electricity demand ... 50
3.2.3. Transformation design ... 52
3.3. Scenario Description and Design ... 58
3.3.1. Design of BAU scenarios ... 59
3.3.2. Energy Efficiency scenarios ... 61
3.3.3. Renewable Energy scenarios... 62
4. RESULTS AND DISCUSSION ... 63
4.1. Electricity Demand Projections ... 63
4.2. Electricity Generation Projections ... 66
4.3. Costs Analysis ... 75
4.4. Emission Analysis ... 82
5. CONCLUSION AND RECOMMENDATIONS ... 87
References ... 91
CURRICULUM VITAE ... 102
i
ENERGY TRANSITION SCENARIO ANALYSIS FOR TURKEY USING LONG-RANGE ENERGY ALTERNATIVES PLANNING (LEAP)
ABSTRACT
Fossil fuel thermal power plants constitute a large part of the Turkish electricity generation capacity. The Turkish government has been developing several energy policy documents to evaluate how various renewable energy sources of the country can be utilized optimally in the generation of electricity for the next 30 years. The study considers three scenarios in the transition to renewable energy for Turkey; the business as usual (BAU), energy conservation (EE) and renewable energy (REN) scenarios were modeled with the help of the LEAP (Long-range Energy Alternatives Planning) software. EE scenario considers the use of energy-efficient appliances across all sectors of demand while emphasizing on more efficiency in electricity production activities, whereas REN scenario considers increasing the share of the renewable energy sources as much as possible in the power generation mix. These scenarios were evaluated in terms of cost and environmental impact. The optimized energy efficiency scenario has been shown to be the optimal energy policy option for Turkey in terms of cost and environmental impact.
ii
ENERGY TRANSITION SCENARIO ANALYSIS FOR TURKEY USING LONG-RANGE ENERGY ALTERNATIVES PLANNING (LEAP)
ÖZET
Fosil yakıtlı termik santraller, Türkiye'deki elektrik üretim kapasitesinin büyük bir bölümünü oluşturmaktadır. Türk hükümeti, ülkenin çeşitli yenilenebilir enerji kaynaklarının önümüzdeki 30 yıl boyunca elektrik üretiminde en iyi şekilde nasıl kullanılabileceğini değerlendirmek için çeşitli enerji politikası belgeleri geliştirmektedir. Çalışma, Türkiye için yenilenebilir enerjiye geçişte üç senaryo ele alıyor; her zamanki gibi iş (BAU), enerji tasarrufu (EE) ve yenilenebilir enerji (REN) senaryoları LEAP (Long-range Energy Alternatives Planning) yazılımı yardımıyla modellenmiştir. EE senaryosu, tüm elektrik sektörlerinde enerji verimliliği sağlayan cihazların kullanımını ele alırken, elektrik üretim faaliyetlerinde daha fazla verime vurgu yaparken, REN senaryosu, yenilenebilir enerji kaynaklarının elektrik üretim karışımındaki payını mümkün olduğunca arttırmayı düşünmektedir. Bu senaryolar maliyet ve çevresel etki açısından değerlendirildi. Maliyet eniyileme kullanılarak çözülen enerji tasarrufu senaryosunun, maliyet ve çevresel etki açısından Türkiye için en uygun enerji politikası seçeneği olduğu gösterilmiştir.
iii
ACKNOWLEDGEMENTS
I would like to extend my gratitude to my Supervisor, Assoc. Prof. Dr. Gökhan Kirkil whose expertise, understanding, generous guidance and support made it possible for me to work on a topic that was of great interest to me. I am hugely indebted to Dr. Kirkil for finding the time to reply my e-mails and for being ever so kind and showing interest in my research and for giving his precious, kind and valuable advice regarding my research.
I also would like to express my gratitude to Assoc. Prof Dr. Ahmet Yücekaya and Assist. Prof. Dr. Emre Çelebi for being so generous as to provide me with a copy of his research and for finding time for me in their busy schedule. Words can never be enough to thank you for your kindness.
I would also like to express my gratitude to all my teachers, friends and colleagues who put their faith in me and urged me to do my best.
iv
v
LIST OF TABLES
Table 1.1 Energy consumption in Turkey ... 6
Table 2.1 Electricity generation by Resource in 2017 ... 27
Table 2.2 Installed Capacity in Turkey in MW ... 28
Table 2.3 Electricity Generation, Imports and, Exports in Turkey in GWh ... 28
Table 2.4 Natural Gas Production in Turkey 2008 -2017 (million cubic feet) ... 29
Table 2.5 Natural gas Import activities in Turkey ... 30
Table 2.6 Electricity Generation Projections by Domestic Coal in Turkey ... 32
Table 2.7 FITs for electricity generated from RES in Turkey ... 34
Table 2.8 Total Wind Energy Potential in Turkey at 50m altitude ... 39
Table 2.9 Under construction, Planned and Proposed NPPs in Turkey ... 46
Table 3.1 Key Assumption Data ... 50
Table 3.2 Data used in Turkey’s Residential Demand ... 52
Table 3.3 Installed Capacities and Electricity Generation Data for Turkey in 2018 ... 54
Table 3.4 Cost of Electricity Generating Power plants in Turkey ... 55
Table 3.5 Parameters Comparison in Accounting versus Optimization Model ... 58
Table 3.6 Exogenous Capacity Addition in BAU_ACC and BAU_OPT ... 60
Table 3.7 Endogenous Capacity in BAU_ACC and EE_ACC Scenarios ... 60
Table 3.8 Exogenous Capacity Data used in REN_ACC and REN_OPT ... 62
Table 3.9 Endogenous Capacity in REN_ACC Scenario ... 62
Table 4.1 Scenario Referencing ... 63
Table 4. 2 Cumulative Costs and Benefits Summary: 2018-2040. Compared to Scenario: Business as Usual (BAU_ACC). ... 85
vi
LIST OF FIGURES
Figure 1.1 World Total Primary Energy Consumption by fuel type from 1990 up to 2015
(Mtoe) [BP,2016] ... 2
Figure 1.2 Turkey’s GDP in Billion US$ from 1960 to 2017(World Bank Data, 2017) ... 3
Figure 1.3 Total Primary Energy consumption in Turkey (Mtoe) (BP,2016)... 3
Figure 1.4 Annual GDP Growth in Turkey [World Bank,2017] ... 5
Figure 2.1 The Structure of the Current Electricity Sector in Turkey [IAEA,2014] ... 16
Figure 2.2 Electricity Consumption in Turkey [TEIAS,2017] ... 19
Figure 2.3 Electricity consumption by Sector [IEA, 2016]... 20
Figure 2.4 Turkey’s major Export Partners [OECD, 2018] ... 21
Figure 2.5 Top Ten Exported Products in Turkey [OECD, 2018] ... 22
Figure 2.6 Electricity consumption in Turkish Industries [IEA,2016] ... 23
Figure 2.7 Population Growth and Urbanization in Turkey [TEIAS,2017]... 24
Figure 2.8 Electricity consumption in Turkey’s Residential Sector [TEIAS,2017] ... 24
Figure 2.9 Shares of Net Electricity Consumption by Sector in Turkey (TEIAS, 2017).... 26
Figure 2.10 Lignite Reserves in Turkey [Ediger et al, 2014] ... 31
Figure 2.11 Turkey’s Solar Energy Map (Energy Atlas, 2019) ... 35
Figure 2.12 Allocation of Wind Energy Potential in Turkey [MENR] ... 38
Figure 2. 13 Geothermal Resources Map for Turkey [Argun & Argun, 2011] ... 40
Figure 2.14 Biomass Conversion Technologies in Turkey ... 41
Figure 2.15 Biomass Installed Capacity in Turkey [IRENA, 2018] ... 42
Figure 2.16 Planned Nuclear Power Plants in Turkey [WNA, 2018] ... 45
Figure 3.1 Turkey’s LEAP Model... 49
Figure 3.2 Shares of Electricity consumption by sector in Turkey in 2018 ... 51
Figure 3.3 Capacity Specifications in LEAP [LEAP,2011] ... 53
Figure 3.4 Data used to Forecast Demand ... 59
Figure 4. 1 Electricity Demand Projections ... 64
Figure 4. 2 Electricity Demand Projection in BAU and REN scenarios... 65
vii
Figure 4. 4 Electricity Generation Projections 2019-2040 ... 66
Figure 4. 5 Electricity Generation Mix in BAU_ACC Scenario ... 67
Figure 4. 6 Electricity Generation Mix in BAU_OPT Scenario ... 68
Figure 4. 7 Electricity Generation Mix in REN_OPT Scenario ... 69
Figure 4. 8 Electricity Generation Mix in REN_ACC Scenario ... 70
Figure 4. 9 Electricity Generation Mix in EE_ACC Scenario ... 72
Figure 4. 10 Electricity Generation Mix in EE_OPT Scenario ... 72
Figure 4. 11 Electricity Generation Mixes by Scenarios in 2040 ... 73
Figure 4. 12 Electricity Imports Projections ... 73
Figure 4. 13 Total Capacity across all scenarios in 2040. ... 74
Figure 4. 14 Endogenous and Exogenous Capacities in 2040 ... 75
Figure 4. 15 Capital Costs ... 77
Figure 4. 16 Fixed Operating and Maintenance Costs ... 77
Figure 4. 17 Variable Maintenance and Operating Costs ... 78
Figure 4. 18 Total Costs ... 79
Figure 4. 19 Investment Costs due to Exogenous Capacity Additions ... 80
Figure 4. 20 Investment Costs due to Endogenous Capacity Additions ... 81
Figure 4. 21 Total Investment Costs due to Capacity Additions ... 82
Figure 4. 22 Greenhouse gas emissions ... 83
viii
ABBREVIATIONS
EMRA Energy Market Regulatory Authority
TUIK Turkish Statistical Institute
MENR Ministry of Energy and Natural Resources
TEIAS Turkish Electricity Transmission Corporation
EPIAS Energy Markets Operations Corporation
MTOE Million tonnes of oil equivalent
NEEAP National Energy Efficiency Action Plan
NREAP National Renewable Energy Action Plan
GHG Green House Gases
IPCC Intergovernmental Panel on Climatic Change
IEA International Energy Agency
LEAP Long Range Energy Alternatives Planning
NPV Net Present Value
BAU Business as Usual Scenario
EE Energy Efficiency Scenario
REN Renewable Energy Scenario
1
1. INTRODUCTION
1.1. Opening Statement
Energy consumption today, be it in transportation, electricity generation or any other application, is the greatest than any other era of human existence and this is mainly due to worldwide economic and social development. In this modern world, it is almost impossible for a nation to significantly reduce poverty in the absence of massive energy consumption, in fact, according to [Gazzino, et al., 2009], the development of a nation could be expressed in terms of energy consumption per capita, which according to [Akuru, 2009], means countries with high incomes and high human development index tend to have higher energy consumption
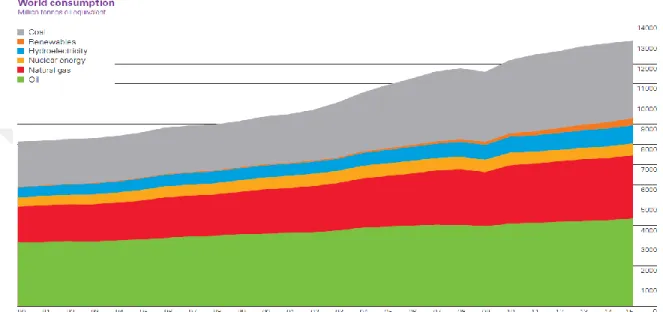
Fossil fuels are the most common used source of energy in the world. Coal, fuel oil and natural gas constitute most of the percentage, Figure 1.1 shows the total consumption of primary energy sources in the world. Fossils are known to emit greenhouse gases (GHG) which are harmful to the environment and the society at large. [Kaygusuz, 2007], emphasized that this one of the major reasons that forced policy makers and decision makers to opt for alternative resources in renewable energy sources (RES). RES is a collection of energy producing resources such as hydro, nuclear, solar, wind, geothermal, biofuels and waste which are derived from sources that can be replenished time after time hence sustainable sources of energy.
Turkey is currently one of the fastest growing economies in the world obtaining a Gross Development Product (GDP) of $851.102 Billion in 2017 [World Bank, 2017] and has largest increase in the energy demand among the Organization for Economic Cooperation and Development (OECD) countries. According to World Bank Data, the annual GDP growth rate was 3.18% in 2015 and spiked up to 7.42% in 2016 making Turkey the fastest growing
economy among the G20 countries [World Bank Data, 2017]. The GDP growth in Turkey has experienced some fluctuations as illustrated in Figure 1.2, but Turkey’s GDP is generally
2
on the rise. In 2014, Turkey’s GDP was $934.186 Billion, which then dropped to $859.797 Billion in 2015.
Figure 1.1 World Total Primary Energy Consumption by fuel type from 1990 up to 2015
(Mtoe) [BP,2016]
Causes of these fluctuations in Turkey’s GDP over the recent years could be focused on the widespread street protests that took place in the summer of 2013 against the government, famously known as Gezi Park Protests [Tekinalp, 2016]. In addition to that, in 2015, Turkey held an election to which most citizens found controversial, moreover in the next year Turkey experienced a series of terrorist attacks [Güneyli A., et al, 2017], another reason was the Syrian civil war, it added a social burden on Turkey. The war caused mass migration of Syrian refugees into European countries especially Turkey [Akcapar & Simsek, 2018] and finally, the failed coup attempts in 2016 which caused a state of emergency to be declared for several months in Turkey, all these factors affected the certainty of the Turkish economy.
3
Figure 1.2 Turkey’s GDP in Billion US$ from 1960 to 2017(World Bank Data, 2017)
Historically there have been studies that argue on the concept of the relationship between energy consumption and GDP growth but there has never been a direct solution to this concept as conflicting results from different studies emerge to support either side of the argument [Al-mulali & Sab, 2012].
Figure 1.3 Total Primary Energy consumption in Turkey (Mtoe) (BP,2016)
0 100 200 300 400 500 600 700 800 900 1000 19 60 19 63 19 66 19 69 19 72 19 75 19 78 19 81 19 84 19 87 19 90 19 93 19 96 19 99 20 02 20 05 20 08 20 11 20 14 20 17 B illio n s US$ Years
GDP (current US$)
GDP (current US$) 96.4 96.2 102.8 103.3 104.3 111 115 120.2 117.6 122.8 131.8 2005 2006 2007 2008 2009 2010 2011 2012 2013 2014 2015Primary Energy Consumption in Turkey
4
There are some studies that have proven economic growth and energy consumption are highly dependent on each other ([Rezitis & Ahmmad, 2015] and [Liddle & Lung, 2015]). In the case of Turkey, this concept is true as illustrated in Figure 1.3, the total energy consumption of Turkey is given from 1965 leading up to 2015 in Million tonnes of oil equivalent (Mtoe), and in Figure 1.4, the annual GDP growth rate of Turkey is given. One can observe the peaks and lows in the same years in both Figures.
1.2. Purpose of The Study
In recent years, Turkey has experienced population, urbanization and industrialization growth, which led to Turkey’s significant increase in electricity consumption. According to the IEA report in 2015, Turkey ranked 5th in electricity consumption in Europe [International Energy Agency, 2016], furthermore as result of growth of economic and development indicators, electricity demand in Turkey is expected to continue rising. Fossil fuels in natural gas and coal have for a long period constituted a large part of Turkey’s electricity generation mix. Turkey has no natural gas reserves hence Turkey is forced to import natural gas from natural gas rich countries hence making Turkey an energy importing country. Turkey also imports hard coal, heavy fuel oil and electricity. In 2015, the Turkish Statistical Institute (TUIK) reported that between the years 2000 and 2015, the annual expenditure on fuel import increased over 220%, and fuel imports accounted for 20% of total imports in that same period [TUIK, 2018]
Energy importing countries have huge trade deficits, in Turkey’s case the Ministry of Trade released a statement through the Turkish Statistical Institute (TUIK), stating that as of July 2018 Turkey’s trade deficit was 5.982 Billion USD which indicates a decrease by 32.6% compared to July’s 2017 deficit [TUIK, 2018].
This study investigates various pathways for energy transition in Turkey by analyzing the energy transition strategy papers released by Turkish government on Turkey’s future energy consumption and generation. These energy plans also aim to promote an energy
self-5
sufficient nation and improve Turkey’s energy security mainly by reducing the amount of imported resources used for electricity generation activities and promoting domestic renewable energy resources in Turkey.
Figure 1.4 Annual GDP Growth in Turkey [World Bank,2017]
In this study, the government’s released energy documents on improving energy efficiency [National Energy Efficiency Action Plan (NEEAP) 2017-2023] and renewable energy utilization [National Renewable Energy Action Plan (NREAP) 2017-2023] up to the year 2023, which marks Turkey’s 100 years of Independence, will be analyzed and used to create two scenarios that are Renewable Energy (REN) and Energy Efficiency (EE) scenarios. We analyzed each scenario using accounting and optimization models in LEAP to project Turkey’s future electricity generation mix. We benchmarked the results with the current trend given it will continue as in the past Business-as-usual scenario (BAU). This study aims to perform an in-depth analysis on how the proposed energy plans by the government fair
-8 -6 -4 -2 0 2 4 6 8 10 12 14 1 9 6 2 1 9 6 4 1 9 6 6 1 9 6 8 1 9 7 0 1 9 7 2 1 9 7 4 1 9 7 6 1 9 7 8 1 9 8 0 1 9 8 2 1 9 8 4 1 9 8 6 1 9 8 8 1 9 9 0 1 9 9 2 1 9 9 4 1 9 9 6 1 9 9 8 2 0 0 0 2 0 0 2 2 0 0 4 2 0 0 6 2 0 0 8 2 0 1 0 2 0 1 2 2 0 1 4 2 0 1 6 % Years
GDP growth (annual %)
GDP growth (annual %)6
against the reference scenario (BAU) on aspects such as levels of GHGs emissions, costs of generating electricity, import levels and independence of the Turkish electricity system.
Table 1.1 Energy consumption in Turkey
Years Population Electricity Consumption (GWh) 2008 71,517,100 161,948 2009 72,561,312 156,894 2010 73,722,988 172,051 2011 74,724,269 186,100 2012 75,627,384 194,923 2013 76,667,864 198,045 2014 77,695,904 207,375 2015 78,74,1053 217,312 2016 79,814,871 231,204
1.3. Scope of the Study
In chapter 2, an overview of the Turkish electricity sector will be given. Brief information about the history of the Turkish electricity market, the current trends in the electricity market, the behavior of electricity consumption in Turkey and finally the chapter will focus on the historical and current status of RES utilization in Turkey’s electricity generation mix and how well RES related policies and regulations are implemented in the country.
In chapter 3, the methodology used in this study: Long Term Energy Alternatives Planning (LEAP) will be briefly introduced and some special features of the modeling platform will be explained followed up by a detailed introduction of Turkey’s LEAP model. Furthermore, this chapter will formally introduce the summaries of the Ministry of Energy and Natural Resources documents: NREAP and NEEAP, which will be used to create three scenarios in
7
LEAP. Then finally, introduce the scenarios namely Business as Usual (BAU), Energy Efficiency (EE) and Renewable Energy Resources (REN) scenarios and their properties.
Chapter 4 includes the discussions on the results from the three scenarios. The demand, supply, amount of GHG emissions and costs of each scenario will be displayed and then results of each scenario will be benchmarked against the reference scenario (BAU).
In chapter 5, the study’s shortcomings will be explained and recommendations on future studies will be given.
1.4. Literature Review
Modeling the energy demand and consumption of a region is usually based on the region’s historical energy consumption and the correlation of this energy consumption with other social and economic drivers such as GDP growth, income per capita, growth in population, climate change, price of energy and so on. Over the years there has been a few studies analyzing energy consumption in different counties using different models including various independent drivers. In this section the previous studies on energy forecasting and modelling in Turkey will be discussed.
Energy demand forecasting is very important to policy makers all over the world even more so for developing energy markets such as Turkey [Ediger & Akar, 2007]. In Turkey, government bodies such as the Ministry of Energy and Natural Resources (MENR) are responsible for carrying out energy demand and supply forecasting studies and all other energy related issues [Ediger & Tatlidil, 2002], in fact one of MENR’s objectives is to provide high economic and social contribution to national welfare by utilizing energy and natural resources in the most efficient and environmental-friendly manner [MENR, 2018]. In hand with the MENR, the State’s Planning Organization (SPOs) and the State’s Institute of Statistics (SIS, currently known as TUIK) were also responsible in developing different energy models that forecasted energy demand in Turkey.
8
In 1984, Turkey’s MENR started using Model for Analysis of Demand (MAED) to forecast medium to long range energy demand and the Ministry used Wien Automatic System Planning (WASP) to calibrate the most favorable future investment and production plans [Ediger and Tatildil, 2002]. The MAED method was then applied six times over a 20 years’ period, from 1986 to 2005 specifically MAED studies were conducted in the years 1986, 1990, 1994, 1997, 2000 and 2005. The demand forecast results from these studies were regarded to be greater than the actual demand figures. For instance, [Ediger and Tatildil, 2002] tested the consistency and accuracy of the MAED models, they considered 1999 as the final year for the conducted studies. The results implied that in MAED’86 model the results of the study forecasted 34% more than the actual demand figures, in the other MAED models leading up to 1999: MAED’90, MAED’94 and MAED’97, they respectively recorded 33%, 9% and 6% higher demand compared to the actual demand. The authors went on to say that, MAED is more accurate when used to forecast medium to short range periods compared to long term periods.
Correspondingly, other methods have been applied in Turkey. In 2002, Ediger and Tatildil (2002) used cycle analysis to forecast future energy demand in Turkey. The model uses energy demand trends in the historical data to forecast better results. In their study, they predicted Turkey’s primary energy demand would reach 135 Million tons of oil equivalent (TOE) in 2010.
In 2004, Ozturk et al predicted Turkey’s energy demand based on economic and demographic drivers such as the amount of imports and exports in Turkey, the gross national product (GNP), and population growth. They used a genetic algorithm approach to estimate future energy demand. And the results of their study were more suitable compared to results of the government model.
In 2006, Sözen et al developed a model to predict the future energy consumption in Turkey using Artificial Neuronal Networks (ANN). In this study, the authors developed equations that were used to forecast Turkey’s future net energy consumption (NEC). Furthermore,
9
according to their results the NEC was well predicted within acceptable errors and the coefficients of determination were 0.999 and 1 for training and test data respectively. They went on to emphasize the importance of ANN approach in finding solutions that allow energy application studies to present viable and attractive results.
In 2007, Ediger & Akar used Autoregressive Integrated Moving Average (ARIMA) and Seasonal Autoregressive Integrated Moving Average to analyze the primary energy demand in Turkey and forecast future demand. In their study, the authors used data from 1950 to 2005 and predicted the future primary energy demand from 2006 to 2020. In their results they suggested that Turkey’s primary energy demand will increase at a rate of 3.3%.
Another hot research topic in Turkey is forecasting the future electricity demand, supply and, consumption. In 2010, Altun & Cunkas applied ANN to forecast Turkey’s long-term electricity demand using economic data. The authors developed two ANN structures, three-layered back propagation and a recurrent neural network (RNN) in order to forecast the future electricity demand for the years 2008 to 2014. The RNN approach yielded the best results. In 2011, Kavaklioglu (2011) used Support Vector Regression (SVR) method to forecast electricity consumption in Turkey. In this study, the author modeled the electricity consumption in Turkey as a function of socio-economic drivers such as population, GNP, imports and exports using the ε-SVR format. The author used data from 1975 to 2006 to predict the electricity consumption in Turkey up to the year 2025.
In 2014, Hamzacebi & Anvi Es (2014) proposed an optimized grey model (OGM) to predict total electricity demand in Turkey from 2013 up to 2025. In their model they applied both direct and iterative approaches. The authors also compared their proposed model’s results with results from other studies in the literature and showed how their model’s results was superior. In addition to that, they also calculated the amount of primary energy resources required to supply the forecasted electricity demand for the years 2015, 2020 and 2025.
10
In recent years, there has been several studies emphasizing on the importance of utilizing Turkey’s domestic renewable energy resources. In 2011, Melikoglu & Albostan used the government’s “Vision 2023” energy targets to predict how RES can be utilized by Turkey in less than 15 years. In addition to that, the author also states that given the wind, hydropower, geothermal and solar energy potentials in Turkey, these resources can supply the electricity demand predicted in Turkey’s Vision 2023 targets of 530,000 GWh.
In 2012, Toklu & Kaygusuz (2012) studied the potential of utilizing RES in Turkey and came up with a conclusion that, biomass, wind, hydropower, geothermal and solar show huge potential. The author added that RES is more suitable for clean and sustainable energy environment in Turkey because with utilization of RES, emission of greenhouse gases (GHGs) would decrease significantly.
In 2016, Ozcan (2016) spoke about the important role RES play in promoting Turkey’s self-sufficient electricity supply. In the study, the author analyzed the current investments in RES in Turkey and compares them to the government plans “Vision 2023” energy targets, and he concludes that the current pace will not meet the targets, the author goes on to suggest that the government should think of introducing a new energy policy specific for RES activities in Turkey to speed up the pace of RES utilization.
There have been few LEAP applications in Turkey. Ozer et al. (2013) used LEAP to analyze the potential of reducing emissions in Turkish electricity sector using various government policies to create scenarios. They created two scenarios: Baseline Scenario (BAU) and Mitigation scenario, where 2006 was the base year and 2030 the final year. The comparison of the results of the two scenarios over the modeled period showed that carbon dioxide emissions (CO2) will increase significantly in BAU scenario while the Mitigation scenario’s electricity-based CO2 emission grew at an annual rate of 5.8%, which reciprocated a 17.5% mitigation ratio. Furthermore, the results suggested that the cumulative CO2 emission reduction between the two scenarios over the modeled period was 903 Million tons CO2eq.
11
In 2015, Ates (2015) applied LEAP in assessing the energy efficiency and carbon dioxide mitigation potential in Turkey’s iron and steel industries. The author created four scenarios: Business as Usual (BAU), Accelerated Energy Efficiency Improvement (AEI), Cleaner Production and Technology scenario (CPT) and Slow-speed Energy Efficiency Improvement scenario (SEI), where 2010 was the base year and 2030 the final year. The results of the study suggest that, the energy intensity rate among the four scenarios was lowest in AEI scenario at 51% compared to BAU scenario. The results implemented that, the CPT scenario had the highest economic potential at $1.8 Billion. The CPT scenario also had the least CO2 emissions at 14.5 Million tons of CO2 (MtCO2). The author suggests that, if there are significant measures taken in Turkey, there is a huge potential for decreasing the energy consumption and GHGs emissions from iron and steel industries and the industry sector at large.
Ediger & Çamdali (2007) performed a fossil fuel linear programming optimization analysis or Turkey. The authors performed the analysis using the exergy analysis approach based solely on the concept of the second law of thermodynamics, which considers both the quality and quantity of the energy produced. In their analysis the authors state that inter-fuel substitution between different fossil fuel resources will lead to a better generation mix for Turkey. The results suggested by increasing domestic electricity production from lignite, fuel oil and hard coal would decrease Turkey’s energy imports. Furthermore, result also suggested that imported natural gas will still play a major role in the mix as it will be used to meet the rest of demand. In conclusion, the fossil fuel costs would decrease by 1.67 Billion USD if domestic electricity production from oil, lignite and hard coal are given a chance.
In 2010, (Askar, 2010) aimed to find the least cost set of technologies in Turkey that would meet the demand between the years 2010-2025 mainly by decreasing CO2 emissions. In order to perform the analysis, the author proposed a mathematical programming method with a bottom-up approach model. The model was represented as a simple version of the energy system as a flow chart in three different modules: the primary energy suppliers, energy conversion technologies and the final energy demand module. Results from this study
12
showed that most of the electricity demand through the modelled period was particularly met by renewable energy resources such as hydro, geothermal, solar and wind.
In 2017, (Sulukan, Sağlam, & Uyar, 2017) established a model for Turkey using MARKAL energy system model and use the model to conduct an analysis of alternative technological pathways that the country may pursue over the 2005-2020 period. Based on their model’s results, the country would decrease dependence on imported fuels if firstly, domestic renewable energy resources are greatly promoted but more importantly the whole energy system should be improved parallel to the country’s national energy strategies. The results also suggest that energy efficiency measures should be applied in all energy technologies and all main sectors of demand and in transmission and distribution activities and finally, the county should try to increase cogeneration practices so as to minimize both the demand and the costs.
There are studies in Turkey that focus on optimization energy models to forecast either the future energy generation mix, or future electricity demand. This study will act as the pioneer LEAP optimization and accounting study for Turkey. The results from the accounting model will be compared to the results from the optimization model.
13
2. OVERVIEW OF TURKISH ELECTRICITY SECTOR
2.1. The Turkish Electricity Market
The history of the Turkish electricity market dates to 1970, the year that marked the inauguration of the Turkish Electricity Authority famously known amongst the locals as Türkiye Elektrik Kurumu (TEK). TEK, a state-owned institution ran all market activities and it was also responsible for generation, transmission and distribution activities too. This created a monopoly in the state’s electricity market meaning no private investments were allowed in the market. Later in the years 1980s leading up to the mid-1990s, the Turkish government started pursuing privatization of electricity generation. Liberalization of the market was due to the increasing demand for electricity during the 1980s, especially by power hungry industries such steel production, automotive and mining. TEK controlled the electricity prices, the prices went up meanwhile the supply couldn’t meet the demand which eventually led to recurring power outages across the country. Another major reason that led to electricity market liberalization in Turkey was lack of public funds to invest in state owned companies. Boycotting TEK was initiated by the energy sector seeing that a monopoly system doesn’t fit the country, the sector and the state at large opted for Public Private Partnership (PPP) models of electricity generation.
Turkey was one of the first countries that managed to establish its own legislation on PPP. In 1984, the state chose to abandon the monopoly of the vertically integrated TEK by enacting the law numbered 3096 which allowed private companies involvement in the energy sector specifically for electricity generation projects. With the introduction of this law, existing generation and distribution companies practiced privatization through Transfer of Operating Rights (TOOR) contracts, while on the other hand, new generation facilities were subjected to Build-Operate-Transfer (BOT) contracts and some companies could produce their own electricity in the auto-producer system.
14
In attempt to ease and facilitate the nation’s privatization procedures, TEK was restructured into two departments in 1993. One department was responsible for electricity generation (TEAŞ -Turkish Electricity Generation and Transmission Company) while the other department dealt with distribution of electricity (TEDAŞ – Turkish Electricity Distribution Company). TEDAŞ and TEAŞ were responsible for attracting private companies to sign whether BOT, TOOR or BOO contracts.
The BOT model was officially introduced in June 08, 1994 under Law No 3996 famously known as “BOT Law”. Under BOT contracts, private investors were given the right to build a generation facility, have control over all operations activities concerning the facility for a certain period, sell the produced electricity to the state within the agreed period and then transfer the facility to the state the end of the period at no cost.
Under TOOR contracts, state owned generation, transmission and distribution facilities were transferred to private investors for a given amount of time. As the name of the model states, only the operation facility activities were transferred for a period of time to the private investors not ownership and furthermore any investments made by the private investor be it to increase efficiency of the facilities or speed up operations during the agreed period were assumed to be owned by the state-owned facility.
Further down the years, in 1997 a new model: Build-Operate-Own model was introduced under Law No 4283 which allowed for the Establishment and Operation of Electricity Generation Facilities and Sale of Electricity (“BOO Law”). Under the BOO law, investors could build generation facilities and own them without any time limit. This law was specifically enacted for the establishment of thermal power plants.
Despite all these efforts to create a liberal market, most of the market was still overseen by state-owned companies. Furthermore, the BOT, TOOR and BOO contracts included “take or pay” obligations where fixed quantities and prices were agreed on over the contract period, this did not create a competitive environment in the market. Evidently there was need of a
15
more competitive market which led to the enactment of the Electricity Market Law (EML) under Law No 4268.
The much awaited EML was introduced to the public in early 2001, it paved the way for a free competitive market in electricity generation and distribution for Turkey. Under this law, TEAŞ was to be broken down into three state-owned public companies responsible for the generation, distribution and trade of electricity, while on the other hand, TEDAŞ was to establish 20 companies each of which was granted license to perform distribution activities in relevant distribution areas, this meant all distribution activities were still under the state. Most importantly, under the EML law, a new regulatory body was to be established and it would oversee the Turkish power market, set tariffs, issue licenses and prevent any uncompetitive activities.
Later in 2001, TEAŞ was restructured to form Turkish Electricity Transmission Corporation (TEİAŞ), Turkish Electricity Generation Corporation (EÜAŞ) and Turkish Electricity Trading Corporation (TETAŞ). Distribution activities would be handled by the Turkish Electricity Distribution Company (TEDAS), its affiliates and licensed private sector distribution companies in their respective regions as illustrated in Figure 2.1. In February 2002, the Electricity Market Regulatory Authority (EMRA) was established and started issuing new regulations on licensing and the electricity market, which took full effect in later the same year (TEIAS, 2018)
16
Figure 2.1 The Structure of the Current Electricity Sector in Turkey [IAEA,2014] 2.2. Current Electricity Market in Turkey
The EML ensured a competitive market where private investors be it local or foreign would be attracted to make investments. There are currently two regulatory bodies under the new EML, Ministry of Energy and Natural Resources (MENR) and EMRA. MENR is responsible in determining the country’s short-term and long-term energy and resources requirements, setting objectives and making appropriate policies to meet determined objectives, supervising the power of public facilities and to co-ordinate building of new facilities, production and distribution activities.
On the hand, EMRA was responsible for preparing and implementing electricity market legislation, establish and oversee the tariff pricing mechanism and most importantly to regulate and supervise the electricity market, revoking and issuing licenses to compatible investors participating in the market. EMRA licenses granted under the EML are as follows:
17 b. Auto-producer licenses,
c. Auto-producer group licenses, d. Distribution licenses,
e. Transmission licenses, f. Wholesale licenses, and g. Retail licenses
The state’s responsibility was to conduct transmission activities under TEIAS and on top of that, the state acted as a supervisory and regulatory body for players under the EML law. Since the enactment of the first EML law in 2001, it has been subjected to several amendments over the years, some major amendments include the introduction of Day-Ahead planning in 2009. Day-Ahead planning created a system where the system operator works easier and makes contribution to real-time market balancing. Day-Ahead Market (DAM) came into force in 2011. In DAM, there’s opportunities to buy and sell energy for the day ahead in hand with the existing bilateral contracts of the market participants [Kiral, Kocatepe, & Uzunoglu, 2016].
In March 2013, one more amendment marked the introduction of the New EML (Law No 6446) and a new License Regulation on Generating Electricity Without a License (the “Unlicensed Generation Regulation”) which entered into force in November 2013. Under the Unlicensed Generation Regulation, power generating facilities with a capacity of up to 1MW based on RES did not require a license to operate. In March 2015, the Energy Markets Operations Corporation (EPIAS) was established in line with the new EML (6446). EPIAS was established to act as a market operator, other than the already acting system operator TEIAS to manage energy stock exchange and become an attractive investment opportunity [IEA, 2016].
Intraday market started operating in 2015, it created a market place that provided extra means for balancing especially for renewable energy resources. In addition to that, in 2016, a new investment model for renewables, Renewable Energy Resources Area Support Mechanism
18
was introduced to support renewable energy investments and motivate local manufacturing of renewable energy resources electricity generation facilities [EPIAS, 2016].
Further efforts are being made to integrate the Turkish power system. Recently there have been efforts to connect the Turkish power transmission system to the European Union (EU) power network. After a successful series of technical studies and trials carried out by Turkey’s electricity transmission company, TEIAS, for the parallel operation between the Turkish power system and the European Network of Transmission System Operators for Electricity (ENTSO-E) Continental Europe Synchronous Area, the Turkish electricity system started to operate permanently with ENTSO-E, after the approval of the ENTSO-E Continental Europe Regional Group (ENTSO-E RG CE) in 2014. TEIAS complied with the regulations and obligations existing in the ENTSO-E RGCE Operational Handbook, thereafter, the “Long Term Agreement” was signed between TEIAS and ENTSO-E in April 15th, 2015 [TEIAS, 2019].
This marked the alliance of the Turkish electricity market with the European Internal Electricity Market. Currently, Turkey transfers electricity to and from Europe. Turkey uses interconnections with Bulgaria and Greece to export a maximum of 400 MW and import capacity of up to 500 MW. In 2015, Turkey imported a total of 10.3 TWh from Bulgaria (7.1 TWh) and Greece (3.2 TWh) which accounted for 2% of total electricity consumption in that year. In addition, an agreement signed on January 14th, 2016, Turkey’s TEIAS became the first and only observer member in the newly initiated process of Observer Membership Status in the ENTSO-E. [Tagliapietra & Zachmann, 2015].
2.3. Electricity Consumption in Turkey
In recent years, electricity has emerged as an important energy form. Governments all over the world are on a mission to ensure they provide electricity in their respective countries. This is no different in Turkey, the Turkish citizens all over country have been supplied with this service since 1990 [World Bank, 2018]. Power outages in Turkey are a rare feature, the most recent power outage in Turkey was in March 2015 and it latest for ten (10) hours
19
[IEA,2016]. The blackout was a result of hydro oversupply from the eastern part of Turkey in transmission capacity storage. A heavy loaded transmission line tripped and led to disconnection of the Turkish electricity system from the ENTSO-E Continental Europe grid and eventually led to the blackout [ENTESO-E, 2015]
Over the years Turkey has experienced an increase in electricity demand due to growth of economic, demographic and social factors such as economic growth, urbanization, industrialization, population growth and so on. Electricity demand in Turkey reached 257.22 TWh in 2014 and the gross demand of electricity in 2017 reached 296.702 TWh, this shows an increase of 15.53% in electricity demand over a period of four years. Net consumption of electricity in 2014 was 207.375 TWh, respectively 2017 recorded 249.02 TWh, the latter is due to distribution and transmission losses [TEIAS, 2017]. Figure 2.2 shows the electricity consumption in Turkey in MWh from 1975 up to 2015.
Figure 2.2 Electricity Consumption in Turkey [TEIAS,2017]
0 50000 100000 150000 200000 250000 300000 350000 1975 1980 1990 2000 2007 2000 2007 2008 2009 2010 2011 2012 2013 2014 2015 MW h Years
Turkey's Electricity Consumption (MWh)
20
According to the data from the International Energy Agency, there are five sectors that consume significant amounts of electricity in Turkey namely;
• Industry Sector • Residential Sector
• Commercial and public services Sector • Agriculture Sector and,
• Transport Sector
In this study, electricity consumption by the transportation sector and agriculture sector are deemed insignificant hence the study only covers three main consumers: industrial, residential, and commercial and public services sectors. as illustrated in Figure 2.3, where the shares of electricity consumption by sector are given.
Figure 2.3 Electricity consumption by Sector [IEA, 2016] Industry 46% Transport 1% Residential 22% Commercial and public services 28% Agriculture 3% Others 0% Electricity Consumption by Sector - 2016
21
2.3.1. Industry sector
The most electricity consuming sector in Turkey has always been the industrial sector. Major industries in Turkey are based on production of agriculture products such as tea, hazelnuts, tobacco, tomatoes, watermelons and so on. Other major industries include textile, food processing, automotive, electronics, mining, tourism, construction, lumber and paper. Turkish products are very marketable in the world because of their high quality and durability and they are famous by their brand, “Made in Turkey”. The products are mainly exported to countries in the European Union (EU), Middle East and the USA. Figure 2.4 shows the shares of Turkey’s major exports partners in 2017. There is recent diversity in products exported out of Turkey, ranging from vehicles to jewelry, in Figure 2.5, the top ten products exported out of Turkey are given from 2012 to 2017 in Billions.
Figure 2.4 Turkey’s major Export Partners [OECD, 2018]
Through these exports and import activities, the Turkish industrial sector established itself as one of the major contributors of value-added percentage in Turkey’s GDP. In 2015, 27.9% of Turkey’s GDP was from the value added by the industrial sector, in addition to this fact, the manufacturing sector alone, contributed 17.51% of the total 27.9%. In 2017, the value added as percentage of GDP from the industry sector rose to 29.19% [World Bank, 2017].
Germany 10% United Kingdom 6% United Arab Emirates 6% Iraq 6% United States 6% Italy 5% France 4% Spain 4% Netherlands 3% Israel 2% Iran 2% Rest of the world 46%
Exports of goods, shares by main partners 2017, %
22
Figure 2.5 Top Ten Exported Products in Turkey [OECD, 2018]
According to the International Energy Agency report, Turkey was said to rank high among the OECD countries with energy intensive industries [IEA, 2009]. Figure 2.6 shows comparison in electricity consumption in Turkey’s industries against other sectors from 1990 up to 2011 in TWh. From Figure 2.6, the industrial sector consumes almost half of the total annual electricity consumption. The industrial sector consumed 95.844 TWh which accounted for 46% of total electricity consumption in 2014. Consumption went up in 2017, as the value rose up to 105.491 TWh.
0 5 10 15 20 25 30 2012 2013 2014 2015 2016 2017
Export shares of top 10 commodities
Vehicles Machinery and mechanical appliances Jewellery Clothing: knitted or crochete Iron and steel Electrical equipment Clothing: not knitted or crochete Articles of iron and steel
23
Figure 2.6 Electricity consumption in Turkish Industries [IEA,2016] 2.3.2. Residential sector
According to the results of the census carried out by the Address Based Population Registration System (ABPRS) in 2011; the number of households in Turkey was 19,481,678 and the average household size was 3.8 [TUIK,2013]. The average household size dropped to 3.5 in 2016 [TUIK,2017]. According to my calculations, Turkey’s total households in 2016 was around 22.804 Million. The demand for houses in Turkey increases yearly so do the sales of houses in Turkey. This rise in demand is due to two main factors: rapid population growth and the growth rate of urbanization in Turkey. Population growth in Turkey’s urban cities is greater than the overall growth of population, according to World Bank data, population growth in Turkey was 1.54% in 2017 while the urbanization rate was 2.22%. Figure 2.7 better illustrates this concept from 1960 to 2017.
0 50000 100000 150000 200000 250000 GWh Years
Industrial Sector Vs Other Sectors Electricity Consumption (GWh)
24
Figure 2.7 Population Growth and Urbanization in Turkey [TEIAS,2017]
This rural to urban migration and increase in household sizes in Turkey depicts high electricity demand and energy overall. Electricity consumption in residential sector was 41.464 TWh in 2010, moreover consumption reached 51.33 TWh in 2016 which marked a 23.79% increase in consumption. Figure 2.8 shows the increase in electricity consumption of Turkey’s residential sector over the years.
Figure 2.8 Electricity consumption in Turkey’s Residential Sector [TEIAS,2017]
0 1 2 3 4 5 6 7 1 9 6 0 1 9 6 2 1 9 6 4 1 9 6 6 1 9 6 8 1 9 7 0 1 9 7 2 1 9 7 4 1 9 7 6 1 9 7 8 1 9 8 0 1 9 8 2 1 9 8 4 1 9 8 6 1 9 8 8 1 9 9 0 1 9 9 2 1 9 9 4 1 9 9 6 1 9 9 8 2 0 0 0 2 0 0 2 2 0 0 4 2 0 0 6 2 0 0 8 2 0 1 0 2 0 1 2 2 0 1 4 2 0 1 6 %
Urbanization versus Population Growth in Turkey
Urban population growth (annual %) Population growth (annual %) 0 10000 20000 30000 40000 50000 60000 GW h Years
Electicity Consumption by Residential Sector in Turkey
25
2.3.3. Commercial and services sector
Turkey’s economy is booming especially with increase in number of foreign investments. According to Turkey’s Ministry of Economy (MOE) the number of firms with foreign capital was 7% of total companies but the share rocketed up to 58.4% in 2017. [Turkey’s Ministry of Foreign Affairs (MFA), 2018]. These foreign companies are spread out in almost all sectors, such automotive industries, machinery and equipment, energy, real estate, construction, aerospace and defense, retail, financial services and so on.
In return Turkey ‘s economy keeps rising and because of these activities conducted by foreign companies in Turkey together with local services contribute the largest share of value added to GDP. Value added to commercial and public services in Turkey contributed $453.76 Billion (51.13%) to overall GDP in 2017 [World Bank, 2017]. Turkey also benefits from job opportunities created by these companies hence it’s expected that Turkey’s income per capita will increase and decrease of unemployment rate in the coming years.
Electricity consumption by the commercial and public services had small share in 1970s but in the past two decades the consumption has been going up as it can be seen in Figure 2.9, whereby according to TEIAS the consumption sectors are categorized as household, governmental buildings, commercial, illumination, industrial, and others. Others sector is comprised of the total share of electricity consumption in the agriculture, livestock and fishery sector and municipal water abstraction pumping facilities and other public services. Commercial facilities consumed 27.70 TWh of electricity in 2010, in hand with growth and development of the commercial sector through local and foreign investments and policies by the government, in 2016, the consumption reached 43.47 TWh which was almost 19% of total electricity consumption [TEIAS,2017].
26
Figure 2.9 Shares of Net Electricity Consumption by Sector in Turkey (TEIAS, 2017) 2.4. Electricity Generation in Turkey
This significance increase of electricity demand requires enough and available electricity generation resources. Turkey is known for its rich fossil and renewable energy resources. Fossil fuels have been the dominant source of electricity generation in Turkey for many years. Among IEA member countries, Turkey ranked ninth-highest in shares of fossil fuel used for electricity generation in 2015, with a fifth-highest share in natural gas consumption [IEA, 2016]. Evidently, in 2017 natural gas contributed 37.2% of total electricity generated. Imported Coal and lignite were close second with a total of 32.8% of the total electricity generated. RES combined to generate 29.7% of total electricity generated in 2017. Hydro powered power plants (HPPs) contributed majority of the share among other RES (Table 2.1).
According to reports from the Ministry of Energy and Natural Resources, in 2017 Turkey invested a staggering 6.2 Billion USD in electricity generation plants. With this huge investment Turkey saw 5840 MW of capacity being taken into operation in 2017 and the total installed capacity in Turkey increased by 8.5% compared to 2016 values (see Table 2.2) [TEIAS, 2018]. The total installed capacity in Turkey was recorded at 85,200 MW by the end of 2017. 0.0 20.0 40.0 60.0 80.0 19 70 19 73 19 76 19 79 19 82 19 85 19 88 19 91 199 4 19 97 20 00 20 03 20 06 20 09 20 12 20 15 %
Distribution of Net Electricity consumption by Sector in Turkey Household Commercial Government Industrial Illumination Other
27
Table 2.1 Electricity generation by Resource in 2017 [TEIAS, 2018]
SOURCE GENERATION (GWh) CONTRIBUTION
(%) Imported Coal 51118.1 17.2 Hard Coal+Asphaltite 5663.8 1.9 Lignite 40694.4 13.7 Natural Gas 110490.0 37.2 Liquid Fuels 1199.9 0.4 Dam 41312.6 13.9
N.Lake And Run Of River 16905.9 5.7
Waste Heat 848.3 0.3
Wind 17903.8 6.0
Renewable Waste+ Waste 2124.0 0.7
Geothermal 6127.5 2.1
Solar 2889.3 1.0
TOTAL 297,277.5 100,0
Majority shares of investments made in Turkey’s power system in 2017 were based on natural gas and coal fired power plants. Natural gas power plants with a capacity of 2,621 MW were installed in 2017 and the investment cost for these power plants was around 2.23 Billion USD. Imported coal power plants with a capacity of 320 MW incurred an investment cost of 1.56 Billion USD. A total of 1821 MW of renewable energy capacity came into operation in 2017. Hydroelectric power plants (HPPs) and wind power plants (WPPs) with capacities of 736.9 MW and 746.3MW respectively started operating in 2017. An investment worth 1.1 Billion USD was made for the HPPs and 900 Million USD for WPP.
28
Table 2.2 Installed Capacity in Turkey in MW [TEIAS, 2018]
Year Thermal Hydro
Geothermal + Wind + Solar Total Installed Capacity % Increase 2010 32278.5 15831.2 1414.4 49524.1 10.6 2011 33931.1 17137.1 1842.9 52911.1 6.8 2012 35027.2 19609.4 2422.8 57059.4 7.8 2013 38648.0 22289.0 3070.5 64007.5 12.2 2014 41801.8 23643.2 4074.8 69519.8 8.6 2015 41903.0 25867.8 5375.9 73146.7 5.2 2016 44411.6 26681.1 7404.7 78497.4 7.3 2017 46926.3 27273.1 11000.6 85200.0 8.5
Despite Turkey’s efforts to increase the level of installed capacity in the country, Turkey still must import electricity from nations such as Greece and Bulgaria through the ENTSO-E network in order to meet its demand (see Table 2.3). The Turkish Statistical Institute reported that in 2016, Turkey’s electricity import bill was 213.6 Million USD. Furthermore, in 2017, due to large investments made to support and increase domestic installed capacity as explained before, the electricity import bill dropped to 85.5 Million USD which marked a 60% decrease between the two years. Further developments in investments of installed capacity in Turkey saw the electricity import bill drop by 33% in 2018. The electricity import bill in 2018 was 57.03 Million USD [TUIK, 2018].
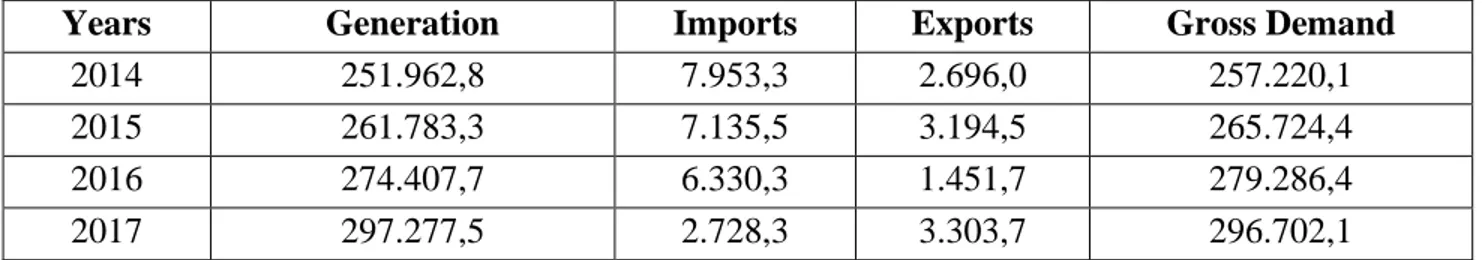
Table 2.3 Electricity Generation, Imports and, Exports in Turkey in GWh
Years Generation Imports Exports Gross Demand
2007 191.558,1 864,3 2.422,2 190.000,2 2008 198.418,0 789,4 1.122,2 198.085,2 2009 194.812,9 812,0 1.545,8 194.079,1 2010 211.207,7 1.143,8 1.917,6 210.434,0 2011 229.395,1 4.555,8 3.644,6 230.306,3 2012 239.496,8 5.826,7 2.953,6 242.369,9 2013 240.154,0 7.429,4 1.226,7 246.356,6
29
Years Generation Imports Exports Gross Demand
2014 251.962,8 7.953,3 2.696,0 257.220,1
2015 261.783,3 7.135,5 3.194,5 265.724,4
2016 274.407,7 6.330,3 1.451,7 279.286,4
2017 297.277,5 2.728,3 3.303,7 296.702,1
2.5. Electricity Generating Resources in Turkey 2.5.1. Natural gas
Turkey has little primary natural gas reserves. Licenses to operate in natural gas exploration and production are issued by the Turkish General Directorate of Petroleum Affairs. Production and exploration activities are performed and monitored under the Turkish Petroleum Law, Law No 6491. Natural gas production in Turkey has been decreasing, reaching 12501 Million cubic feet (mcf) in 2017 compared to production levels in 2008, 34220 mcf (see Table 2.4). Domestic natural gas production accounts for 1% of total natural gas demand in Turkey, the rest is imported.
Table 2.4 Natural Gas Production in Turkey 2008 -2017 (million cubic feet) (EPDK, 2018)
Years 2008 2009 2010 2011 2012 2013 2014 2015 2016 2017
Amounts 34220 24155 24085 26803 22319 18964 16916 13455 12960 12501
Due to insufficient natural gas reserves and low production levels, Turkey is dependent on importing natural gas. Most of the electricity demand in Turkey is genuinely met by natural gas. Experts believe that the current trend is unlikely to change, therefore, a major share of electricity demand will continue to be met by natural gas imports [Melikoglu, 2013]. Turkey started liberalization of its natural gas market in 2001. This process saw the monopoly player in the market, Turkey’s Petroleum Pipeline Corporation (BOTAS) lose its power in the natural gas market with the enactment of Natural Gas Market Law (NGML) under Law No 4646 in 2001. BOTAS lost its monopoly power on natural gas imports, distribution and sales. Despite losing its monopoly power BOTAS is still the major player in the natural gas market as there haven’t been enough efforts to disintegrate BOTAS into separate companies.
30
Liberalization of the natural gas market perpetuated the involvement of licensed companies other than BOTAS to operate in import activities in Turkey such as Enerco, Bosphorus Gaz, Shell Gaz and so on. Turkey currently imports natural gas from Russia, Turkmenistan Azerbaijan and Iran. There have also been developments in liquefied natural gas (LNG) consumption in Turkey, hence Turkey imports LNG from Nigeria and Algeria (see Table 2.5). Moreover, according to the energy balance data released annually by the MENR, almost half of the imported natural gas per year is used in electricity generation activities [MENR]. Natural gas has been the dominant electricity generation resource in Turkey and despite efforts to include RES in the generation mix, the importance of natural gas in Turkey’s electricity generation mix is almost unchanged, in fact electricity generated by natural gas in 2016 (89,227 GWh), is almost nine times compared to generated amount in 1990, 10192 GWh [IEA ,2018]. For the foreseen future, natural gas will still be included in Turkey’s generation mix, as a matter of fact, one of the objectives in the NREAP, is maintaining a maximum of 30% share of natural gas in the electricity generation mix [NREAP, 2018].
Table 2.5 Natural gas Import activities in Turkey [EPDK, 2018]
Countries Russia Iran Azerbaijan Algeria Nigeria Others* Total
Change
(%)
Years Amount Share
(%) Amount Share (%) Amount Share (%) Amount Share (%) Amount Share (%) Amount Share (%) Amount 2008 23.159 62,01 4.113 11,01 4.580 12,26 4.148 11,11 1.017 2,72 333 0,89 37.350 4,21 2009 19.473 54,31 5.252 14,65 4.960 13,83 4.487 12,51 903 2,52 781 2,18 35.856 -4 2010 17.576 46,21 7.765 20,41 4.521 11,89 3.906 10,27 1.189 3,13 3.079 8,09 38.036 6,08 2011 25.406 57,91 8.190 18,67 3.806 8,67 4.156 9,47 1.248 2,84 1.069 2,44 43.874 15,35 2012 26.491 57,69 8.215 17,89 3.354 7,3 4.076 8,88 1.322 2,88 2.464 5,37 45.922 4,67 2013 26.212 57,9 8.730 19,28 4.245 9,38 3.917 8,65 1.274 2,81 892 1,97 45.269 -1,42 2014 26.975 54,76 8.932 18,13 6.074 12,33 4.179 8,48 1.414 2,87 1.689 3,43 49.262 8,82 2015 26.783 55,31 7.826 16,16 6.169 12,74 3.916 8,09 1.240 2,56 2.493 5,15 48.427 -1,7 2016 24.540 52,94 7.705 16,62 6.480 13,98 4.284 9,24 1.220 2,63 2.124 4,58 46.352 -4,28 2017 28.690 51,93 9.251 16,74 6.544 11,85 4.617 8,36 1.344 2,43 4.804 8,7 55.250 19,2 2.5.2. Coal
Turkey is well known for its domestic coal reserves in contrast to its limited oil and gas resources. In line with efforts to decrease energy dependency on foreign nations, Turkey aims to increase
31
utilization of its vast domestic lignite reserves. According to MENR, Turkey has acquired medium levels in terms of reserves and production levels of lignite and low levels in hard coal (anthracite). Turkey has approximately 3.2% of the world’s total lignite reserves [MENR]. Lignite is Turkey’s most important indigenous resource and, lignite reserves are located all over Turkey (see Figure 2.10). Turkey has a total of 17.3 gigaton of reported lignite reserves. The most important lignite reserves in Turkey are in the south-eastern Anatolia nearby the city of Maraş in the Afşin-Elbistan lignite basin. It is estimated that 46% of total coal reserves are in the area. The only problem is that, the grade of the lignite found in Turkey is low and according to a report by EURACOAL only 5.1% of total lignite reserves in Turkey have a heat content value of over 3000 kcal/kg (12500 kJ/kg), while another small share of the reserves (3.4%) have a heat content value above 4000 kcal/kg [EURACOAL, 2018].
Figure 2.10 Lignite Reserves in Turkey [Ediger et al, 2014]
Another issue affecting coal production in Turkey is that there’s only one main hard coal reserve in Turkey located in Zonguldak basin a province by the Black Sea coast in north-western region of Turkey. The total hard coal reserves in the Zonguldak basin are 1.3 gigaton but MENR reported
32
only 506 Million tons are visible reserves [MENR, 2019]. In addition to that, the geological location of these reserves makes it difficult for mechanized coal extraction therefore coal production activities require intensive-labor methods.
On top of that, Turkey is also dependent on coal imports. In 2016, Turkey imported 36.2 Million tonnes (Mt) of coal which was an increase of 21.5% compared to 2014 Values (29.8 Mt). Almost 49% (17780 Mt) of the imported coal was used for electricity generation purposes [IEA, 2018]. According to TEIAS data, in 2017, Turkey recorded a total of 18666 MW of installed capacity from coal resources. The installed capacity of domestic coal was 9873 MW, whilst imported coal installed capacity was 8794 MW. Increased utilization of coal resources saw an increase in domestic coal installed capacity in Turkey, and by the end of September 2018, the total installed capacity from coal reached 18998 MW, installed capacity of domestic coal increased up to 10204 MW. There was no increase in imported coal capacity [TEIAS, 2018].
In the [Strategic Plan 2015 – 2019] which was prepared and released by the MENR, states the importance of diversifying electricity generation resources in Turkey. The plan states that electricity production from domestic coal will be increased to 60 Billion kWh annually by the end of the plan’s period. The plan considers 2013 as the base year for these projections (see Table 2.6).
Table 2.6 Electricity Generation Projections by Domestic Coal in Turkey
Years 2013 2015 2017 2019
Generation (Billion kWh) 32.9 40 50 60
2.5.3. Oil
Oil is mostly used in the transportation sector and as industrial material. Turkey does not produce significant amounts of oil. In the early 2000s, oil was one of the major electricity generating resources in Turkey. In 2002, electricity generation from oil was 10192 GWh, but the generated amount has since then been dropping over the years and in 2017 it dropped to almost 1200 GWh, marking an 88.2% decrease in generation from oil. Moreover, in 2017,

![Figure 2.1 The Structure of the Current Electricity Sector in Turkey [IAEA,2014] 2.2](https://thumb-eu.123doks.com/thumbv2/9libnet/4324631.70959/31.918.184.850.147.577/figure-structure-current-electricity-sector-turkey-iaea.webp)
![Figure 2.2 Electricity Consumption in Turkey [TEIAS,2017]](https://thumb-eu.123doks.com/thumbv2/9libnet/4324631.70959/34.918.173.834.372.931/figure-electricity-consumption-in-turkey-teias.webp)
![Figure 2.3 Electricity consumption by Sector [IEA, 2016] Industry46%Transport1%Residential22%Commercial and public services28%Agriculture3%Others0%Electricity Consumption by Sector - 2016](https://thumb-eu.123doks.com/thumbv2/9libnet/4324631.70959/35.918.213.841.424.1003/electricity-consumption-transport-residential-commercial-agriculture-electricity-consumption.webp)
![Figure 2.6 Electricity consumption in Turkish Industries [IEA,2016] 2.3.2. Residential sector](https://thumb-eu.123doks.com/thumbv2/9libnet/4324631.70959/38.918.170.868.117.526/figure-electricity-consumption-turkish-industries-iea-residential-sector.webp)

![Table 2.1 Electricity generation by Resource in 2017 [TEIAS, 2018]](https://thumb-eu.123doks.com/thumbv2/9libnet/4324631.70959/42.918.161.847.155.645/table-electricity-generation-resource-teias.webp)
![Table 2.2 Installed Capacity in Turkey in MW [TEIAS, 2018]](https://thumb-eu.123doks.com/thumbv2/9libnet/4324631.70959/43.918.170.796.143.519/table-installed-capacity-turkey-mw-teias.webp)