Research Article
Mood Detection from Physical and Neurophysical Data Using
Deep Learning Models
Zeynep Hilal Kilimci ,
1Aykut G¨uven,
2Mitat Uysal,
1and Selim Akyokus
31Department of Computer Engineering, Dogus University, Istanbul, Turkey
2Idea Technology, Istanbul, Turkey
3Department of Computer Engineering, Istanbul Medipol University, Istanbul, Turkey
Correspondence should be addressed to Zeynep Hilal Kilimci; [email protected]
Received 1 August 2019; Revised 15 October 2019; Accepted 19 November 2019; Published 14 December 2019 Guest Editor: Gonzalo Guti´errez-Tobal
Copyright © 2019 Zeynep Hilal Kilimci et al. This is an open access article distributed under the Creative Commons Attribution License, which permits unrestricted use, distribution, and reproduction in any medium, provided the original work is properly cited. Nowadays, smart devices as a part of daily life collect data about their users with the help of sensors placed on them. Sensor data are usually physical data but mobile applications collect more than physical data like device usage habits and personal interests. Collected data are usually classified as personal, but they contain valuable information about their users when it is analyzed and interpreted. One of the main purposes of personal data analysis is to make predictions about users. Collected data can be divided into two major categories: physical and behavioral data. Behavioral data are also named as neurophysical data. Physical and neurophysical parameters are collected as a part of this study. Physical data contains measurements of the users like heartbeats, sleep quality, energy, movement/ mobility parameters. Neurophysical data contain keystroke patterns like typing speed and typing errors. Users’ emotional/mood statuses are also investigated by asking daily questions. Six questions are asked to the users daily in order to determine the mood of them. These questions are emotion-attached questions, and depending on the answers, users’ emotional states are graded. Our aim is to show that there is a connection between users’ physical/neurophysical parameters and mood/emotional conditions. To prove our hypothesis, we collect and measure physical and neurophysical parameters of 15 users for 1 year. The novelty of this work to the literature is the usage of both combinations of physical and neurophysical parameters. Another novelty is that the emotion classification task is performed by both conventional machine learning algorithms and deep learning models. For this purpose, Feedforward Neural Network (FFNN), Convolutional Neural Network (CNN), Recurrent Neural Network (RNN), and Long Short-Term Memory (LSTM) neural network are employed as deep learning methodologies. Multinomial Na¨ıve Bayes (MNB), Support Vector Regression (SVR), Decision Tree (DT), Random Forest (RF), and Decision Integration Strategy (DIS) are evaluated as conventional machine learning algorithms. To the best of our knowledge, this is the very first attempt to analyze the neurophysical conditions of the users by evaluating deep learning models for mood analysis and enriching physical characteristics with neurophysical parameters. Experiment results demonstrate that the utilization of deep learning methodologies and the combination of both physical and neurophysical parameters enhances the classification success of the system to interpret the mood of the users. A wide range of comparative and extensive experiments shows that the proposed model exhibits noteworthy results compared to the state-of-art studies.
1. Introduction
Intelligent and integrated devices became one of the essential parts of both our social and business daily life. Especially, computers, phones, tablets, sensors, and cloud services have been part of our private and public domains all around the world in the last decades. These devices gather many pa-rameters about their users including mobility (walking, running, and climbing) information, sleep time, and places where the users visited. Moreover, new developments in
technology integrate these devices to the biological body of their users, and this creates online information about human beings accessible by all over the world [1]. Being online generally increases tension/stress level of the user and lowers his/her immunity against regular life/business problems. There is a strong relation between stress and mental health and having emotional intelligence help to manage this re-lationship [2]. Many countries have strong regulations for users who work at critical positions. They regularly need to take Neurophysical Testing (NPT) to ensure mental health is
Volume 2019, Article ID 6434578, 15 pages https://doi.org/10.1155/2019/6434578
good to avoid risks depending on stress. The application period of NPT is usually one a year or twice which is not sufficient. Measuring such risks should be a part of daily operation which can be easily realized with intelligent and integrated devices. These devices are already being started to be used by millions of people as smart watches or mobile phones. Otherwise, user-oriented mistakes may cause dif-ficult situations to be not compensated. According to Quorum Disaster Recovery Report, Q1 2013, disaster per-centage created by users is 22%, while hardware failures 55%, software failures 18%, and natural disasters 5%, merely. Furthermore, understanding users’ neurophysical condi-tions using devices has a long history. Earlier studies as stated in Section 2 used computer keyboards to gather data about the users [3–16]. Keyboard patterns have been used in many studies including identification and authorization. One of the first studies is implemented in [17] which demonstrates that the keystroke information can be used to enforce more security in computer systems in 1980. Base keystroke patterns and some of derived parameters from keystroke patterns are also used as a feature in our study.
IoT (Internet of Things) is thought as network of sensors. Our study creates a private IoT network. Smart devices like smart watches and mobile phones are capable of measuring various parameters of their users such as heart data, sleep time, mobility, blood pressure, and body temperature by means of sensors [1]. These metrics are named and used as physical parameters in our study.
In this study, we propose and implement a system to analyze collected parameters of the users. A custom mobile application is designed in order to gather information from users. The mobile application collects and records physical and neurophysical parameters from each user and transfers into a central repository. Neurophysical parameters are keystroke parameters while physical parameters are heart-beat, motion, energy, and sleep used in this work. Physical and neurophysical parameters are consolidated as a novelty presented by the study. One year data are collected from 15 users to demonstrate the effectiveness of this work. The aim of the study is to find a relation between these parameters and users’ moods.
There are many types of classifiers used in different research areas such as text categorization, image classifi-cation, and pattern recognition. The most of supervised algorithms for classification is reviewed and compared in papers [17–19]. Some of the commonly used classification algorithms include K-Nearest Neighbors (K-NN), Na¨ıve Bayes (NB), Artificial Neural Networks (ANN), Decision Trees (DT), and Support Vector Machines (SVMs). Con-ventional machine learning and deep learning models are used together in the study. One of the aims of the study is to evaluate performance of conventional machine learning and deep learning models. Because of both superior performance of deep learning models in the literature and the lack of studied for the implementation of deep learning models on mood detection field, different deep learning techniques are employed in this study. These are Feedforward Neural Network (FFNN), Convolutional Neural Network (CNN), Recurrent Neural Network (RNN), Long Short-Term
Memory neural network (LSTM). Furthermore, Multino-mial Na¨ıve Bayes (MNB), Support Vector Regression (SVR), Decision Tree (DT), Random Forest (RF), and Decision Integration Strategy (DIS) algorithms are used as traditional machine learning algorithms. Experimental results are collected for each of the algorithms as a part of our study. We have also considered similar studies and their performances. Experimental results indicate that the consolidation of both physical and neurophysical parameters and the utilization of deep learning methodologies increase the classification success of the system to understand the emotion of the users.
Our main contributions are summarized as follows: (i) We propose the usage of the combination of
physical and neurophysical features to predict the mood of users which is the novelty of this study (ii) For the purpose of detecting the mood of user, both
conventional machine learning algorithms and deep learning techniques are employed and classification performances of each model are compared (iii) To demonstrate the contribution of proposed
model, a customized data gathering platform is constructed and data collected for one year The rest of this paper is organized as follows: Section 2 gives a summary of related work about parameters for the estimation of user behaviors and emotion analysis of the users. Section 3 describes the methodology and proposed framework. Sections 4 and 5 present experimental results and conclusions, respectively.
2. Related Works
This section gives a summary about related studies. Studies related to physical and neurophysical parameters are in-vestigated in the literature.
Keystroke patterns are one of the considered parameters of our study. There are several methods on keystroke-based user recognition such as minimum distance [3–6], statistical [7–9], data mining [10], and neural networks [11–13]. These methods are employed to determine the keystroke dynamics in the state-of-the-art studies. One of the main researches of keystroke dynamics is authentication. The usability of keystroke dynamics for hardening password and encryption is represented in [14]. As a result of these studies, it is ac-cepted that every user has a unique pattern while using the keyboard. This unique pattern is called as TypingDNA. TypingDNA is utilized to differentiate users. The study in [14] proposes to understand users’ behaviors using Key Press Delay (KPD) and Key Stroke Delay (KSD) techniques. KPD stands for time delay between two keyboard chars. KSD stands for total time of one keyboard char press. The ex-perimental results exhibit that KPD and KSD perform well to differentiate users. Measuring KPD and KSD patterns gives a glue to the researchers about users’ neurophysical conditions. Each user has a base KPS/KSD value during under normal conditions, but KPD/KSD values are rapidly changing under abnormal situations [15]. Although the most of keystroke pattern recognition studies aims to identify
users, there are also several studies to analyze the emotions of the users using keystroke patterns [16]. In this study, we have derived another parameter named Error Count (EC) as an addition to current keystroke parameters. Error Count (EC) parameter holds typing errors during keyboard usage. All these 3 keystroke patterns are used as neurophysical parameters of this study.
Image processing techniques are also used to understand users’ behaviors. In [20], MIT researchers developed an algorithm that predicts how two people approach each other using the given images. The algorithm tries to estimate the next movement of two people by analyzing given images. Patterns are recognized, and the final movements such as hug, high five, and handshake are estimated with the pro-posed algorithm. This study employs images to forecast the features that are extracted from images and calculates probabilities of the final movement. Electroencephalography (EEG) devices are also utilized in some of studies in the literature [21–29]. In [21], it is shown that measuring EEG signals gives an opinion about human emotional conditions. Discrimination between calm, exciting positive, and exciting negative emotional states is observed when EEG is used.
Heartbeat is one of the common parameters used to dif-ferentiate user emotions. It is known that heartbeat changes depending on environmental and biological conditions. It beats faster in extraordinary conditions and gets slow when in a relax environment [30]. Even listening to classical music gives an overall insight about user emotional condition because of its effect on our heartbeat [30]. While early studies use electro-mechanical film (the EMFi chair) sensors to get parameters [31], recent technology is capable of obtaining these parameters using ordinary smart watches. In another study [32], Harper and Southern focus on the just heartbeat dataset to interpret the emotions of users. For this purpose, Bayesian algorithm is employed as a classification algorithm. They conclude that the usage of heartbeat dataset and Bayesian algorithm for the classification purpose achieves 90% accuracy value. In [33], extensive experiments are conducted on the heartbeat dataset to identify psychoneural illnesses. Heart rate variability (HRV) is used to differentiate several emotional states which may be an indicator for illness. In another study [34], Zhu et al. conclude their study stating that the heartbeat is a good indicator for identifying disorders and evaluation of emotions is a key value to identify emotional disorders. Heartbeat is considered as one of the physical parameters in our study.
Sleep quality is one of the parameters of this study. There is a strong relation between sleep quality and emotional condition [35]. The study [36] demonstrates that insufficient sleep duration or sleep quality may cause many problems including negative emotions, perceptual anomalies, even paranoia. In another study [37], Garett et al. concentrate on showing the relation between social media usage and sleep quality by observing twitter messages of college students for the purpose of analyzing emotional states of students. Ex-perimental results of the study [37] demonstrate that the usage of social media is associated with sleep quality among students. Sleep quality has also similar effects even in older ages. In [38], it is claimed that increasing sleep quality creates meditation effect in older adults.
Motion/energy and walking posture parameters are also considered to identify the user emotions [39]. Walking posture is easily observable and changeable when people is under stress. In the study [40], it is emphasized that walking style also impacted physiological states during stress and changing the way a person walks may improve their re-sponses to stress. Human gait analysis is also one of the popular research areas in emotion identification. In [41], venture et al. clarify that it is possible to identify several emotion states like neutral, joy, anger, sadness, and fear. The experimental results represent that the use of the gait analysis characterizes each emotion which is supported by accuracy results. Motion and energy parameters are con-sidered as physical parameters in our study.
Sentiment analysis has recently become a popular re-search field. There are many studies to specify and classify users’ feelings by using social media platforms [42, 43]. It is usually difficult to analyze texts for interpreting emotions. Textual information broadly includes two categories: facts and opinions [44]. Facts about entities, events, and their properties are described by objective expressions. Subjective expressions usually describe opinions about people’s sen-timents, appraisals or feelings toward entities, events, and their properties [45]. In this study, the main focus is not to implement sentiment analysis to understand the mood of users. Instead of this, predefined emotion-attached ques-tions are employed. Daily-basis quesques-tions and answers are collected with these questions. Thus, not the opinions but the facts are obtained by interacting with the users. The user answers are mapped to the sensitivities and correlated with physical and neurophysical parameters.
Our work differs from the mentioned literature studies above. There are many different types of parameters col-lected in order to increase the classification accuracy of the system. In this study, not only physical but also behavioral/ neurophysical parameters and the combination of them are evaluated while the literature studies above usually focus on one or few parameters. Moreover, the inclusion of deep learning models in addition to the traditional machine learning algorithms boosts the classification performance of the proposed system.
3. Methodology
Figure 1 shows basic steps of tasks performed during this study. Data collection part was one of the difficult parts of the study because finding volunteers for such a long period was a problem and not accepted by many people. Data collection was started with 15 volunteers, and the dataset was composed of data gathered from 15 different users in the age range 25–35 for nearly 365 days. As mentioned in former sections, data have two parts: physical and neurophysical. Sensors of smart watches are used to obtain physical data. By default, smart watches measures and sends these measure-ments to mobile phones. Mobile phones store all the measurements in their local database. Any application like ours can access these data and process it or send the data to another location for processing. Another functionality of the application is to interact with the users and to ask them six
random questions to understand their emotional conditions. These questions are asked in the mornings and at the end of the day and takes just one minute to completed. Each question has a hidden emotional value. If a user has positive answer to a question, it is expressed as 1, and otherwise as
−1. Some of the sample questions are given below:
Question 1: “I believe that it is going to be a good day” Emotion: positive
Question 2: “There will be another boring day” Emotion: negative
Question 3: “I feel empty and do not have any energy” Emotion: negative
Questions generate − 1 or 1 value. For Question 1, if the user agrees about the statement, it returns 1 otherwise − 1 because Question 1 is positive emotion loaded question. On the other hand, Questions 2 and 3 are negative emotion loaded questions. If the user agrees about the statement it generates − 1 and 1 if disagreed.
Figure 2 shows feeling attribute values that range from
−4 to 4. It is calculated as the sum of answers to questions.
The highest one symbolizes better mood of the user. In this way, all physical and behavioral parameters and corre-sponding emotional statuses are obtained with the proposed model. The developed mobile application collects all data and sends it to a central repository. The central repository keeps data with a timestamp and an anonymous user id. Data are collected hourly. Each sensor may have multiple measurements per minutes. For instance, heartbeats may have several values in a regular condition and number of the measurements taken can increase when the user is in ab-normal situation like sporting or over stress. Thus, sensors create hundreds of measurements for each hour. Data are preprocessed before machine learning stage. Especially, data like heartbeat need a special preprocessing stage. It is one of the large data creators. Our study focuses to capture ab-normal parameter values. Heartbeat has a base value for each user. Our study shows that base value is approximately 90 percent of taken measurements. Remaining 10 percent is usually different from the base value. Abnormal situations usually increase the heartbeat frequency. Heartbeat fre-quency lowers when the user is in relaxing conditions. This %10 is a good indicator to capture emotional transitions. Heartbeat values are collected as base value and abnormal values. Average of the values is calculated and recorded as heartbeat value of the corresponding hour.
Energy, sleep, and step parameters are cumulative and supplied by smart watches. They are also recorded on an hourly basis. Each hour’s value is calculated by subtraction of the previous hour’s value.
Total time, EC, and Avg values are keyboard pattern parameters. Users periodically type a given short text on the devices. Total time spent to complete typing, average time of typing (Total time/number of characters), and typing errors are recorded as neurophysical parameters. Users are asked to type given texts at least once a day.
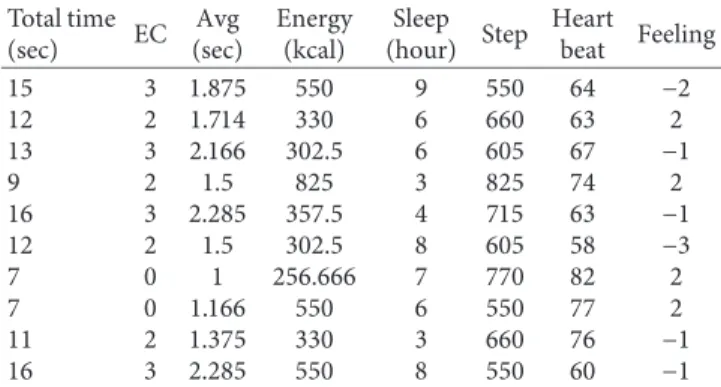
Data are collected on an hourly basis, and total size of the data is 365 × 24 × 15 (day × hour × users). Before machine learning stage, data are summarized to daily basis by taking the average values of the parameters. 1 row of data per a user stores all parameters with their summarized values. Ap-proximately 365 × 15 matrix is created for 1 year of data. This matrix contains all physical and behavioral data for 15 users as it is shown in Table 1.
After collecting the physical and neurophysical data, machine learning algorithms are applied to the dataset. Experiments are carried out on CPU using 12 threads in an
Intel
®
Xeon®
E5-2643 3.30 GHz machine. Python 3 versionwith Pycharm environment is employed as a programming framework. Apple iWatch and Vestel smart watch devices are used for data collection. iPhone 7 and 8 smart phone models are compatible and used to gather data from these smart watches. Sensor specifications are given as reference [46].
Feeling field in Table 1 is used to label data. Dataset is divided into two halves randomly. 67% of the dataset is employed for the training process, and the remaining part is kept as the test data. After that, Multinomial Na¨ıve Bayes, Support Vector Regression, Decision Tree, Random Forest, Feedforward Neural Network algorithms, Decision In-tegration Strategy, and Deep Learning algorithms are per-formed. After the training step, each of the algorithm is executed and their classification performance recorded.
A detailed description of the parameters is given in Section 3.1.
3.1. Neurophysical Parameters. Data of the study have 3
parameters related to keystroke parameters. They are Total Time, Average Time, and Error Count. They are classified as neurophysical parameters.
3.1.1. Keystroke Dynamics Measurement. Keystroke
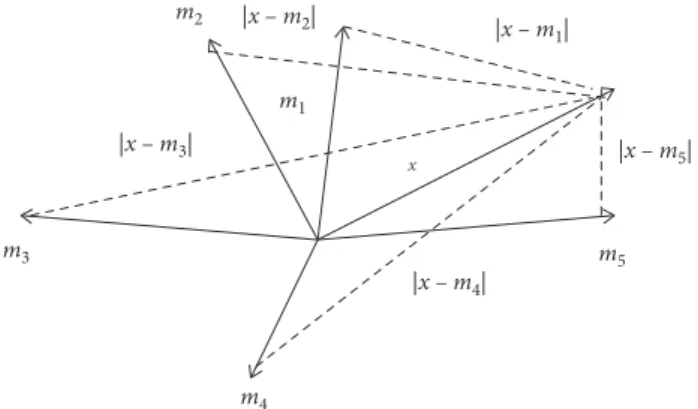
dy-namics is about measurement of keystroke timings. The identification of keystroke is one of the main study fields of emotion analysis. There are three approaches for keystroke identification, namely, Euclidean distance measure (EDM), nonweighted probability, and weighted probability. These are the most widely used methods used in the literature. Distance between pattern vectors is measured with EDM approach as seen in Figure 3. Assume that there are two pattern vectors R and U, where R stands for real time vector and U signifies the reference vector of user. Mathematical equations of these two N dimensional vectors can be written as follows: R � r 1, r2, r3, r4, r5, . . . , rn, U � u 1, u2, u3, u4, u5, . . . , un, D(R, U) � ���������� ri− ui2 . (1)
In this study, keystroke dynamics are employed to calculate the total time of parameters. Measured KPD and KSD parameters are stored as total time parameter.
In Figure 4, <x1, x2, x3, . . ., xd> are biometric pattern
values generated either by KSD or KPD.
Assume that KPD and KSD are N dimensional vectors which are seen in Figure 5 and expressed as follows:
KPD � uiIi, KSD � xiIi, total time � ������������ (KPD + KSD)2 ,
average time � total time
text length.
(2)
Total time and average time parameters are obtained using the custom application which is created for this study. Application asks users to type some random texts and measures both parameters.
3.1.2. Error Count Measurement. Error Count (EC) is third
keystroke parameters used in the study. Typing errors are recorded when users are typing given text. Expected value of
Data collection Physical data collection process Neurophysical data collection process Classification
Conventional ML algorithms Deep learning algorithms
Support Vector
Machine Random Forest
Decision Tree Multinomial Naive Bayes Feedforward Neural Networks Recurrent Neural Networks Convolutional Neural Networks Long Short-Term Memory Neural Networks
Decision Integration Strategy
Final decision for conventional ML
algorithms
Figure 1: Flowchart of the proposed system.
Table 1: An example of samples of collected data in the repository. Total time (sec) EC Avg (sec) Energy (kcal) Sleep (hour) Step Heart beat Feeling 15 3 1.875 550 9 550 64 −2 12 2 1.714 330 6 660 63 2 13 3 2.166 302.5 6 605 67 −1 9 2 1.5 825 3 825 74 2 16 3 2.285 357.5 4 715 63 −1 12 2 1.5 302.5 8 605 58 −3 7 0 1 256.666 7 770 82 2 7 0 1.166 550 6 550 77 2 11 2 1.375 330 3 660 76 −1 16 3 2.285 550 8 550 60 −1 –4 –3 –2 –1 0 1 2 3 4
Very bad Bad Neutral Good Very good
Error Count is 0. Abnormal situations increase the value of Error Count. This parameter can be a key indicator to
understand emotional condition of a user. Error Count (Ec)
is measured on each iteration and recalculated using moving average method by considering previous measurement values. Calculated Error Count parameter is represented by
Ψ. In formula (3), Ecindicates error count of the current
iteration. Ψecis current calculated value of error count and
Ψec− 1 is the previous calculated value of the Error Count.
Figure 6 shows how Ecvalue is calculated in several
itera-tions. ω represents independent iteraitera-tions. Iteration 1 (ω1)
has 4 errors while others 2 and 1. Table 2 shows values of Ec
and Ψec. Error Count measurement is done on a daily basis,
and only one value is created for each day depending on iteration number:
Ψec�
Ψec− 1+ Ec
2 . (3)
Error count parameters are obtained using the custom application which is created for this study.
3.2. Physical Parameters. There are many physical
param-eters which can be obtained using standard intelligent de-vices. Sleep quality, energy, mobility/movement, and heart pulse rates are accepted as physical parameters in this work.
3.2.1. Sleep Quality Measurement. Sleep quality is a
signif-icant component of physical and mental health as well as overall well-being. There are different indicators to mea-sure the quality of sleep such as time in sleep. Although time is not the only parameter, it gives a general per-spective about the quality of sleep. We considered total
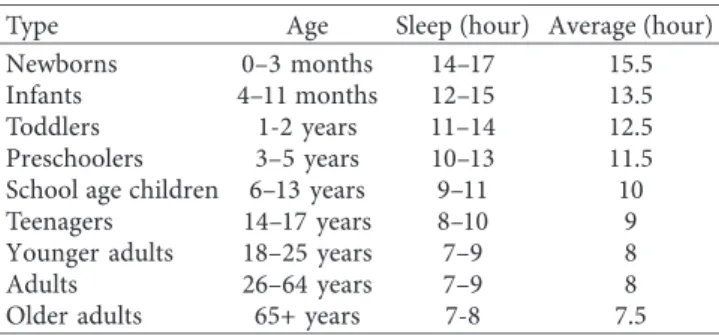
sleep time (Sst) as main input for sleep quality. In Table 3,
recommended sleep durations by age are given. Table 3 shows type of people by ages and their corresponding sleep durations recommended by National Sleep Foundation (NSF) in 2005 which is called Sleep Health Index (SHI). After a rigorous, systematic review of the world scientific literature involving sleep duration to health, performance, and safety, SHI is the first index developed by a pro-fessional organization for age-specific recommended sleep durations [47].
Today, smart devices have the capability of measuring the sleep time. Sleep analysis is commonly used by people to understand and interpret their sleeping habits like “Time to go bed,” “In bed duration,” and “Sleep duration.” In this
study, sleep quality is calculated with equation (4). Ψsq
identifies the sleep quality parameter. It is a constant value for each day depending on sleep time of a user.
Ψsq� Sst. (4)
The sleep quantity parameter is obtained using a smart watch. The smart watch measures and sends sleep time daily basis.
3.2.2. Energy Measurement. Energy is evaluated in two main
parts such as active energy (Eae) and resting/passive (Epe)
energy. Passive energy is the minimum level of energy to keep live for a human being and used as base level of energy usually used by body itself. On the other hand, an active energy is exposed by burning when a human being exhibits an extra effort. In this study, total energy which is the sum of both is
employed. Ψeqrepresentation of total energy in formula (5):
Ψeq� Eae+ Epe. (5)
The energy parameter is acquired using a smart watch. The smart watch measures and sends energy daily basis.
3.2.3. Mobility/Movement Measurement. Mobility/movement
(Emm) is a measure of steps taken for a period of time.
Depending on life style of each individual, it exhibits an
|x – m2| |x – m 1| |x – m5| |x – m4| |x – m3| m1 m2 m3 m4 m5 x
Figure 3: Sum of error calculation between vectors in EDM.
x1 x2 x x3 x1 x2 . . . xd x =
Figure 4: A vector created using biometric values.
Total time
KSD
KPD
average value. Depending on illness or a rush day, this value can vary and is a good indicator to distinct an ordinary day
and unordinary day. Ψmq stands for mobility parameter
which is basically the total step count the corresponding day:
Ψmq� Emm. (6)
The mobility/movement parameter is obtained using a smart watch. The smart watch measures and sends step counts daily basis.
3.2.4. Heart Pulse Measurement. Heart pulse is a measure
for heart beats for an individual and has an average value for each user. In this study, average heart beat value is defined as
base heartbeat value (Hbase). All base and abnormal
heart-beats (H) are measured, and the average value of heartheart-beats is calculated for each hour. Daily value is recalculated as average value of hourly values:
Ψhq�
Hbase + nk�0H
(n +1) . (7)
The heart pulse parameter is obtained using a smart watch. The smart watch measures and sends heart pulse counts on an hourly basis.
3.3. Classification. In this study, we mainly concentrate on
the supervised learning approach because the nature of problem is more suitable. Na¨ıve Bayes (NB), Support Vector Machine (SVM), Decision Tree (DT), Random Forest (RF), and Artificial Neural Network (ANN) are applied to analyze the neurophysical conditions of the users.
3.3.1. Na¨ıve Bayes Algorithm (NB). A Na¨ıve Bayes classifier
is a very popular probabilistic machine learning model used for many classification tasks. It is based on the Bayes the-orem that calculates the conditional probabilities with equation (8).
P A B
�P(B\A)P(A)
P(B) . (8)
Using Bayes theorem, we find the probability of A happening given that B has occurred. Here, B is the evidence and A is the hypothesis. The Na¨ıve Bayes algorithm assumes that the predictors/features are independent from each other. That is, there is no relationship among features. Hence, it is called naive. Bernoulli Na¨ıve Bayes, Gaussian Na¨ıve Bayes, multinomial Na¨ıve Bayes, and complement Na¨ıve Bayes are the different types of Na¨ıve Bayes ap-proaches. The Bayes theorem has a large application field in computer science including text classification or spam analysis [48]. In this study, we use multinomial Na¨ıve Bayes algorithm.
3.3.2. Support Vector Regression Algorithm (SVR).
Support Vector Regression (SVR) is a regression algorithm that has been invented from Support Vector Machine. The theory of this approach is developed and presented by Vladimir Vapnik [49]. The main point of SVR is very similar to linear regression, but SVR adds the margin concept. With this concept, any point in space must be reachable with the mainline and its sum with a support vector. This sum op-eration is the margin concept. The way of finding support vector depends on the dimension of used space. In linear spaces, used formula is
y �
N i�1
α˙I− a∗i ·〈xi, x〉 + b. (9)
In our case, space is in 8th dimensions because there are 8 parameters exists. Equation (9) defines formula of Support
Errors
Time
ω3
ω2
ω1
Figure 6: Error windows in time.
Table 3: Recommended sleep durations by age.
Type Age Sleep (hour) Average (hour)
Newborns 0–3 months 14–17 15.5
Infants 4–11 months 12–15 13.5
Toddlers 1-2 years 11–14 12.5
Preschoolers 3–5 years 10–13 11.5
School age children 6–13 years 9–11 10
Teenagers 14–17 years 8–10 9
Younger adults 18–25 years 7–9 8
Adults 26–64 years 7–9 8
Older adults 65+ years 7-8 7.5
Table 2: Corresponding Ψeccalculation for three states.
ω order ω size Ec Ψec
1 8 4 4
2 7 2 3
Vector Machine. In this study, radial basis function (RBF) kernel is used during computation.
3.3.3. Decision Tree Algorithm (DT). The Decision Tree
algorithm builds a classification model that uses a tree-like graph for decisions and their possible after-effect, in-cluding chance event results, resource costs, and utility. The Decision Tree or a classification tree uses a tree representation to learn a classification function which predicts the value of a dependent attribute (variable), given the values of the independent (input) attributes (vari-ables). It is a supervised classification algorithm that di-vides a labeled dataset into smaller datasets while building the Decision Tree. It is proposed by Quinlan [50]. Decision Tree algorithm breaks down the dataset into smaller datasets until the last dataset has only similar objects. During this process, separated subsets get attached to questions which have certain responses. These questions make it possible to find the right subset which the new data belong to.
3.3.4. Random Forest Algorithm (RF). Random Forests or
Random Decision Forests are supervised learning algo-rithms that be used for classification and regression. The “forest” consists of multiples of decision trees. The algo-rithm constructs an ensemble of decision trees at training time and merges their decisions by outputting the target class (classification), which is highly voted by the ensemble of decision trees or mean prediction (regression) of the individual trees. The Random Forest algorithm provides high accuracy and do not overfit to their training set if there are enough trees in the forest [51]. It is proposed by Korting [52]. Random Forest is constructed by creating a series of decision trees from bootstrapped training samples. The decision tree split is done on a random set of features/ predictors rather than using the full set of predictors. In this work, Random Forest algorithm is employed with ten estimators.
3.3.5. Decision Integration Strategy (DIS). Decision
in-tegration is also a machine learning paradigm where the same or different multiple types of classifiers are trained to solve a problem. In contrast to conventional machine learning approaches which try to learn one hypothesis from training data, decision integration strategies try to con-struct a set of hypotheses and combine them to use. Each machine learning algorithm creates their hypotheses and decision integration model generates only one final de-cision. Majority voting is a known approach and gives better results rather than using a single classifier. Com-bination of majority voting and Artificial Neural Network models are robust and efficient for classification [53]. In this work, the decision of each classifier is voted according to majority.
3.3.6. Feedforward Neural Network (FFNN). In [54],
McCulloch and Pitts offer a computational model for neural
networks based on mathematics and algorithms called threshold logic inspired by biology of neurons. It consists of many neurons that are organized as layers. Feedforward Neural Networks are also known as multilayered networks (MLNs). In these networks, information flows forward from one layer to another, through the input nodes then through the hidden layers (single or many layers) and finally through the nodes of output layer. In MLN, there is no feedback mechanism that provides the flow of output information back to its inputs or some previous layers. These networks are represented by a combination of many simpler models called sigmoid neurons. Multilayered networks are com-posed of many nodes where sigmoidal functions are pre-ferred as activation functions. MLNs are capable of learning complex and nonlinearly separable decision boundaries from data. MLNs consist of one input layer, one output layer, and several hidden layers between input and output layers. The more hidden layers allow MLNs to learn the more complex nonlinearly separable relations between the input and the output.
3.3.7. Convolutional Neural Network (CNN). CNNs are
a special type of deep learning networks [55] that provide a better performance than many other machine learning algorithms. CNN is also a feedforward Neural Network with more hidden layers. The better learning capability of CNN comes from hidden layers that extract features and can learn representations from the data. Hidden layers contain convolutional layers mixed with pooling layers. The most significant block of CNN is the convolutional layer. Input data pass through a series of convolution layers with filters (Kernels). The convolution of data with filters generates a feature map that associates information with data on the filter. Multiple filters are applied to input data to get a stack of feature maps that becomes the final output of the convolutional layer. The values of filters are learned during the training process. Convolution operation cap-tures information about local dependencies or semantics in the regions of original data. An additional activation function like a rectified linear unit is applied to feature maps to add nonlinearity to CNN. After the convolution process, a pooling layer reduces the number of samples in each feature map and holds the most important in-formation. The pooling layer decreases the training time and reduces the dimensionality of data and overfitting by using a pooling function. The most common type of pooling function is called max pooling that finds the largest value in a specified neighborhood window. CNN archi-tectures contain a sequence of convolutional layers in-terleaved with pooling layers, followed by a number of fully connected layers.
3.3.8. Recurrent Neural Network (RNN). RNNs are
pow-erful tools for modelling sequential data. An RNN hidden state is a function of all previous hidden states of recurrent nets [22, 56]. RNN output does not only depend on current input but also depends on whatever the past information is retained in hidden states. RNNs differ from feedforward
networks like CNN by the feedback loops that enables the past decision information to be kept in the network. RNNs suffer from the gradient exploding problems. When there are long-term dependencies in sequence data, RNNs have difficulty to learn the past data. These problems occur during gradient descent process during training when the gradients are being propagated back in many layers. Be-cause of continuous matrix multiplications coming from deeper layers, small values shrink exponentially and vanish. This is called vanishing gradient problem that makes the model impossible to learn from data further back in a sequence. On the other hand, when there are large weight values coming from deeper layers, they be-come larger because of continuous matrix multiplication and go to NaN values during training and crash the model to learn. This is called the exploding gradient problem. To deal with exploding problems, several methods like gra-dient clipping or appropriate activation functions can be used.
3.3.9. Long Short-Term Memory Network (LSTM).
Another popular and widely used solution is to utilize Long Short-Term Memory networks (LSTMs) which are variants of RNNs in order to solve the gradient vanishing/exploding problems of RNNs [57, 58]. LSTM maintains the error to backpropagate through deeper layers and to proceed to learn over many time steps. Basically, LSTMs are developed to acquire long-distance dependencies within sequence data. LSTMs hold the contextual semantics of information and store long dependencies between data. LSTM employs special memory cells or units to store information for dependencies in long range context. Each LSTM unit in-cludes input, forgets, and outputs gates to control which portions of information to remember, forget, and pass to the next step. The LSTM unit makes decisions about what to store, and when to permit reading, writing, and deleting via gates that pass or block information through a LSTM unit.
4. Experiment Results
In this study, the comprehensive experiments are carried out to analyze the neurophysical conditions of users using conventional machine learning algorithms and deep learning models. In order to demonstrate the contribu-tion of our work, accuracy, precision, recall, and F-measure are employed as evaluation metrics in the ex-periments. We employ 67% of the dataset for the training process, and the remaining part is the test data. The widely used 10-fold cross validation with 5 × 2 approach is applied on the dataset. In this approach, the dataset is divided randomly into two halves. One part is employed in training and remaining in testing and vice versa. This procedure is applied five times, repeatedly. Thence, 10 predictions of testing accuracy and other measures are achieved for each dataset and each model. The accuracy results located in tables are the averages of these 10 es-timates for all models.
In deep learning part, Adam optimization [25] with a learning rate of 0.0001 is used. Hyperbolic tangent as the nonlinear activation function is employed in the experiments. To alleviate the problem of overfitting, dropout [26] is applied and set to 0.5. The number of layers is adjusted to 7, and the number of epochs is set to 100. For deep learning algorithms, CNN, RNN, and LSTM models have 7 layers. In CNN, the first one is an input layer. The second layer is the convolution layer with 64 filters whose kernel size is 3. The third layer is max-pooling layer whose max-pool size 2. The fourth and fifth layers are the same as second convolution layer and third layer, respectively, with the same characteristics. The sixth layer is the full-connected layer with 16 neurons. The last layer is the output softmax layer with 5 neurons. In the RNN model, the first layer is an input layer. It is followed by the implementation of RNN with 2 Simple RNN layers each with 32 RNN cells followed by 2 time distribute dense layers for 5 class classification. Dropout [26] rate on the fully connected layers is set to 0.5. Tangent activation function is used at the last layer. In the LSTM model, the first layer is an input layer. It is fol-lowed by the implementation of LSTM with 2 layers of 32 LSTM cells followed by 2-time distribute dense layers for 5-class classification. The dropout rate on the fully connected layers is set to 0.5. Tangent activation function is used at the last layer. For all deep learning models, Moolayil [27] library is used in the experiments. For conventional classification algorithms, RBF (radial basis function) kernel function is used in SVR. In DT, “cri-terion” parameter is set to mean-squared error. RF, “n_estimators” parameter, is set to 4. This will create 4 DTs within RF algorithm. In MNB, parameters are set as alpha � 1.0, class_prior � none, fit_prior � true. Other parameters for each conventional classification algo-rithm are set to default values as they are predefined in sklearn library.
Abbreviations mentioned in the tables and explanations used for the traditional machine learning algorithms and deep learning models are as follows: MNB: Multinomial Naive Bayes, RF: Random Forest, SVR: Support Vector Regression, DT: Decision Tree, DIS: Decision Integration Strategy, FFNN: Feed Forward Neural Network, CNN: Convolutional Neural Network, RNN: Recurrent Neural Network, LSTM: Long Short-Term Memory neural network. The best accuracy results acquired for each user is indicated with boldface.
As a first step, the classification performances of both conventional machine learning algorithms and deep learning methods are analyzed in terms of each user as given in Tables 4 and 5, respectively. Experiments are carried out with two different approaches. In the first approach, each user data are isolated and evaluated in the algorithms. There are 365 rows of data and a row of data for each user created each day. Physical and neurophysical parameters are recorded in each row for the user. As a summary, the training and test sets for each user is obtained with its own data and processed from each other independently in the first approach.
In Table 4, the accuracy percentages of conventional machine learning algorithms and Decision Integration Strategy in terms of each user are presented. It is clearly observed that the mean classification accuracy of DT is the best performing machine learning algorithm with 77.87% accuracy result among others. Moreover, DT exhibits su-perior classification performance compared to the DIS which is competitive with the 72.18% accuracy success, by boosting the success of the proposed system. It is followed by RF with 60.02%, SVR with 41.71%, and MNB with 28.25%. MNB exhibits the poor classification performance among others with 28.25% of accuracy value. Fundamentally, Na¨ıve Bayes algorithm assumes that all features are conditionally independent. When parameters are somehow dependent each other, Bayes algorithm may give poor results such as the classification performance of MNB. In this work, parameters collected, especially physical ones, are dependent on each other. We consider that the reason behind of poor perfor-mance of MNB is the dependency of features. MNB
performs better when features are independent. DT is the best performer because features in this study are dependent each other. As listed in Table 4, the success order of the classifiers is summarized as follows: DT > DIS > RF > SVR > MNB.
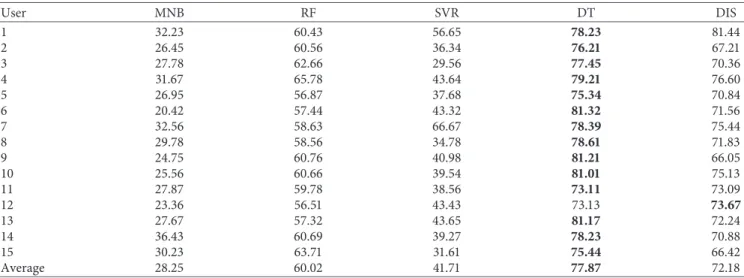
In Table 5, the accuracy percentages of deep learning models in terms of each user are given. We intend to demonstrate the classification capability of deep neural networks and compare their performances with the tra-ditional FFNN by implementing FFNN, CNN, RNN, and LSTM. Among the deep learning methods, CNN re-markably exhibits classification success with 79.06% of mean accuracy. Moreover, CNN outperforms other deep learning models while FFNN exhibits the poorest classi-fication performance with 69.03% among other learning methods. Furthermore, LSTM maintains approximately 7% improvement considering the success of FFNN while RNN provides nearly 5% enhancement compared to the classi-fication performance of FFNN. As it is seen in Table 5, the Table 4: Accuracy percentages of conventional machine learning algorithms and Decision Integration Strategy in terms of each user.
User MNB RF SVR DT DIS 1 32.23 60.43 56.65 78.23 81.44 2 26.45 60.56 36.34 76.21 67.21 3 27.78 62.66 29.56 77.45 70.36 4 31.67 65.78 43.64 79.21 76.60 5 26.95 56.87 37.68 75.34 70.84 6 20.42 57.44 43.32 81.32 71.56 7 32.56 58.63 66.67 78.39 75.44 8 29.78 58.56 34.78 78.61 71.83 9 24.75 60.76 40.98 81.21 66.05 10 25.56 60.66 39.54 81.01 75.13 11 27.87 59.78 38.56 73.11 73.09 12 23.36 56.51 43.43 73.13 73.67 13 27.67 57.32 43.65 81.17 72.24 14 36.43 60.69 39.27 78.23 70.88 15 30.23 63.71 31.61 75.44 66.42 Average 28.25 60.02 41.71 77.87 72.18
Table 5: Accuracy percentages of deep learning algorithms in terms of each user.
User FFNN CNN RNN LSTM 1 72.34 83.56 78.49 82.35 2 65.42 74.45 67.30 75.58 3 66.90 74.52 68.24 76.21 4 69.38 81.24 77.05 77.34 5 65.17 79.90 75.42 74.80 6 65.88 78.17 76.10 75.39 7 73.81 76.35 73.86 73.96 8 70.56 75.28 74.55 72.47 9 66.34 76.34 75.29 73.56 10 71.13 82.50 76.92 75.30 11 72.38 83.09 76.66 77.12 12 70.15 81.24 77.81 79.36 13 69.30 80.40 75.20 77.08 14 69.44 80.51 74.70 75.22 15 67.27 78.36 75.30 76.13 Average 69.03 79.06 74.86 76.12
performance order of NN learning models is abstracted as follows: CNN > LSTM > RNN > FFNN. From a wider per-spective, the classification performances of both deep learning models and conventional machine learning techniques are as follows: CNN > DT > LSTM > RNN > DIS > FFNN > RF > SVR > MNB. Similarly, the best and worst classification performances are carried through CNN with 79.06% of accuracy and MNB with 28.25% of accuracy, respectively. Surprisingly, DT is quite competitive with 77.87% of mean accuracy when the classification successes of deep learning models are considered. It is followed by LSTM with 76.12%, RNN with 74.86%, DIS with 72.18%, FFNN with 69.03%, RF with 60.02%, SVR with 41.71%, and MNB with 28.25% of mean accuracy value.
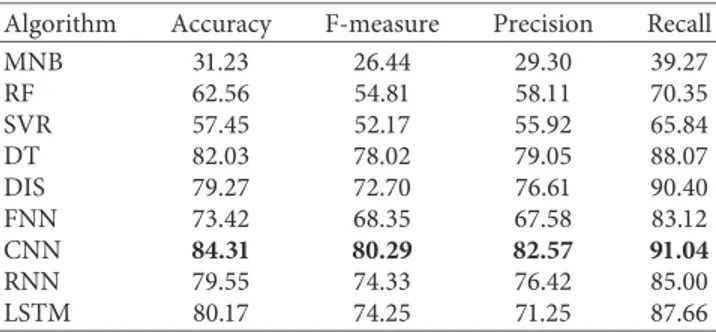
In the second approach, it is assumed that all users may have similar characteristics with similar physical/neuro-physical and emotional conditions without any difference among users. Therefore, all users’ data are combined to test this assumption by constructing a large single dataset. After that, dataset is divided into two parts as follows: 33% of the dataset is the training data and the remaining part is the test data. In Table 6, accuracy, F-measure, precision, and recall results of all user data with both traditional machine learning algorithms and deep learning models are pre-sented. The classification success of both deep learning models and conventional machine learning techniques when all user data are used instead of single-user-based
data are as follows: CNN > DT > LSTM > RNN >
DIS > FFNN > RF > SVR > MNB. CNN outperforms others with 84.31% accuracy when the algorithms are evaluated among themselves. In addition to CNN, DT and RNN exhibit approximately 5% improvement compared to the first approach. There is a performance increase of 16% with SVR algorithm in terms of classification success while a minimum improvement of the classification performance is observed as nearly 2% with RF in the second approach. Even MNB whose classification success is the worst exhibits nearly 3% improvement. It is followed by FFNN and LSTM with nearly 4% enhancement and by DIS with nearly 6% improvement in proportion to the first approach. As listed in Table 6, it is clearly observed that DT is quite competitive with 82.03% accuracy when compared with the classifi-cation success of deep learning algorithms. It can also be concluded that the best three classification successes are obtained by deep learning models except DT and DIS. Surprisingly, DIS and RF exhibit poor classification per-formances when they are compared with the deep learning algorithms. As it is observed in Table 6, the usage of conventional machine learning algorithms MNB and SVR has a disadvantage because of their low classification ac-curacies. Moreover, CNN exhibits the best classification success for all evaluation metrics as seen in Table 6. It is important to emphasize that 82.57% of precision among all machine learning algorithms and deep learning models supports the accuracy result of the CNN model. The CNN model represents the remarkable precision value when especially compared to the other deep learning models. This means that it is more convenient to choose the CNN
model for constructing the classification model for mood detection. Even when compared to the second best pre-cision performance (DT), the CNN algorithm exhibits between 3% and 4% more enhancement in system per-formance. This performance represents also similar results in terms of other evaluation metrics. Compared to the second best successful model DT, 2% advancement is provided by CNN for both accuracy and f-measure metrics while the same model shows 1% more improvement in recall results compared to second best successful model DIS. As a result of Table 6, the use of the CNN model, regardless of which evaluation metric is used, significantly improves the system performance for the purpose of mood detection.
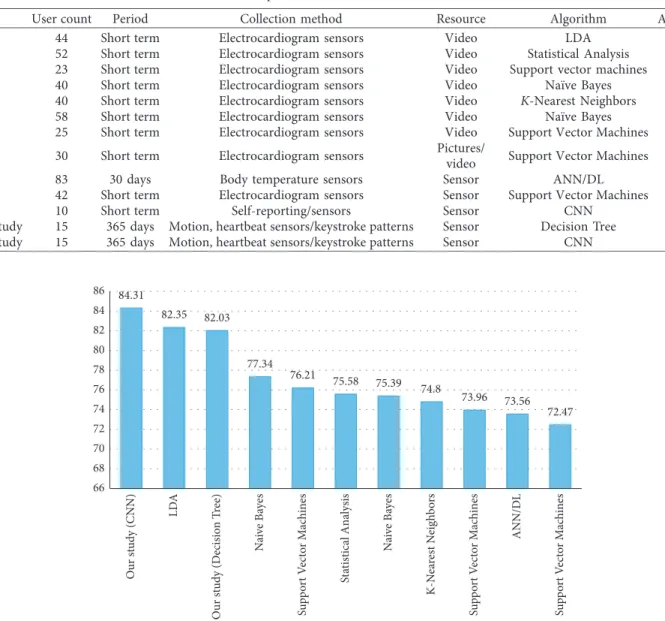
Table 7 shows comparison of related studies. We eval-uated some of the studies which use conventional machine learning algorithms and deep learning algorithms. Each row represents a study. Resource field in Table 7 indicates the type of the parameters used in the study. Corresponding algorithm and accuracy value are also given for each study. Several algorithms are used in related studies. Table 7 also gives a general perspective about performance of the algo-rithms. Linear Discriminant Analysis (LDA), Statistical Analysis, Support Vector Machine (SVM) algorithms, Na¨ıve Bayes (NB), K-Nearest Neighbors (K-NN), and Artificial Neural Network (ANN)/Deep Learning- (DL-) based al-gorithms are selected for comparison.
Novelty of our study is to use neurophysical param-eters with physical paramparam-eters. Used neurophysical pa-rameters are derived from keystroke patterns. Most of the studies in the literature use physical parameters rather than neurophysical parameters. Neurophysical parame-ters are volatile and have measurement difficulties. We believe that we found a way to eliminate this difficulty using keystroke patterns and emotion embedded ques-tions. Comparison of traditional machine learning algo-rithms and deep learning algoalgo-rithms is another novelty of our study. Tables 4 and 5 show the accuracy of each al-gorithm with the same dataset. Table 7 gives a comparison table among studies.
Last 2 rows in Table 7 shows the performance of algo-rithms of our study in conventional machine learning and deep learning algorithms. A graphical presentation of the accuracy values is also given in Figure 7.
Table 6: Accuracy, F-measure, precision, and recall results of all user data based both traditional machine learning algorithms and deep learning models.
Algorithm Accuracy F-measure Precision Recall
MNB 31.23 26.44 29.30 39.27 RF 62.56 54.81 58.11 70.35 SVR 57.45 52.17 55.92 65.84 DT 82.03 78.02 79.05 88.07 DIS 79.27 72.70 76.61 90.40 FNN 73.42 68.35 67.58 83.12 CNN 84.31 80.29 82.57 91.04 RNN 79.55 74.33 76.42 85.00 LSTM 80.17 74.25 71.25 87.66
5. Conclusion
In this study, we developed a model for emotional analysis of users by collecting many parameters from sensors. These parameters are grouped as physical and neurophysical. Both of physical and neurophysical information are obtained from the sensors of mobile devices and keyboard patterns of users. The data collection period was long, and the users were trained before the data collection stage. Keystroke pattern-based measurements are inputted as neurophysical parameters while sleep quality, energy, mobility/movement, and heart pulse are entered as physical parameters to the system. The conventional machine learning algorithms and deep learning methodologies are used in order to classify emotion/mood of the users. Deep Learning techniques has the capability to solve a given problem end to end without many preprocessing steps, whereas traditional machine learning techniques need some preprocessing steps to break down the problem into different subparts first and then
further process the results of subparts at a later stage. An-other advantage of deep learning is the better capability of it to learn from data than traditional machine learning algo-rithms that needs a domain expert and preparation before applying them. As it is stated in the previous section, we observed better results with CCN deep learning algorithm. To the best of our knowledge, this is the first attempt to analyze the emotions of users by using the neurophysical information of users enriched with their physical in-formation. To predict the emotions of the users, Feedfor-ward Neural Network (FFNN), Convolutional Neural Network (CNN), Recurrent Neural Network (RNN), and Long Short-Term Memory neural network (LSTM) are employed as deep learning methodologies while Multino-mial Na¨ıve Bayes (MNB), Support Vector Regression (SVR), Decision Tree (DT), Random Forest (RF), and Decision Integration Strategy (DIS) are applied as conventional machine learning algorithms. In order to analyze the pro-posed model, a dataset is gathered with the usage of smart Table 7: Comparison with the state-of-the-art results.
Study User count Period Collection method Resource Algorithm Accuracy
[28] 44 Short term Electrocardiogram sensors Video LDA 82.35
[23] 52 Short term Electrocardiogram sensors Video Statistical Analysis 75.58
[29] 23 Short term Electrocardiogram sensors Video Support vector machines 76.21
[59] 40 Short term Electrocardiogram sensors Video Na¨ıve Bayes 77.34
[60] 40 Short term Electrocardiogram sensors Video K-Nearest Neighbors 74.80
[61] 58 Short term Electrocardiogram sensors Video Na¨ıve Bayes 75.39
[62] 25 Short term Electrocardiogram sensors Video Support Vector Machines 73.96
[63] 30 Short term Electrocardiogram sensors Pictures/
video Support Vector Machines 72.47
[24] 83 30 days Body temperature sensors Sensor ANN/DL 73.56
[64] 42 Short term Electrocardiogram sensors Sensor Support Vector Machines 80.75
[65] 10 Short term Self-reporting/sensors Sensor CNN 81.00
Our study 15 365 days Motion, heartbeat sensors/keystroke patterns Sensor Decision Tree 82.03
Our study 15 365 days Motion, heartbeat sensors/keystroke patterns Sensor CNN 84.31
84.31 82.35 82.03 77.34 76.21 75.58 75.39 74.8 73.96 73.56 72.47 66 68 70 72 74 76 78 80 82 84 86 Our st ud y (CNN) LD A Our st ud y (Decisio n T ree) Na iv e B ay es Supp or t V ec tor Ma ch in es St at istical Anal ysis Na iv e B ay es K-N ea re st N eig hb or s Supp or t V ec tor Ma ch in es ANN/D L Supp or t V ec tor Ma ch in es
devices and keyboard timing information obtained from users. Experiment results demonstrate that the usage of deep learning methodologies and the combination of both physical and neurophysical parameters enhance the classi-fication success of the system to predict the sensitivity/mood or emotional state of users. Especially, CNN exhibits out-standing classification success among others. We conclude the study that the physical and neurophysical parameters are strongly linked to users’ emotional conditions. When emotions change, users’ body gives a reaction to the new situation and this change can be observed by measuring physical/neuro physical parameters. Experimental results also confirm this connection between physical and neuro-physical parameters.
Despite the significant contributions, the proposed framework has some limitations. The hard part of this study was finding subjects because nobody wanted to be a subject for a one-year study by taking a responsibility. 15 persons from academic and business circles were found as volun-teers, hardly. Secondly, training of subjects was a difficult process. It took a month for the subjects to gain the habit of using the given application. CPU is used in the experiments because of the small size of the dataset. The use of GPU can be considered as an option when the number of users in-creases. As a future work, we also plan to enrich this study by employing sentiment analysis of the users which will be obtained from texts in social media platforms. Besides, we also intend to perform a Decision Integration Strategy for deep learning methodologies in order to compare them with Decision Integration Strategy of conventional machine learning algorithms.
Data Availability
Data in this study are collected from users as a part of this study. Thus, they can be shared if requested.
Conflicts of Interest
The authors declare that there are no conflicts of interest regarding the publication of this article.
References
[1] H. Yasuura, K. Chong-Min, Y. Liu, and Y.-L. Lin, Smart
Sensors at the IoT Frontier, Springer International Publishing
AG, Berlin, Germany, 2017.
[2] C. Joseph, F. P. Deane, and S. Anderson, “Emotional in-telligence moderates the relationship between stress and mental health,” Personality and Individual, vol. 32, no. 2, 2002. [3] R. Joyce and G. Gupta, “Identity authentication based on keystroke latencies,” Communications of the ACM, vol. 33, no. 2, pp. 168–176, 1990.
[4] S. Bleha, Recognition Systems Based on Keystroke Dynamics, Ph.D. dissertation University of Missouri, Columbia, Mis-souri, 1988.
[5] S. Bleha, C. Slivinsky, and B. Hussien, “Computer-access security systems using keystroke dynamics,” IEEE
Trans-actions on Pattern Analysis and Machine Intelligence, vol. 12,
p. 12, 1990.
[6] F. Bergadano, D. Gunetti, and C. Picardi, “User authentica-tion through keystroke dynamics,” ACM Transacauthentica-tions on
Information and System Security, vol. 5, no. 4, pp. 367–397,
2002.
[7] D. Song, P. Venable, and P. Adrian, “User r1ecognition by keystroke latency pattern analysis,” 1997, http://www.ece. cmu.edu/∼adrian/projects/keystroke/.
[8] F. Monrose and A. Rubin, “Authentication via keystroke dynamics,” in Proceedings of 4th ACM Conference on
Com-puter and Communications Security, Zurich, Switzerland,
1997.
[9] F. Monrose and A. D. Rubin, “Keystroke dynamics as a bio-metric for authentication,” Future Generation Computer
Systems, vol. 16, no. 4, pp. 351–359, 2000.
[10] F. J. Guti´errez, L. R. Salgado-Garza, F. J. Cant´u, and J. Francisco, “Biometrics and data mining: comparison of data mining-based keystroke dynamics methods for identity ver-ification,” MICAI 2002: Advances in Artificial Intelligence, vol. 2313, pp. 460–469, 2002.
[11] M. S. Obaidat and B. Sadoun, “A simulation evaluation study of neural network techniques to computer user identifica-tion,” Information Sciences, vol. 102, pp. 239–258, 1997. [12] A. S. Anagun and I. Cin, “A neural network based computer
access security system for multiple users,” Computers &
In-dustrial Engineering, vol. 35, no. 1-2, pp. 351–354, 1998.
[13] O. Guven, S. Akyokus, M. Uysal, and A. Guven, “Enhanced password authentication through keystroke typing charac-teristics,” IASTED International Conference on Artificial Intelligence and Applications, Innsbruck, Austria, February 2007.
[14] F. Monrose, M. K. Reiter, and S. Wetzel, “Password hardening based on keystroke dynamics,” International Journal of
In-formation Security, vol. 1, no. 2, pp. 69–83, 2002.
[15] A. G¨uven and ˙I. So˘gukpınar, Understanding Users’ Keystroke
Patterns for Computer Access Security, Elsevier Computers &
Security, Amsterdam, Netherlands, 2003.
[16] P. Khanna and M. Sasikumar, “Recognising emotions from keyboard Stroke pattern,” International Journal of Computer
Applications (0975–8887), vol. 11, no. 9, 2010.
[17] R. Gaines, W. Lisowski, S. Press, and N. Shapiro,
Authenti-cation by Keystroke Timing: Some Preliminary Results, Rand
Rep. R-2560-NSF, Rand Corporation, Santa Monica, CA, USA, 1980.
[18] M. Hatt, C. Parmar, J. Qi, and I. El Naqa, “Machine (deep) learning methods for image processing and radiomics,” IEEE
Transactions on Radiation and Plasma Medical Sciences, vol. 3,
no. 2, 2019.
[19] F. Sebastiani, “Machine learning in automated text catego-rization,” ACM Computing Surveys, vol. 34, no. 1, pp. 1–47, 2002.
[20] C. Vondrick, H. Pirsiavash, and A. Torralba, “Anticipating visual representations from unlabeled video,” in Proceedings
of the IEEE Conference on Computer Vision and Pattern Recognition (CVPR), Las Vegas, NV, USA, June 2016.
[21] K. Giannakaki, G. Giannakakis, C. Farmaki, and V. Sakkalis, “Emotional state recognition using advanced machine learning techniques on eeg data,” in Proceedings of the 2017
IEEE 30th International Symposium on Computer-Based Medical Systems (CBMS), Thessaloniki, Greece, June 2017.
[22] Z. C. Lipton, J. Berkowitz, and C. Elkan, “A critical review of recurrent neural networks for sequence learning,” 2015, https://arxiv.org/abs/1506.00019.
[23] S. Wiens, E. S. Mezzacappa, and E. S. Katkin, “Heartbeat detection and the experience of emotions,” Cognition &
Emotion, vol. 14, no. 3, pp. 417–427, 2000.
[24] N. Jaques, S. Taylor, E. Nosakhare, A. Sano, and R. Picard, “Multi-task learning for predicting health, stress, and hap-piness,” in Proceedings of the Conference on Neural
In-formation Processing Systems, NIPS Workshop, Barcelona,
Spain, 2016.
[25] D. P. Kingma and J. Lei Ba, “Adam: a method for stochastic optimisation,” in Proceedings of the International Conference
on Learning Representations (ICLR), San Diego, CA, USA,
May 2015.
[26] J. Lambert, O. Sener, and S. Savarese, “Deep learning under privileged information using heteroscedastic dropout,” in
Proceedings of the IEEE Conference on Computer Vision and Pattern Recognition (CVPR), Salt Lake City, UT, USA, June
2018.
[27] J. Moolayil, Learn Keras for Deep Neural Networks, Book from APress, New York, NY, USA, 2019.
[28] F. Agrafioti, D. Hatzinakos, and A. K. Anderson, “ECG pattern analysis for emotion detection,” IEEE Transactions on
Affective Computing, vol. 3, no. 1, pp. 102–115, 2012.
[29] S. Katsigiannis and N. Ramzan, “DREAMER: a database for emotion recognition through EEG and ecg signals from wireless low-cost off-the-shelf devices,” IEEE Journal of
Biomedical and Health Informatics, vol. 22, no. 1, pp. 98–107,
2018.
[30] N. Ramirez, L. A. Padilla, D. G. Contreras, and R. Montelongo, “Physiological responses in heart rate with classical Music,” in Proceedings of the 15th International
Conference on Electrical Engineering, Computing Science and Automatic Control (CCE), Mexico City, Mexico, September
2018.
[31] J. Anttonen and V. Surakko, “Emotions and heart rate while sitting on a chair,” in Proceedings of the SIGCHI Conference on
Human Factors in Computing Systems (CHI ’05), pp. 491–499,
Munich, Germany, April 2005.
[32] R. Harper and J. Southern, “A bayesian deep learning framework for end-to-end prediction of emotion from heartbeat,” 2019, https://arxiv.org/abs/1902.03043.
[33] M. T. V. Yamuza, J. Bolea, M. Orini, P. Laguna, and C. Orrite, “Human emotion characterization by heart rate variability analysis guided by respiration,” IEEE Journal of Biomedical
and Health Informatics, vol. 23, 2019.
[34] J. Zhu, L. Ji, and C. Liu, “Heart rate variability monitoring for emotion and disorders of emotion,” Physiological
Measure-ment, vol. 40, no. 6, 2019.
[35] J. M. Meers, J. L. Bower, and C. A. Alfano, “Poor sleep and emotion dysregulation mediate the association between de-pressive and premenstrual symptoms in young adult women,”
Archives of Women’s Mental Health, vol. 29, 2019.
[36] A. Rehman, A. Gumley, and S. Biello, “Sleep quality and paranoia: the role of alexithymia, negative emotions and perceptual anomalies,” Psychiatry Research, vol. 259, pp. 216–222, 2018.
[37] R. Garett, S. Liu, and S. D. Young, “The relationship between social media use and sleep quality among undergraduate students,” Information, Communication & Society, vol. 19, 2016.
[38] N. B. Becker, S. N. de Jesus, J. N. Viseu, C. D. Stob¨aus, M. Guerreiro, and R. B. Domingues, “Depression and quality of life in older adults:Mediation effect of sleep quality,”
In-ternational Journal of Clinical and Health Psychology, vol. 18,
no. 1, 2018.
[39] E. Yuda, T. Tanabiki, S. Iwata, K. Abe, and J. Hayano, “De-tection of daily emotions by wearable biometric sensors,” in
Proceedings of the IEEE 1st Global Conference on Life Sciences and Technologies, Osaka, Japan, 2019.
[40] J. Hackford, A. Mackey, and E. Broadbent, “The effects of walking posture on affective and physiological states during stress,” Journal of Behavior Therapy and Experimental
Psy-chiatry, vol. 62, pp. 80–87, 2019.
[41] G. Venture, H. Kadone, T. Zhang, J. Gr`ezes, A. Berthoz, and H. Hicheur, “Recognizing emotions conveyed by human gait,”
International Journal of Social Robotics, vol. 6, no. 4, 2014.
[42] C. Diamantini, A. Mircoli, and E. S. DomenicoPotena, “Social information discovery enhanced by sentiment analysis techniques,” Future Generation Computer Systems, vol. 95, 2019.
[43] M. M. Madbouly, R. Essameldin, and S. Darwish, “A modified fuzzy sentiment analysis approach based on user ranking suitable for online social networks,” in Proceedings of the
International Conference on Advanced Intelligent Systems and Informatics, vol. 1058, pp. 340–349, Cairo, Egypt, October
2019.
[44] B. G. Priya, “Emoji based sentiment analysis using KNN,”
International Journal of Scientific Research and Review, vol. 7,
no. 4, 2019.
[45] B. Liu, “Sentiment analysis and subjectivity,” Decision Support
Systems, vol. 53, 2010.
[46] Product Spesification, “Using apple watch for arrhythmia
detection,” 2018, https://www.apple.com/healthcare/site/
docs/Apple_Watch_Arrhythmia_Detection.pdf.
[47] K. L. Knutson, J. Phelan, and M. J. Paskow, “The national sleep foundation’s sleep health index,” Journal of the National Sleep
Foundation, vol. 3, no. 4, pp. 234–240, 2017.
[48] K. A. Vidhya and G. Aghila, “A survey of Na¨ıve Bayes ma-chine learning approach in text document classification,”
International Journal of Computer Science and Information Security, vol. 7, no. 2, 2010.
[49] V. Vapnik, Statistical Learning Theory, Wiley, New York, NY, USA, 1998.
[50] J. R. Quinlan, “Induction of decision trees,” Machine
Learning, vol. 1, no. 1, pp. 81–106, 1986.
[51] L. Breiman, “Random forests,” Machine Learning, vol. 45, no. 1, pp. 5–32, 2001.
[52] T. S. Korting, “C4.5 algorithm and multivariate decision trees,”
2013, https://www.researchgate.net/profile/Thales_Koerting/
publication/267945462_C45_algorithm_and_Multivariate_ Decision_Trees/links/5475b99b0cf29afed612b236/C45-algorithm-and-Multivariate-Decision-Trees.pdf.
[53] N. Liu and H. Wang, “Ensemble based extreme learning machine,” IEEE Signal Processing Letters, vol. 17, no. 8, 2010. [54] W. McCulloch and W. Pitts, “A logical calculus of ideas immanent in nervous activity,” Bulletin of Mathematical
Biophysics, vol. 5, no. 4, pp. 115–133, 1943.
[55] W. Liu, Z. Wang, X. Liua, N. Zeng, Y. Liuc, and F. E. Alsaadi, “A survey of deep neural network architectures and their applications,” Neurocomputing, vol. 234, p. 19, 2017. [56] J. L. Elman, “Finding structure in time,” Cognitive Science,
vol. 14, 1990.
[57] K. Greff, R. K. Srivastava, J. Koutnik, B. R. Steunebrink, and J. Schmidhuber, “LSTM: a search space odyssey,” IEEE
Transactions on Neural Networks and Learning Systems,
vol. 28, 2017.
[58] D. Kent and F. M. Salem, “Performance of three slim variants of the long short-term memory {(LSTM)} layer,” Clinical
[59] J. A. Miranda-Correa, M. K. Abadi, N. Sebe, and I. Patras, “AMIGOS: a dataset for affect, personality and mood research on individuals and groups,” 2017, https://arxiv.org/abs/1702. 02510.
[60] H. Ferdinando, T. Seppanen, and E. Alasaarela, “Comparing features from ECG pattern and HRV analysis for emotion recognition system,” in IEEE Annual International Conference
on Computational Intelligence in Bioinformatics and Com-putational Biology (CIBCB 2016), pp. 1–6, Chiang Mai,
Thailand, 2016.
[61] R. Subramanian, J. Wache, M. K. Abadi et al., “ASCERTAIN: emotion and personality recognition using commercial sen-sors,” IEEE Transactions on Affective Computing, vol. 9, no. 2, pp. 147–160, 2018.
[62] H. W. Guo, Y. S. Huang, C. H. Lin, J. C. Chien, K. Haraikawa, and J. S. Shieh, “Heart rate variability signal features for emotion recognition by using principal component analysis and support vectors machine,” in Proceedings of the 2016 IEEE
16th International Conference on Bioinformatics and Bio-engineering, BIBE, Taichung, Taiwan, October 2016.
[63] G. Valenza, L. Citi, A. Lanat´a, E. P. Scilingo, and R. Barbieri, “Revealing real-time emotional responses: a personalized assessment based on heartbeat dynamics,” Scientific Reports, vol. 4, pp. 1–13, 2014.
[64] A. Samara, L. Galway, R. Bond, and H. Wang, “Affective state detection via facial expression analysis within a human– computer interaction context,” Journal of Ambient Intelligence
and Humanized Computing, vol. 10, no. 6, 2019.
[65] E. Kanjo, E. M. G. Younis, and C. S. Ang, “Deep learning analysis of mobile physiological, environmental and location sensor data for emotion detection,” Information Fusion, vol. 49, pp. 46–56, 2019.