Design Strategies for Ratiometric Chemosensors: Modulation
of Excitation Energy Transfer at the Energy Donor Site
Ruslan Guliyev,†,‡Ali Coskun,†and Engin U. Akkaya*,‡
Department of Chemistry, Middle East Technical UniVersity, 06531, Ankara, Turkey, and Department of Chemistry and UNAM-Materials Science and Nanotechnology Institute,
Bilkent UniVersity, 06800 Ankara, Turkey Received April 1, 2009; E-mail: [email protected]
Abstract: Excitation energy transfer, when coupled to an ion-modulated ICT chromophore, creates novel
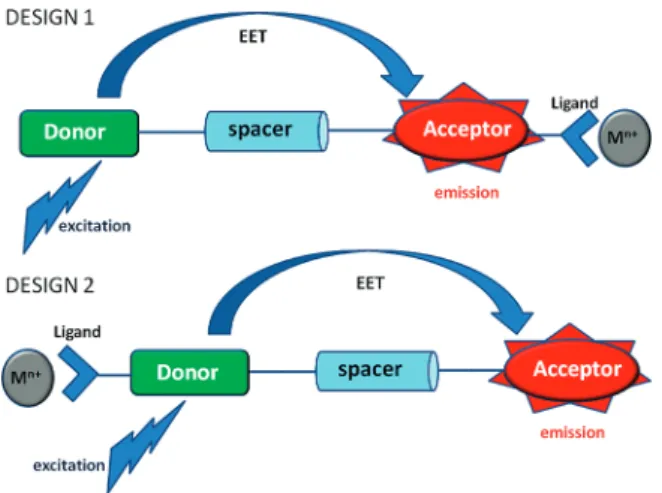
opportunities in sensing. The direction of energy transfer and the point of ICT modulation can be varied as desired. In our previous work, we have shown that energy transfer efficiency between two energetically coupled fluorophores will be altered by the metal ion binding to the ICT chromophore carrying a ligand. There are two beneficial results: increased pseudo-Stokes shift and expanded dynamic range. Here, we explored the consequences of the modulation of energy transfer efficiency at the energy donor site, in a molecular design which has an ICT type metal ion-sensitive chromophore placed as the energy donor in the dyad. Clear advantages emerge compared to the acceptor site modulation: unaltered emission wavelength in the red end of the visible spectrum, while keeping a large Stokes shift and the ratiometric character.
Introduction
Fluorescent chemosensor research of the last few decades have been both very instructive and productive.1 Especially, work targeting ion sensing in cellular media2has significantly improved our understanding of biochemical processes involved in healthy and pathological states. While a large number of chemosensors of practical utility have been developed based on previously established principles, a few research groups push frontiers of chemosensor design by proposing new sensing methodologies. Successful chemosensors make use of a large number of different photophysical phenomena such as PET,3 ICT,4 excimer formation,5 excited state reactions,6 excitation
energy transfer,7etc. In addition, supramolecular associations of fluorophores with other molecules were exploited toward molecular design of chemosensors.8 A particularly useful subclass of fluorescent chemosensors are ratiometric ones. Using these chemosensors, it is possible to compensate for local
†Middle East Technical University. ‡Bilkent University.
(1) (a) de Silva, A. P.; Fox, D. B.; Huxley, A. J. M.; Moody, T. S. Coord. Chem. ReV. 2000, 205, 41–57. (b) Wright, A. T.; Anslyn, E. V. Chem. Soc. ReV. 2006, 35, 14–28. (c) de Silva, A. P.; Gunaratne, H. Q. N.; Gunnlaugsson, T.; Huxley, A. J. M.; McCoy, C. P.; Rademacher, J. T.; Rice, T. E. Chem. ReV. 1997, 97, 1515–1566. (d) de Silva, A. P.; Uchiyama, S. Nat. Nanotechnol. 2007, 2, 399–410. (e) Czarnik, A. W. Acc. Chem. Res. 1994, 27, 302–308. (f) de Silva, A. P.; Gunaratne, H. Q. N.; Habibjiwan, J. L.; McCoy, C. P.; Rice, T. E.; Soumillion, J. P. Angew. Chem., Int. Ed. 1995, 34, 1728–1731. (g) Arnendola, V.; Esteban-Gomez, D.; Fabbrizzi, L.; Licchelli, M. Acc. Chem. Res. 2006, 39, 343–353. (h) Arnendola, V.; Bonizzoni, M.; Esteban-Gomez, D.; Fabbrizzi, L.; Licchelli, M.; Sancenon, F.; Taglietti, A. Coord. Chem. ReV. 2006, 250, 1451–1470. (i) Martinez-Manez, R.; Sancenon, F. Coord. Chem. ReV. 2006, 250, 3081–3093. (j) Martinez-Manez, R.; Sancenon, F. Chem. ReV. 2003, 103, 4419–4476.
(2) (a) Zhang, J.; Campbell, R. E.; Ting, A. Y.; Tsien, R. Y. Nat. ReV. Cell Mol. Biol. 2002, 3, 906–918. (b) Haugland, R. P. Intracelular cellular probes. In The Handbook-A guide to fluorescent probes and labeling technologies, 10th ed.; Invitrogen Corp.: Carlsbad, CA, 2005. (3) (a) Bissell, R. A.; Desilva, A. P.; Gunaratne, H. Q. N.; Lynch, P. L. M.; Maguire, G. E. M.; McCoy, C. P.; Sandanayake, K. R. A. S. Top. Curr. Chem. 1993, 168, 228–264. (b) Bissell, R. A.; Desilva, A. P.; Gunaratne, H. Q. N.; Lynch, P. L. M.; Maguire, G. E. M.; Sandan-ayake, K. R. A. S. Chem. Soc. ReV. 1992, 21, 187–195.
(4) (a) Valeur, B.; Leray, I. Inorg. Chem. Acta. 2007, 360, 765–774. (b) Valeur, B.; Leray, I. Coord. Chem. ReV. 2000, 205, 3–40. (c) Yuan, M.; Li, Y.; Li, J.; Liu, X.; Lv, J.; Xu, J.; Liu, H.; Wang, S.; Zhu, D. Org. Lett. 2007, 9, 2313–2316. (d) Yuan, M.; Zhou, W.; Liu, X.; Zhu, M.; Li, J.; Yin, X.; Zheng, H.; Zuo, Z.; Ouyang, C.; Liu, H.; Li, Y.; Zhu, D. J. Org. Chem. 2008, 73, 5008–5014.
(5) (a) Cho, H. K.; Lee, D. H.; Hong, J. I. Chem. Commun. 2005, 1690– 1692. (b) Lee, H. N.; Xu, Z.; Kim, S. K.; Swamy, K. M. K.; Kim, Y.; Kim, S.-J.; Yoon, J. J. Am. Chem. Soc. 2007, 129, 3828–3829. (c) Takashi, J.; Kazuhiko, I.; Tomiyasu, K. J. Chem. Soc., Chem. Commun. 1992, 49, 9–501. (d) Shiraishi, Y.; Maehara, H.; Ishizumi, K.; Hirai, T. Org. Lett. 2007, 9, 3125. (e) Fages, F.; Bodenant, B.; Weil, T. J. Org. Chem. 1996, 61, 3956–3961. (f) Parker, D.; Williams, J. A. G. J. Chem. Soc., Perkin Trans. 2 1995, 1305. (g) Aoki, I.; Kawabata, H; Nakashima, K.; Shinkai, S. J. Chem. Soc., Chem. Commun. 1991, 1771. (h) Nishizawa, S.; Kaneda, H.; Uchida, T.; Teramae, N. J. Chem. Soc., Perkin Trans. 1998, 2, 2325–2328.
(6) (a) Klymchenko, A. S.; Demchenko, A. P. J. Am. Chem. Soc. 2002, 124, 12372–12379. (b) Seo, J.; Kim, S.; Park, S. Y. J. Am. Chem. Soc. 2004, 126, 11154–11155.
(7) (a) Coskun, A.; Akkaya, E. U. J. Am. Chem. Soc. 2005, 127, 10464– 10465. (b) Coskun, A.; Akkaya, E. U. J. Am. Chem. Soc. 2006, 128, 14474–14475. (c) Lin, W. Y.; Yuan, L.; Cao, X. W. Tetrahedron Lett. 2008, 49, 6585–6588. (d) Lee, S. Y.; Kim, H. J.; Wu, J. S.; No, K.; Kim, J. S. Tetrahedron Lett. 2008, 49, 6141–6144. (e) Ben, O. A.; Lee, J. W.; Wu, J. S.; Kim, J. S.; Abidi, R.; Thuery, P.; Strub, J. M.; Van Dorsselaer, A.; Vicens, J. J. Org. Chem. 2007, 72, 7634–7640. (f) Lin, W. Y.; Yuan, L.; Long, L. L.; Guo, C. C.; Feng, J. B. AdV. Funct. Mat. 2008, 18, 2366–2372.
(8) (a) Nguyen, B. T.; Anslyn, E. V. Coord. Chem. ReV. 2006, 250, 3118– 3127. (b) Wiskur, S. L.; Lavigne, J. L.; Metzger, A.; Tobey, S. L.; Lynch, V.; Anslyn, E. V. Chem.sEur. J. 2004, 10, 3792–3804. (c) Kim, S. H.; Choi, J. K.; Kim, S. K.; Sim, W.; Kim, J. S. Tetrahedron Lett. 2006, 47, 3737–3741. (d) Best, M. D.; Tobey, S. L.; Anslyn, E. V. Coord. Chem. ReV. 2003, 240, 3–15. (e) Wiskur, S. L.; Ait-Haddou, H.; Lavigne, J. J.; Anslyn, E. V. Acc. Chem. Res. 2001, 34, 963–972. (f) Kim, S. K.; Lee, S. H.; Lee, J. Y.; Lee, J. Y.; Bartsch, R. A.; Kim, J. S. J. Am. Chem. Soc. 2004, 126, 16499–116506.
concentration differences of the probe compounds; such self-correction capacity in fluorescence measurements using these probes is considered to be an instrumental analogue of color vision.9
A few years ago, we reported7aa novel approach for rational design for large Stokes shift ratiometric chemosensors. Through this methodology, first a dimeric chromophore was synthesized, and with just one chemical conversion, it was transformed into an energy transfer cassette and a chemosensor. Thus, one of the fluorophores was excited at 500 nm, and through very efficient energy transfer (through-bond and through-space) the second chromophore was excited. This second chromophore was in fact a rather standard ICT type of a chemosensor, sensing ions with a blue shift in the emission spectrum. The advantage of this approach was a much larger pseudo-Stokes shift, and tunable excitation and emission wavelengths by the choice of energy donor and acceptor chromophores. This was all possibly due to recently appreciated highly versatile chemistry of boradiazaindacene (a.k.a, BODIPY, borondipyrrin) dyes. A number of research groups worldwide,10 in addition to our laboratory,7a,b,11 sparked this recent explosion of interest in Bodipy chemistry and applications.
Through-space energy transfer efficiency is a function of spectral overlap and the distance between the chromophores. In our previous design (Figure 1), we designed and synthesized a ratiometric chemosensor by simply modifiying a dimeric
the energy transfer efficiency and alter the emission signals as a second, binding event-linked parameter. The result was an improved dynamic range.
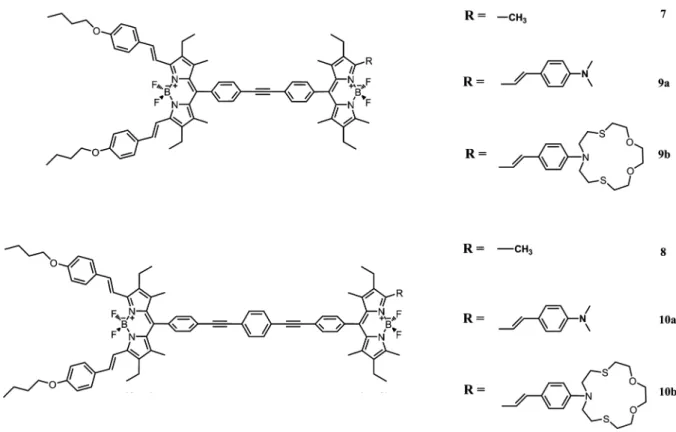
In this work, we aimed an exploration of an inverted energy transfer, i.e., the ligand is attached to the energy donor fluorophore, and the energy acceptor fluorophore is essentially a passive emitter. To fulfill these design parameters, we targeted compounds 9b-10b (Figure 2).
Synthesis. Synthesis pathways followed were shown in Scheme 1. Briefly, the synthetic work starts with the preparation of 2,6-diethyl-1,3,5,7-tetramethyl-8-(4-iodophenyl)-4,4-difluoro-4-bora-s-3a,4a-diazaindacene, compound 1. Double Knoevena-gel condensation with 4-butoxybenzaldehyde yields a derivative (2) of the energy acceptor; a longer wavelength absorbing and emitting chromophore. A butyl group proved to be helpful in alleviating solubility problems in rigid and flat aromatic intermediates and target compounds. Sonogashira coupling of
2 with Trimethylsilylacetylene followed by deprotection with
NaOH in MeOH yielded a very useful intermediate and long wavelength dye module 4. In order to synthetically access the target molecule with larger separation between the chro-mophores, an additional phenylethynyl group was placed by reacting compound 4 with 4-(TMS-ethynyl)-iodobenzene under Sonogashira conditions. Then, following deprotection, another coupling with Bodipy 1 yielded bichromophoric compound 8. Compound 4 coupled with 1 yielded a similar bichromophoric system 7 with a smaller distance of separation. Compounds 7 and 8 can be reacted with the desired aldehydes to yields sensor compounds 9a, 9b, 10a, and 10b under Knoevenagel condensa-tion condicondensa-tions. The synthesis of 9b and 10b requires the use of an aromatic aldehyde carrying an azadithiacrown ligand, which is known to be Hg(II) selective12in a number of solvent systems.
Results and Discussion
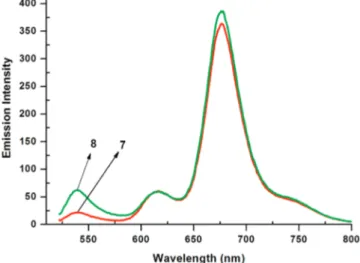
The absorbance spectra of compounds 7 and 8 are shown in Figure 3. At equal concentrations (1.22 µM) in THF, as expected two major peaks were observed, a shorter wavelength peak at 526 nm is due to standard Bodipy units with four methyl and two ethyl substituents on the boradiazaindacene core. The larger peak at longer wavelength (655 nm), on the other hand, originates from distyryl-Bodipy unit. Emission spectra (Figure 4) of the cassettes obtained by excitation at 520 nm show just one major emission peak which corresponds to the emission
(9) Tsien, R. Y.; Harootunian, A. T. Cell Calcium 1990, 11, 93–109.
(10) (a) Yogo, T.; Urano, Y.; Ishitsuka, Y.; Maniwa, F.; Nagano, T. J. Am. Chem. Soc. 2005, 127, 12162–12163. (b) Loudet, A.; Burgess, K. Chem. ReV. 2007, 107, 4891–4932. (c) Baruah, M.; Qin, W.; Vallee, R. A. L.; Beljonne, D.; Rohand, T.; Dehaen, W.; Boens, N. Org. Lett. 2005, 7, 4377–4380. (d) Qin, W.; Rohand, T.; Baruah, M.; Stefan, A.; Van der Auweraer, M.; Dehaen, W.; Boens, N. Chem. Phys. Lett. 2006, 420, 562–568. (e) Ulrich, G.; Ziessel, R.; Harriman, A. Angew. Chem., Int. Ed. 2008, 47, 1184–1201. (f) Ziessel, R.; Ulrich, G.; Harriman, A. New J. Chem. 2007, 31, 496–501. (g) Descalzo, A. B.; Xu, H. J.; Xue, Z. L.; Hoffmann, K.; Shen, Z.; Weller, M. G.; You, X. Z.; Rurack, K. Org. Lett. 2008, 10, 1581–1584. (h) Rurack, K.; Kollmannsberger, M.; Daub, J.; New, J. Chem. 2001, 25, 289–292.
(11) (a) Deniz, E.; Isbasar, G. C.; Bozdemir, O. A.; Yildirim, L. T.; Siemiarczuk, A.; Akkaya, E. U. Org. Lett. 2008, 10, 3401–3403. (b) Yilmaz, M. D.; Bozdemir, O. A.; Akkaya, E. U. Org. Lett. 2006, 8, 2871–2873. (c) Atilgan, S.; Ekmekci, Z.; Dogan, A. L.; Guc, D.; Akkaya, E. U. Chem. Commun. 2006, 4398–4400. (d) Ekmekci, Z.; Yilmaz, M. D.; Akkaya, E. U. Org. Lett. 2008, 10, 461–464. (e) Coskun, A.; Deniz, E.; Akkaya, E. U. Org. Lett. 2005, 7, 5187–5189. (f) Cakmak, Y.; Akkaya, E. U. Org. Lett. 2009, 11, 85–88. (g) Atilgan, S.; Ozdemir, T.; Akkaya, E. U. Org. Lett. 2008, 10, 4065–4067.
(12) Jimenez, D.; Martinez-Manez, R.; Sancenon, F.; Ros-Lis, J. V.; Soto, J.; Benito, A.; Garcia-Breijo, E. Eur. J. Inorg. Chem. 2005, 2393– 2403.
Figure 1. Two different designs for excitation energy transfer coupled ion sensing. Examples of “Design 1” were reported previously. In this work, the consequences of “Design 2” are explored.
from the long wavelength (red-emitting) distyryl-Bodipy dye. Considering the bright emission characteristics of the parent (unfunctionalized) Bodipy dye, and yet the emission in the relevant region is very weak, it is clear that the energy transfer is highly efficient. There is only very little residual emission around 540 nm on excitation of the corresponding yellow-emitting shorter wavelength chromophore. We should also note that the cassette with larger separation between the chro-mophores (8) display a larger residual emission in the shorter wavelength region, which is in accordance with Fo¨rster energy transfer efficiency being dependent on the distance between the donor and acceptor chromophores.
Following the second round of Knoevenagel condensation at the shorter wavelength chromophore, this chromophore was converted to a monostyryl-Bodipy derivative, with a corre-sponding red shift of 100 nm in the absorption peak to 625 nm (Table 1). Thus, the absorbance spectra of compounds 9a, 10a (Supporting Information), 9b (Figure 5), and 10b have a common and interesting feature: since the distyryl and
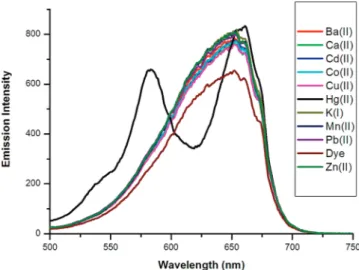
monostyryl-Bodipy chromophores had typically broad absorbance peaks, these two peaks corresponding to monostyryl and distyryl derivatives overlap, resulting in a single broader absorption. The observed peak shape is not due to aggregation, as it is unaltered in different solvents and at different concentrations (Supporting Information). Compounds 9a and 10a are responsive to acid (perchloric acid), and as expected, the energy donor chro-mophore peaks move to shorter wavelengths on protonation of the diemthylamino function (Supporting Information). When the dyads 9b (Figure 5) and 10b (Supporting Information) were titrated with Hg(II) ions, the two overlapping absorption peaks tend to resolve into separate peaks as a result of a blue shift in the monostyryl-Bodipy chromophore carrying the azathiacrown ligand as an ICT donor group. This blue shift originates from the decrease in the electron-donating character of the dialky-lamino function of the azathiacrown moiety on metal ion binding, in accordance with the general principles of intramo-lecular charge transfer.13Excitation of the dilute THF solution of 9b at the wavelength corresponding to Hg(II)-bound monos-tryl chromophore (580 nm) results in a large (more than 5-fold) increase in the emission peak (Figure 6). Benesi-Hildebrand analysis of the data yields a 1:1 binding constant of 7.8× 10⁵ M-1 (Supporting Information). The interaction between the ligand and Hg(II) ions is quite selective as evidenced by the plot of emission intensities at 675 nm (Figure 7). Other ions tested, including softer metal ions such as Pb(II) and Cd(II), did not show significant responses at the concentrations used in this study. Excitation spectra (Figure 8) obtained in dilute
(13) Valeur, B. Molecular Fluorescence; Wiley-VCH: Weinheim, Germany, 2002.
(14) Grynkiewicz, G.; Poenie, M.; Tsien, R. Y. J. Biol. Chem. 1985, 260, 3440–3450.
(15) Sudeep, P. K.; Thomas, K. G.; George, M. V.; Barazzouk, S.; Kamat, P. V. Org. Lett. 2002, 2, 29–35.
(16) Hsung, R. P.; Babcock, J. R.; Chidsey, C. E. D.; Sita, L. R. Organometallics 1995, 14, 480.
Figure 2. Targeted Bodipy-based energy transfer cassettes and/or ion sensors.
Table 1. Selected Spectroscopic Data for Compounds 7-10
λmax(nm) εmax(M-1cm-1) fwhm (cm-1)
compound λmax(d)a λmax(a)a ε (d)a ε (a)a fwhm (d)a fwhm (a)a QY, φb
7 525 657 73500 95700 766 1137 0.41 8 525 657 69900 84600 766 986 0.46 9a 652 63600 2345 0.28 9b 635 82400 2155 0.26 10a 652 52400 2345 0.45 10b 635 69500 2235 0.52 9a + TFA 580 656 45700 47900 1218 1083 0.76 9b + Hg(II) 581 655 70400 58400 1183 936 0.68 10a + TFA 580 656 38200 41800 1597 1266 0.81 10a + Hg(II) 582 655 57000 49000 1474 1058 0.73
ad stands for the energy donor chromophore peak, and a for the energy acceptor chromophore peak.bQuantum yields were determined in reference to Rhodamine 6G (0.95 in ethanol).
THF solutions of 9b in the presence of metal ions at 10 µM concentration clearly show that only with Hg(II) ions does the blue shift of the monostyryl absorbance take place, resulting in two separate excitation peaks. Thus, the excitation spectrum very
clearly resembles the absorbance spectrum and corroborates other evidence for highly efficient energy transfer.
The titration of the dyad 9b with Hg(II), when studied carefully, also reveals the change in energy transfer as a function
of Hg(II) concentration (hence metal-bound dyad percentage). The emission data in Figure 6 were reanalyzed as follows. When excited at 580 nm, the small peak at around 600 nm is due to
the fluorescence emission of the shorter wavelength emitting monostyryl dye. The ratio of emission at 675 nm to the emission at 600 nm (I675/I600) is a very useful parameter reflecting the efficiency of energy transfer; as the spectral overlap decreases as a result of the blue shift on Hg(II) binding, the efficiency of energy transfer decreases. The emission intensity at 675 nm increases, but this is only due to increasing absorbance at the excitation wavelength. The intensity data ratios at 675/600 nm, as obtained from the spectra shown in Figure 6 when plotted as a function of Hg(II) concentrations, display very clearly that as the metal ion concentration increases, energy transfer efficiency decreases (Figure 9). On the other hand, the chemosen-sors 9b and 10b should be excitation ratiometric by virtue of their design. The excitation spectra shown in Figure 8 is sufficient to establish this fact. Excitation data at two selected wavelengths, 580 and 620 nm, yields the optimal results: The excitation ratio at zero metal ion concentration (I580/I620) gives a value of 1.93, whereas the same ratio at 10 µM Hg(II) results
Figure 3. Absorption spectra of compounds 7 and 8in THF at 1.17× 10⁻⁶M and 1.11× 10⁻⁶M, respectively.
Figure 4. Emission spectra of compounds 7 and 8 in THF at a concentration of 1.17× 10⁻⁶M and 1.11× 10⁻⁶M. Excitation was at 520 nm.
Figure 5. Absorbance spectra of compound 9b in THF (1.25× 10⁻⁶M) in the presence of increasing Hg(II) concentrations (0, 1.0, 2.0, 3.0, 4.0, 5.0, 10, 15, 20 µM).
Figure 6. Emission spectra of compound 9b in THF (1.25× 10⁻⁶M) in the presence of increasing Hg(II) concentrations (0, 1.0, 2.0, 3.0, 4.0, 5.0, 7.5,10, 12.5, 15, 20 µM). Excitation was at 580 nm.
Figure 7. Emission ratios for the compound 9b (in THF (1.25× 10⁻⁶M) obtained in the presence of different metal cations. The chemosensor was excited at 580 nm, and the ratios of emission data at 675 nm were calculated. Inset: Digital photograph of vials containing THF solutions of the chemosensor 9b alone and in the presence of metal ions introduced as anhydrous perchlorate salts. Upper series, under ambient light, lower series under UV illumination at 360 nm.
in a value of 0.48. A 2-fold change in the excitation ratios is considered highly satisfactory for ratiometric chemosensors.14 Conclusion
With this work we were able to generalize our earlier designs for excitation energy transfer coupled ion sensing using a different design, where primarily the spectral characteristics of the energy donor chromophore were modulated. The result is a lesser energy transfer as the metal ion binds the ligand. The spectral position of the major emission peak at longer wave-lengths is not changed, in effect resulting in dual-excitation ratiometric chemosensors. Modular design and remarkable tunability of Bodipy spectral characteristics by simple deriva-tizations are the two main reasons why this approach in chemosensor development looks highly promising.
Experimental Section
Distyryl-Bodipy Compound 2. Compound 1 (1.0 mmol, 506 mg) and 4-butoxybenzaldehyde (2.2 mmol, 392 mg; synthesized according to literature procedure15) were refluxed in a mixture of benzene (40.0 mL), glacial acetic acid (440 µL), and piperidine (530 µL). Water formed during the reaction was removed azeo-tropically by heating overnight in a Dean-Stark apparatus. Crude
degassed with argon for 15 min. Trimethylsilylacetylene (0.70 mmol, 0.1 mL) was then added. The reaction mixture was stirred overnight at room temperature. After completion of the reaction, solvent was removed in vacuo. The crude product purified by silica gel column chromatography (eluent: CHCl3). Green solid (210 mg, 87%).1H NMR (400 MHz, CDCl 3) δ 7.50 (d, 2H, J ) 15.8 Hz), 7.42 (d, 2H, J ) 8.1 Hz), 7.35 (d, 4H J ) 7.9 Hz), 7.10 (d, 2H, J ) 8.2 Hz), 7.02 (d, 2H, J ) 16.1 Hz), 6.70 (d, 4H, J ) 8.4 Hz), 3.80 (t, 4H, J ) 6.4 Hz), 2.46-2.39 (m, 4H), 1.66-1.58 (m, 4H), 1.35-1.26 (m, 6H), 1.15 (s, 6H), 1.00 (t, 6H, J ) 7.5 Hz), 0.80 (t, 6H, J ) 7.3 Hz), 0.12 (s, 9H).13C NMR (100 MHz, CDCl 3) δ 159.9, 150.8, 138.5, 136.8, 135.7, 134.4, 132.7, 130.2, 129.6, 128.3, 127.7, 123.8, 118.0, 114.9, 104.5, 95.7, 67.9, 31.4, 19.3, 18.5, 14.1, 13.9, 11.8, 0.0
Deprotection of Compound 3. NaOH (2.0 mmol, 80.0 mg) in 5.0 mL of MeOH was added to a solution of 3 (1.0 mmol, 800 mg) in MeOH/CH2Cl2(10 mL/30 mL). The solution was stirred at rt for 1 h, until the complete consumption of the starting material was observed by TLC (CHCl3/Hex 1:1). Water (30.0 mL) was added, and the solution was extracted with CH2Cl2(3× 30 mL). The organic layer was concentrated under reduced pressure and then subjected to column chromatography on silica (eluent: CHCl3), yielding the deprotected compound 4 (680 mg, 93%). 1H NMR (400 MHz, CDCl3) δ 7.60 (d, 2H, J ) 15.7 Hz), 7.50 (d, 2H, J ) 8.1 Hz), 7.40 (d, 4H, J ) 7.9 Hz), 7.24 (d, 2H, J ) 8.1 Hz), 7.15 (d, 2H, J ) 16.7 Hz), 6.80 (d, 4H, J ) 8.3 Hz), 3.90 (t, 4H, J ) 6.4 Hz), 3.10 (s, 1H), 2.58-2.48 (m, 4H), 1.77-1.70 (m, 4H), 1.45-1.38 (m, 6H), 1.30 (s, 6H), 1.10 (t, 6H, J ) 7.3 Hz), 0.90 (t, 6H, J ) 7.2 Hz). Used without further purification.
Phenylethynyl Spacer Extension (compound 5). (2-(4-Io-dophenyl)ethynyl)trimethylsilane (0.4 mmol, 120 mg; synthesized according to literature procedure16), compound 4 (0.33 mmol, 240 mg), PdCl2(0.06 mmol, 10.6 mg), CuI (0.12 mmol, 23 mg), and PPh3(0.24 mmol, 63.0 mg) were added to the round bottomed flask which was previously flushed with argon. As a solvent, Et3N (5.0 mL) and anhydrous THF (30.0 mL) were added. The reaction mixture was stirred overnight at room temperature. After completion of the reaction, solvent was removed in vacuo. The crude product purified by silica gel column chromatography (eluent: CHCl3). Green solid (130 mg, 44%). 1H NMR (400 MHz, CDCl 3) δ 7.62-7.55 (m, 4H), 7.48 (d, 4H, J ) 8.6 Hz), 7.46-7.37 (m, 2H) 7.34-7.10 (m, 2H), 6.85 (d, 4H, J ) 8.4 Hz), 3.90 (t, 4H, J ) 6.5 Hz), 2.50 (m, 4H), 1.70 (m, 4H), 1.40 (m, 6 H), 1.30 (s, 6H), 1.10 (t, 6H, J ) 7.4 Hz), 0.90 (t, 6H, J ) 7.4 Hz), 0.20 (s, 9H).13C NMR (100 MHz, CDCl3) δ 160.0, 150.8, 138.5, 136.8, 135.8, 133.9, 132.8, 132.3, 131.7, 131.5, 130.2, 129.2, 128.9, 123.8, 123.4, 123.0, 118.1, 114.9, 104.6, 96.6, 90.7, 90.4, 67.9, 31.4, 29.7, 19.3, 18.4, 14.1, 13.9, 11.8, 0.0.
Deprotection of Compound 5. Deprotection of compound 5 (0.5 mmol, 450 mg) was carried out following the same procedure used for the deprotection of compound 3. The crude product 6 was used in the next step without further purification (330 mg, 82%).
Figure 8. Excitation spectrum of compound 9b in the presence of various cations (50 µM) (followed at 675 nm).
Figure 9. I675/I600ratio as an indicator of energy transfer efficiency. Data
were collected from the spectra shown in Figure 6.
Dyad 7. Compound 1 (0.2 mmol, 110 mg), compound 4 (0.2 mmol, 150.0 mg), PdCl2(0.06 mmol, 11.0 mg), CuI (0.12 mmol, 23.0 mg), and PPh3(0.24 mmol, 63.0 mg) were added to the round bottomed flask which was previously flushed with argon. As a solvent, Et3N (5.0 mL) and anhydrous THF (50.0 mL) were added. The mixture was heated at 60°C under argon for 24 h, until the complete consumption of starting material was observed. The solution was evaporated to dryness, and the product was purified by column chromatography on silica (eluent: CHCl3), yielding the desired compound 7 (90.0 mg, 41%).1H NMR (400 MHz, CDCl 3) δ 7.67-7.60 (m, 4H), 7.58 (d, 2H, J ) 15.9 Hz), 7.50 (d, 4H, J ) 8.1 Hz), 7.29-7.22 (m, 4H), 7.15 (d, 2H, J ) 16.2 Hz), 6.85 (d, 4H, J ) 8.6 Hz), 3.90 (t, 4H, J ) 6.5 Hz), 2.50 (m, 4H), 2.45 (s, 6H), 2.20 (m, 4H), 1.70 (m, 4H), 1.40 (m, 4H), 1.30 (s, 6H), 1.25 (s, 6H), 1.10 (t, 6H, J ) 7.5 Hz), 0.90 (t, 12H, J ) 6.7 Hz).13C NMR (100 MHz, CDCl3) δ 159.9, 154.1, 150.8, 139.2, 138.4, 138.2, 136.7, 136.2, 135.8, 133.8, 133.0, 132.7, 132.3, 130.6, 130.3, 130.1, 129.2, 128.8, 123.5, 117.9, 114.9, 90.1, 67.9, 31.3, 19.3, 18.4, 17.3, 17.1, 14.6, 14.08, 13.9, 12.6, 11.9, 11.7, 9.4. MALDI-TOF-MS calcd for [M]+1102.6, found 1102.9.
Dyad 8. Sonagashira coupling of compounds 1 and 6 were done following the same procedure used for the synthesis of dyad 7. Purification by column chromatography on silica (eluent: CHCl3) yielded 8 (140 mg, 46%).1H NMR (400 MHz, CDCl 3) δ 7.66-7.55 (m, 6H), 7.50 (s, 4H), 7.45 (d, 4H, J ) 7.9 Hz), 7.36-7.22 (m, 4H), 7.15 (d, 2H, J ) 18.3 Hz), 6.85 (d, 4H, J ) 8.6 Hz) 3.90 (t, 4H, J ) 6.4 Hz), 2.59-2.52 (m, 4H), 2.47 (s, 6H), 2.28-2.19 (m, 4H), 1.77-1.68 (m, 4H), 1,51-1.44 (m, 4H), 1.30 (s, 6H), 1.26 (s, 6H), 1.10 (t, 6H, J ) 7.2 Hz), 0.90 (t, 12H, J ) 7.3 Hz).13C NMR (100 MHz, CDCl3) δ 158.9, 153.1, 137.4, 137.2, 135.1, 134.7, 132.8, 140.0, 131.7, 131.2, 130.7, 129.6, 129.1, 128.1, 127.7, 127.6, 122.6, 122.1, 116.9, 113.8, 89.9, 66.8, 30.3, 18.2, 17.4, 16.1, 13.6, 13.0, 12.8, 11.5, 10.9, 10.7. MALDI-TOF-MS calcd for [M]+ 1202.7, found 1202.9.
Compound 9a. Compound 7 (0.045 mmol, 50 mg) and p-(dimethylamino)benzaldehyde (0.05 mmol, 7.5 mg) were refluxed in a mixture of benzene (40.0 mL), glacial acetic acid (0.5 mL), and piperidine (0.5 mL). Any water formed during the reaction, was removed azeotropically by heating overnight in a Dean-Stark apparatus. The solvent was removed in vacuo, and then crude product was purified by preparative thin layer chromatography (solvent: CHCl3). Dark blue colored fraction was collected (15.0 mg, 27%).1H NMR (400 MHz, CDCl 3) δ 7.72-7.68 (m, 4H), 7.63 (d, 1H, J ) 16.7 Hz), 7.53 (d, 4H, J ) 8.4 Hz), 7.48 (d, 2H, J ) 15.9 Hz), 7.37-7.31 (m, 4H), 7.20 (d, 1H, J ) 16.4 Hz), 6.90 (d, 4H, J ) 8.6 Hz), 6.70 (d, 2H, J ) 15.9 Hz), 4.00 (t, 4H, J ) 7.6 Hz), 3.00 (s, 6H), 2.64-2.55 (m, 4H), 2.52 (s, 3H), 1.81-1.73 (m, 4H), 1.54-1.46 (m, 4H), 1.40 (s, 6H), 1.35 (s, 6H), 1.18-1.10 (m, 9H), 0.99-0.92 (m, 9H).13C NMR (100 MHz, CDCl 3) δ 159.9, 150.8, 138.4, 137.2, 136.6, 135.7, 133.8, 133.4, 132.7, 132.2, 131.2, 130.1, 129.2, 129.0, 128.8, 128.8, 123.6, 123.4, 117.9, 114.8, 112.4, 108.3, 90.2, 90.0, 67.9, 40.4, 31.3, 29.7, 19.2, 18.4, 17.1, 14.6, 14.0, 13.8, 12.6, 11.8, 11.7, 11.6. MALDI-TOF-MS calcd for [M]+ 1233.6, found 1233.9.
Compound 10a. Compound 8 (0.042 mmol, 50 mg) and p-(dimethylamino)benzaldehyde (0.05 mmol, 7.5 mg) were refluxed in a mixture of benzene (40.0 mL), glacial acetic acid (0.5 mL), and piperidine (0.5 mL). The procedure followed was essentially identical to that for compound 9a. Dark blue colored fraction was collected (12 mg, 20%).1H NMR (400 MHz, CDCl 3) δ 7.67-7.61 (m, 6H), 7.60 (d, 1H, J ) 16.7 Hz), 7.58-7.48 (m, 8H), 7.32-7.24 (m, 4H), 7.18-7.07 (m, 3H), 6.85 (d, 4H, J ) 8.6 Hz), 3.90 (t, 4H, J ) 7.6 Hz), 3.00 (s, 6H), 2.68-2.56 (m, 7H), 1.86-1.77 (m, 4H), 1.54-1.48 (m, 4H), 1.40 (s, 6H), 1.35 (s, 6H), 1.14-1.07 (m, 9H), 0.98-0.89 (m, 9H). MALDI-TOF-MS calcd for [M]+ 1333.7, found 1333.9.
Compound 9b. Compound 7 (0.045 mmol, 50 mg) and 4-(1-aza-7,10-dioxa-4,13-dithiacyclopentadecyl)benzaldehyde (0.05 mmol, 18 mg; synthesized according to literature procedure17) were refluxed in a mixture of benzene (40.0 mL), glacial acetic acid (0.5 mL), and piperidine (0.5 mL). Any water formed during the reaction was removed azeotropically by heating overnight in a Dean-Stark apparatus. The solvent was removed in vacuo, and then the crude product was purified by preparative thin layer chromatography (solvent: CHCl3). The green colored fraction was collected (20.0 mg, 31%).1H NMR (400 MHz, CDCl 3) δ 7.68-7.61 (m, 4H), 7.58 (d, 1H, J ) 15.8 Hz), 7.50 (d, 4H, J ) 8.4 Hz), 7.42 (d, 2H, J ) 16.6 Hz), 7.31-7.24 (m, 4H), 7.12 (d, 1H, J ) 15.4 Hz), 6.85 (d, 4H, J ) 8.4 Hz), 6.59 (d, 2H, J ) 15.9 Hz), 3.90 (t, 4H, J ) 6.9 Hz), 3.70-3.62 (m, 4H), 3.59-3.51 (m, 8H), 2.90-2.81 (m, 4H), 2.71-2.65 (m, 4H), 2.53-2.49 (m, 4H), 2.47 (s, 3H), 2.30-2.20 (m, 2H), 1.78-1.70 (m, 4H), 1.49-1.40 (m, 4H), 1.30 (s, 6H), 1.25 (s, 6H), 1.12-1.07 (m, 9H), 0.90 (t, 9H, J ) 7.3 Hz).13C NMR (100 MHz, CDCl3) δ 158.9, 152.6, 150.2, 149.7, 146.4, 137.4, 136.2, 135.6, 135.1, 134.7, 132.8, 132.3, 131.7, 131.3, 130.8, 130.1, 129.1, 128.1, 128.0, 127.8, 124.8, 122.5, 118.9, 117.7, 116.9, 114.9, 113.8, 110.9, 89.1, 88.9, 73.2, 69.7, 66.8, 51.0, 30.3, 30.3, 28.6, 18.2, 17.4, 16.1, 13.6, 13.0, 12.8, 11.6, 10.8, 10.7, 10.6. MALDI-TOF-MS calcd for [M]+1439.7, found 1440.0.
Compound 10b. Compound 8 (0.042 mmol, 50.0 mg) and 4-(1-aza-7,10-dioxa-4,13-dithiacyclopentadecyl)benzaldehyde (0.05 mmol, 18 mg) were refluxed in a mixture of benzene (40.0 mL), glacial acetic acid (0.5 mL), and piperidine (0.5 mL). The procedure followed was essentially identical to that for compound 9a. The green colored fraction was collected (15.0 mg, 30%).1H NMR (400 MHz, CDCl3) δ 7.67-7.60 (m, 4H), 7.54-7.43 (m, 9H), 7.29-7.21 (m, 4H), 7.16-7.12 (m, 3H), 6.85 (d, 4H, J ) 8.4 Hz), 6.60 (d, 2H, J ) 15.9 Hz), 3.90 (t, 4H, J ) 6.9 Hz), 3.79-3.68 (m, 4H), 3.63-3.51 (m, 8H), 2.86-2.79 (m, 4H), 2.74-2.68 (m, 4H), 2.59-2.54 (m, 4H), 2.50 (s, 3H), 2.18-2.09 (m, 2H), 1.76-1.68 (m, 4H), 1.45-1.39 (m, 4H), 1.30 (s, 6H), 1.25 (s, 6H), 1.14-1.07 (m, 9H), 0.90 (t, 9H, J ) 7.3 Hz).13C NMR (100 MHz, CDCl3) δ 156.9, 152.3, 151.2, 149.7, 146.4, 137.3, 136.3, 135.3, 135.1, 134.7, 132.5, 132.3, 131.7, 131.3, 130.8, 130.1, 129.6, 128.1, 128.0, 127.8, 125.8, 122.7, 118.9, 117.7, 116.9, 114.9, 113.8, 110.9, 89.1, 88.9, 73.2, 69.7, 66.8, 51.0, 30.3, 30.3, 28.6, 18.2, 17.4, 16.1, 13.6, 13.0, 12.8, 11.6, 10.8, 10.7, 10.7. MALDI-TOF-MS calcd for [M - H]+
1538.7, found 1538.6.
Acknowledgment. The authors gratefully acknowledge support from TUBITAK and TUBA. R.G. thanks TUBITAK for a graduate scholarship.
Supporting Information Available:1H and13C NMR spectra, additional absorbance and emission spectra, binding data, mass spectra, and energy-minimized structures. This material is available free of charge via the Internet at http://pubs.acs.org.
JA902584A
(17) Ishikawa, J. Bull. Chem. Soc. Jpn. 1995, 68, 3071–3076.