Article
Measuring International Migration in Azerbaijan
Serhat Yüksel1 ID, Shahriyar Mukhtarov2,3, Ceyhun Mahmudlu4,5, Jeyhun I. Mikayilov6,7,*
and Anar Iskandarov4,8
1 School of Business, ˙Istanbul Medipol University, Kavacık Mah. Ekinciler Cad. No. 19 Kavacık Kav¸sa ˘gı—Beykoz, ˙Istanbul 34810, Turkey; [email protected]
2 Department of Economics and Management, Khazar University, Mehseti Str. 41, Baku AZ1096, Azerbaijan; [email protected]
3 Department of Economics and Management, Azerbaijan State University of Economics (UNEC), Istiqlaliyyat Str. 6, Baku AZ1141, Azerbaijan
4 Department of International Relations, Baku Engineering University, Hasan Aliyev 120, Khirdalan AZ0101, Azerbaijan; [email protected] (C.M.); [email protected] (A.I.)
5 Azerbaijan National Academy of Sciences, Institute of Archaeology and Ethnography, Husein Javid Avenue 115, Baku AZ1096, Azerbaijan
6 King Abdullah Petroleum Studies and Research Center, P.O. Box 88550, Riyadh 11672, Saudi Arabia 7 Department of Statistics, Azerbaijan State University of Economics (UNEC), Istiqlaliyyat Str. 6,
Baku AZ1141, Azerbaijan
8 International Border Management Unit, International Organization for Migration Mission in Azerbaijan, Baku AZ1096, Azerbaijan
* Correspondence: [email protected]; Tel.: +966-53-732-41-74 Received: 27 November 2017; Accepted: 5 January 2018; Published: 10 January 2018
Abstract:International migration significantly affects economic, social, cultural, and political factors of the country. Owing to this situation, it can be said that the reasons of international migration should be analyzed in order to control this problem. The purpose of this study is to determine the influencing factors of international migration in Azerbaijan. In this scope, annual data of 11 explanatory variables for the period of 1995–2015 was analyzed via Multivariate Adaptive Regression Splines (MARS) method. According to the results of this analysis, it was identified that people prefer to move other countries in case of high unemployment rates. In addition, the results of the study show that population growth and high mortality rate increases the migration level. While considering these results, it was recommended that Azerbaijan should focus on these aspects to control international migration problem.
Keywords:migration; international migration; determinants of migration; MARS method; Azerbaijan
1. Introduction
Michael Fisher [1] in his book “Migration: A World History” argues that we all are descendants of migrants and the process of migration began from the emergence of the homo sapience and still is ongoing and with great possibility will continue in the later periods of the history. According to him, climate changes, wars, starvation, technological developments, and some other historical process contributed intensity and extension of the size and geography of migration [1]. From this perspective it is possible to argue that the causes of the migration are different and they can be changed as a result of expected and unexpected economic, social, political, scientific, and apparently psychological process.
In addition, it is also possible to argue that while some of the migrations were peaceful, other were violent. For instance, wars, in particular two world wars, which were followed with high level of violence, triggered the level of migrant flow.
In general, migration can be divided into two forms: internal and international. If the movement of people is occurred within the country, it is called as internal migration. In other words, in internal migration, people prefer to live in another city or region of the same country [2]. On the other side, when this movement is taken place from one country to another, it is named as international migration [3].
Due to its influence on global affairs, recently international migration became one of the discussion topics. In this regard, it is important to determine factors that trigger this process. Actually, it can be assumed that some reasons may encourage people for international migration. First of all, in order to have better economic standards, people move to other countries in which economic growth are much higher. The main reason for this condition is that people aim to find better jobs and earn more money. Therefore, it can be said that regarding economic factors, international migration is mainly occurred from low-income countries to the high-income countries [4].
Second, social factors are also important reasons for international migration [5]. In this concept, higher population in a country might decrease the quality of the life and may increase level of social problems, such as crime rate. In addition, problems related to education and health care in a country leads people to move other countries in order to have higher standards in this respect.
Moreover, political factors also cause international migration [6]. Thus, people do not prefer to live in a country that has political instability [6]. This situation is more observed during the collapse of the empires that inherited bloody conflicts among the nations.
Although, the collapse of the Soviet Union is not the most important historical event that fostered global migration, without any doubt it had crucial impact on the population changes on regional level that continued with high dynamics at least a decade and a half [7]. Disintegration of the Soviet Union created new migration realities for the people of this region. Due to Soviet doctrinal and political legacies, state building process in the newly established states was followed with nationalism, ethnic separatism, and territorial claims, which triggered ethnic and civil wars that resulted with flows of refugee and internally displaced people (IDPs) [8]. Besides, positive factors such as freedom of entrance and exit, market economy and high education level inspired at least some part of the population to find good opportunities for migration in order to improve their life standards. Although, in the early years of the independence migration flows were mainly observed within the Post-Soviet space, extension of Schengen Agreement in neighboring EU countries contributed integration of CIS countries into the world migration system [6].
Azerbaijan began to experience movement of people in the eve of the collapse of the Soviet Union due to territorial conflict over Nagorno-Karabakh with neighboring Armenia [9]. Recently, numbers of scholarly works were written on assessing migration process in Azerbaijan from various aspects. For instance, Rowland [10] and Aliyev [11] studied internal migration process in Azerbaijan from the perspective of demographic changes and movement from rural to urban areas. Both of them found direct relations between the Nagorno-Karabakh conflict and population changes in the country in the early 1990s. In addition, according to Rowland [10], during 1989–1999 the urban population of Azerbaijan grew much more slowly than did the rural population due to emigration of Russians and Armenians from Azerbaijan, who mainly populated in urban areas. Besides, as Aliyev [11] mentions, due to the Nagorno-Karabakh conflict around 600 thousand Azerbaijanis expelled from their homes and became IDPs, which also increased the level of internal migration in the country. In addition, Aliyev [11] indicates that increase of state revenues due to energy resources also caused increase of people movement from rural areas to urban places. According to him, while there were positive effects of internal migration to rural areas, such as creation of new employments and income, loss of skilled labors was negatively affected to rural areas [11].
It should be highlighted that number of scholars, who deal with migration research, focused on the study of Azerbaijani labor migrants in Post-Soviet countries, particularly in Russia [12,13]. The main aim of this scholars was to find pushing factors of emigration from Azerbaijan and to discuss
formal and informal business institution of Azerbaijani labor migrants. In addition, some of them investigated social impacts, such as identity issues on younger generation of migrants [14].
Rumyantsov [15], in his turn, studied immigration and reintegration process in Azerbaijan. He divides immigrants in Azerbaijan into three groups: (1) natives of Azerbaijan (re-emigrants) and their family members; (2) ethnics from Georgia; (3) labor immigrants from different countries, who arrive to Azerbaijan to look for a job or to open their businesses. According to him, immigrants mainly accumulated in the capital city, Baku, and established transitional network in which they have integrated [15]. Rumyantsov [15], claims that majority of the immigrants are mainly ethnic Azerbaijanis who resided in the Post-Soviet countries and only few, whose number is estimated around 20,000–30,000, are from different nationalities. While ethnic Azerbaijanis immigrated for permanent purposes, others for temporary and mainly due to economic reasons.
In fact, actually, all above-mentioned works were able to reveal direct economic impact of migration to economy of Azerbaijan by using qualitative methods, but they failed empirically generalize whole picture of the process.
Indeed, few scholars implemented quantitative method to measure causes and consequences of migration to Azerbaijani society. For instance, Dermendzhieva [16], by using household data from CRRC (Caucasus Research Resource Center) Barometer, measured economic consequences of migration to Azerbaijan comparing it with the other two South Caucasus countries. Although, this research focuses on measuring of consequences of migration to economic situation in the three South Caucasus countries, it misses to determine factors influencing to dynamics of net migration in those states, including Azerbaijan.
This paper aims, by using recent statistical data on migration process in Azerbaijan, to shed light on this important issue for this country. This article investigates the role of economic and social factors on international migration process in Post-Soviet Azerbaijan. To investigate the above-mentioned relationship, we employed the Multivariate Adaptive Regression Splines (MARS) method to Azerbaijani data ranging from 1995 to 2015. The study contributes to the current literature from different aspects. First, it is a first study devoted to the above-mentioned relationship in case of Azerbaijan. Second, it employs the MARS method, which can be considered as a new and original method for the concept. The study also provides some policy recommendations to minimize the negative effects of the migration. Besides, it should be also noted that the paper miss to measure political factors triggering migration process, which is aimed to be investigated in our future works.
The rest of the paper structured as follow: Section 2 reviews the related literature and conceptualizes the theoretical framework of the study. Section3discusses the Post-Soviet situation in Azerbaijan regarding the international migration. The employed methodology and data described in Section4. Empirical results are given in Section5. Finally, Section6discusses the findings of the study and provides policy recommendations.
2. Theorizing Determinants of International Migration: Literature Review and Theoretical Framework
Considering interdisciplinary character of migration, recently numbers of mobility theories have been developed in social sciences. Simmel [17], for instance, developed an agenda that links mobility and materials. In his description, tempo of modern cities occupies central role in the mobilization of the people. According to him, in such high ration of impulses of cities people need to integrate their relations and activities into a highly complex organism, which in the end stimulate the level of their mobility ability [17]. Development of communication technologies triggered some of the scientists to analyze social and technical factors as a hybrid system. According to this view, distance among people, objects, and technologies became closer as a result of extended physical movement [18]. Theorists of ‘relationality’ and circulation [19–21] more focusing on relation between structure and agency concludes that movement of people, capital, and things in the end will form or reform of the
moved place [18]. Other scholar in the field studied emotional effects of movement of peoples not only themselves but also to their environment [21,22].
Actually, most of the works on mobility were researched qualitatively by using face to face meetings, interviews and focus groups, which are able to reveal problems in micro level and explain them in-depth, but lacks to generalize determinants of migration in macro level. In this regard, quantitative methods are the best to find relations between various factors in measuring of migration. Indeed, many quantitative studies found economic factors as the leading determinant in the fostering of international migration [23–32]. Jennissen [33], Balderas and Greenwood [27], Pânzaru [29] and Campaniello [31], analyzed the reasons of international migration in the European Union and identified that economic factors cause people to move to other countries. Moreover, Acupan and Agbola [34] and Deluna [35], determined similar conclusion for the Philippines. Mayda [24], evaluated the factors that affect international migration in the OECD countries and defined that economic factors play a significant role in this problem.
To access the effect of economic factors, four different variables: unemployment rate, inflation rate, economic growth, and foreign direct investment were considered. Based on the related literature, the main economic driver is unemployment rate [24,33,36–46].
Rise of unemployment rate in the country of origin push people to move to other countries and in the end increases emigration indicators. As Naudé [47], states better access to jobs in the destination country is additional factor attracting emigration of people. On the other hand, it can be argued that decrease of unemployment rate has opposite effects on emigration process. In this regard, to examine importance of unemployment rate in Azerbaijan on migration, we posit the following hypothesis:
Hypothesis 1. In Azerbaijan people more emigrate in the periods when there is high unemployment rate. Inflation rate is another important economic factor that may have direct effect on the level of migration. Indeed, high rate of inflation negatively effects on net incomes of population and in condition of low level of salaries people may seek new job opportunities in abroad. Indeed, and higher inflation demonstrate the fragility in the economy. Due to this condition, they should increase international migration from this country [35,39]. In this case, it can be argued that during a high rate of inflation people more emigrate.
Hypothesis 2. The level of emigration is higher in Azerbaijan when the rate of inflation is higher.
Economic growth and increase of foreign direct investment have positive effects on economy of the states. Both of these factors provide stability in the economy as a whole. Therefore, it can be expected that there should be indirect relationship between these variables and international migration from Azerbaijan [24,34,44,47].
Hypothesis 3. Increase of GDP per capita and foreign direct investment decrease the level of emigration in Azerbaijan and increase immigration.
In addition to the economic factors, it was determined that social factors also lead to international migration according to the results of some other studies [34,40,44,47,48]. Yang and Guo [48], conducted a study in order to analyze the factors that influence people to migrate from China. As a result of the survey analysis, it was identified that social factors play a key role in this problem. Furthermore, Carlos [41], Pedersen et al. [44] and Naudé [47], emphasized the similar conclusion by using regression analysis. Moreover, Brücker and Siliverstovs [40], evaluated international migration from other countries to Germany in their study. They used GMM analysis in order to reach this objective and concluded that there is a relationship between social factors and international migration.
Regarding social factors, 3 different variables were taken into the considerations, which are number of crimes, infant mortality rate, and number of population size. Since all these variables
represent negative aspects, there should be positive relationship between these variables and international migration from the country [23,49,50].
Hypothesis 4. When number of crime, infant mortality, and population increase rate is higher the level of emigration in Azerbaijan is higher.
The level of health care is another important variable measuring the role of social factors in international migration. In this regard, the number of the beds in Azerbaijani hospitals is used as a determinant factor for health care. Because this variable refers to the quality in health sector, it is expected that it should decrease emigration from Azerbaijan [42].
Hypothesis 5. When quality of education sector is higher the level of emigration is lower.
With respect to educational factors, 3 different variables were considered. When the number of schools and teachers is high, it was expected that people would not migrate from the country [25,33]. However, since the rate of illiteracy represents a negative situation in the country, there should be positive relationship between this variable and international migration from the country [45,48]. Hypothesis 6. The level of emigration is lower when the level of education is higher.
3. Migration in Azerbaijan
International migration is taken into the consideration significantly in Azerbaijan. The main reason behind this situation is that especially in the last 20 years, Azerbaijan experienced essential issues that cause migration. First of all, at the beginning of 1990s, the Soviet Union collapsed due to the economic problems and political instability [51]. As a result of that process, like in most of the Post-Soviet states, migration became one of the few choices for significant part of the population to search for better social-economic condition in Azerbaijan. In this regard, it is estimated that millions of Azerbaijani migrants moved to the various former Soviet Republics, particularly to Russia [9]. Indeed, establishment of labor migrant network of Azerbaijanis in the biggest cities of Russia fostered international migration process in Azerbaijan [13]. In this period, another important reason that caused the increase of the migration in Azerbaijan is the war with Armenia over Nagorno-Karabakh, which continued until the signing of ceasefire agreement between the parties in 1994 [52,53]. In fact, the war triggered the move of hundred thousands of Azerbaijanis from Armenia and Armenians from Azerbaijan. Besides, as a result of the war, almost one million of Azerbaijani became IDPs in their country [54]. Actually, the war worsened economic situation in the country. At a result not only internal migration, from rural to industrial urban areas, intensified, but also caused the increase of emigration from the country.
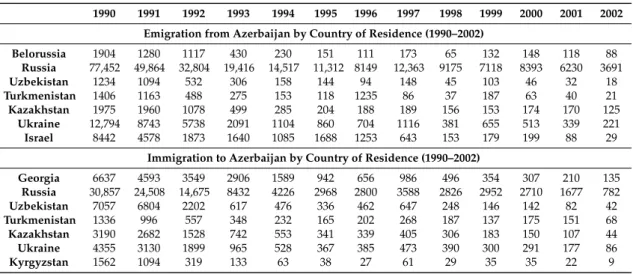
As it can be seen from Figure1, for the period of 1995–2007, in Azerbaijan, the number of total immigrants was lower than the number of emigrants. In other words, Azerbaijanis more emigrate in this period. According to the Table1, in the early 1990s, Azerbaijanis migrated particularly to Russia, Ukraine, and Israel. Azerbaijanis emigrated to Russia and Ukraine as labor migrants and were able to establish their ethnic, small, and medium enterprises [13]. Indeed, almost a great number of emigrants from Azerbaijan to Israel were ethnic mountainous Jews who are an indigenous group in this country.
Change of migration balance in favor of emigration in 2008 was caused due to global economic crises, while the change in 2013–2014, was mainly triggered by the drop of oil prices in the energy markets. Actually, Azerbaijan’s economy being significantly depended on oil prices faced with economic recession and followed with the increase of inflation and the decline of the value of national currency “manat” at least twice. All these factors inspired emigration from the country.
While comparing immigration process for the same period, however the difference with emigration is almost more than two times, one can find almost similar destination for the movement
(Table1). This tendency can be explained by the return of Azerbaijanis to home due to increase of ethnic tension in their left countries.
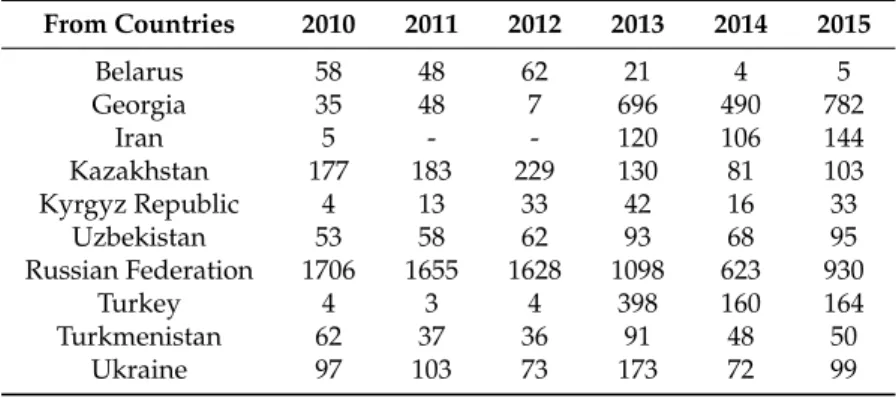
In the mid-2000s, the level of emigration slowed down and began to demonstrate opposite tendency. Particularly, after 2007 Azerbaijan became an immigrant-receiving country. As it can be observed in the Table2, Kazakhstan and Russian Federation play important role with respect to the immigration to Azerbaijan. Another important point for this situation is that there is an increase in the number of the immigrants from Iran and Turkey over the years. Actually, the increase of oil revenues in Azerbaijan caused the increase of immigration to Azerbaijan from neighboring countries. Indeed, recently Azerbaijani government enhanced state investment for infrastructure projects, which triggered involvement of foreign companies, particularly from Turkey. In fact, Turkish business organizations occupy one of the leading positions in the foreign direct investment to Azerbaijan. Indeed, there are 1685 Turkish companies that registered and operate in Azerbaijan.
Sustainability 2018, 10, 132 6 of 15
business organizations occupy one of the leading positions in the foreign direct investment to Azerbaijan. Indeed, there are 1685 Turkish companies that registered and operate in Azerbaijan.
Figure 1. Net migration in Azerbaijan in 1995–2015 (thousands). Source: [55]. Table 1. Emigration and Immigration in Azerbaijan (1990–2002).
1990 1991 1992 1993 1994 1995 1996 1997 1998 1999 2000 2001 2002 Emigration from Azerbaijan by Country of Residence (1990–2002)
Belorussia 1904 1280 1117 430 230 151 111 173 65 132 148 118 88 Russia 77,452 49,864 32,804 19,416 14,517 11,312 8149 12,363 9175 7118 8393 6230 3691 Uzbekistan 1234 1094 532 306 158 144 94 148 45 103 46 32 18 Turkmenistan 1406 1163 488 275 153 118 1235 86 37 187 63 40 21 Kazakhstan 1975 1960 1078 499 285 204 188 189 156 153 174 170 125 Ukraine 12,794 8743 5738 2091 1104 860 704 1116 381 655 513 339 221 Israel 8442 4578 1873 1640 1085 1688 1253 643 153 179 199 88 29
Immigration to Azerbaijan by Country of Residence (1990–2002)
Georgia 6637 4593 3549 2906 1589 942 656 986 496 354 307 210 135 Russia 30,857 24,508 14,675 8432 4226 2968 2800 3588 2826 2952 2710 1677 782 Uzbekistan 7057 6804 2202 617 476 336 462 647 248 146 142 82 42 Turkmenistan 1336 996 557 348 232 165 202 268 187 137 175 151 68 Kazakhstan 3190 2682 1528 742 553 341 339 405 306 183 150 107 44 Ukraine 4355 3130 1899 965 528 367 385 473 390 300 291 177 86 Kyrgyzstan 1562 1094 319 133 63 38 27 61 29 35 35 22 9 Source: [55].
Table 2. Immigration to Azerbaijan by Country of Residence (2010–2015).
From Countries 2010 2011 2012 2013 2014 2015 Belarus 58 48 62 21 4 5 Georgia 35 48 7 696 490 782 Iran 5 - - 120 106 144 Kazakhstan 177 183 229 130 81 103 Kyrgyz Republic 4 13 33 42 16 33 Uzbekistan 53 58 62 93 68 95 Russian Federation 1706 1655 1628 1098 623 930 Turkey 4 3 4 398 160 164 Turkmenistan 62 37 36 91 48 50 Ukraine 97 103 73 173 72 99 Source: [55].
Figure 1.Net migration in Azerbaijan in 1995–2015 (thousands). Source: [55].
Table 1.Emigration and Immigration in Azerbaijan (1990–2002).
1990 1991 1992 1993 1994 1995 1996 1997 1998 1999 2000 2001 2002 Emigration from Azerbaijan by Country of Residence (1990–2002)
Belorussia 1904 1280 1117 430 230 151 111 173 65 132 148 118 88 Russia 77,452 49,864 32,804 19,416 14,517 11,312 8149 12,363 9175 7118 8393 6230 3691 Uzbekistan 1234 1094 532 306 158 144 94 148 45 103 46 32 18 Turkmenistan 1406 1163 488 275 153 118 1235 86 37 187 63 40 21 Kazakhstan 1975 1960 1078 499 285 204 188 189 156 153 174 170 125 Ukraine 12,794 8743 5738 2091 1104 860 704 1116 381 655 513 339 221 Israel 8442 4578 1873 1640 1085 1688 1253 643 153 179 199 88 29
Immigration to Azerbaijan by Country of Residence (1990–2002)
Georgia 6637 4593 3549 2906 1589 942 656 986 496 354 307 210 135 Russia 30,857 24,508 14,675 8432 4226 2968 2800 3588 2826 2952 2710 1677 782 Uzbekistan 7057 6804 2202 617 476 336 462 647 248 146 142 82 42 Turkmenistan 1336 996 557 348 232 165 202 268 187 137 175 151 68 Kazakhstan 3190 2682 1528 742 553 341 339 405 306 183 150 107 44 Ukraine 4355 3130 1899 965 528 367 385 473 390 300 291 177 86 Kyrgyzstan 1562 1094 319 133 63 38 27 61 29 35 35 22 9 Source: [55].
Table 2.Immigration to Azerbaijan by Country of Residence (2010–2015). From Countries 2010 2011 2012 2013 2014 2015 Belarus 58 48 62 21 4 5 Georgia 35 48 7 696 490 782 Iran 5 - - 120 106 144 Kazakhstan 177 183 229 130 81 103 Kyrgyz Republic 4 13 33 42 16 33 Uzbekistan 53 58 62 93 68 95 Russian Federation 1706 1655 1628 1098 623 930 Turkey 4 3 4 398 160 164 Turkmenistan 62 37 36 91 48 50 Ukraine 97 103 73 173 72 99 Source: [55].
Increasing level of international migration in Azerbaijan fostered the development of the regulation of this field by the government. Initially, in 2006, it was adopted “State Migration Program in Azerbaijan Republic (2006–2008)” as a result of which a year later it was established State Migration Service (SMS) which is the main institution implementing state policy on migration. Besides, State Committee on Work with Diaspora (SCWD) was created in 2008 to coordinate state policy on Azerbaijanis living abroad. In addition, other state institutions such as Ministry of Foreign Affairs (MFA) and State Border Service (SBS) also directly involved to the regulation process of migration in Azerbaijan. The next section describes the employed data and econometric methodology.
4. Data and Methodology 4.1. Data
This study is going to utilize the annual data for the periods of 1995–2015 in order to define the determinants of the international migration in Azerbaijan, which was taken from the State Statistical Committee of the Republic of Azerbaijan [56] a and World Bank [57].
For understand the influencing factors of international migration in Azerbaijan, the authors of the study used net migration number of this country as a dependent variable. In this context, the difference between the people who came to Azerbaijan to live and the people who left the country represents net migration number [27,33,36]. In other words, if this value is negative, it means that people emigrate from Azerbaijan to other countries. In addition to this situation, for understanding the main indicators of this problem, 11 variables in 4 different categories were taken into the consideration after analyzing similar studies in the literature. The details of these variables were explained in Table3.
Before estimating the econometric relationships, the stationarity properties of the variables are investigated. To test the stationarity of the variables the well-known Augmented Dickey Fuller (ADF) [58] and Phillips-Peron (PP) [59], tests are utilized, which is not described here and the interested reader can refer to the related literature. Unit root tests for the variables are performed by EViews 8.0 program. The econometric relationships are conducted by using the MARS 2.0 program.
Table 3.List of Independent Variables. Type of the
Variables Variables References
Economic
Economic Growth (Real GDP (US$))
Acupan et al. [34], Balderas and Greenwood [27], Beyene [28], Brücker and Siliverstovs [40], Campaniello [31], Carlos [41], Darkwah and Verter [38], Deluna and Darius [35], Etzo [36], Freguglia et al. [30], Gregoriou et al. [43], Jennissen [33], Lewer and Van den Berg [60], Mayda [24], Naudé [47], Pedersen et al. [44], Sprenger [45], Sulaimanova and Bostan [46], Vogler and Rotte [23], White [50], Yang and Guo [48]
Unemployment Rate
Acupan et al. [34], Ahad [39], Brücker and Siliverstovs [40], Carlos [41], Darkwah and Verter [38], Deluna and Darius [35], Etzo [36], Farooq et al. [42], Gregoriou et al. [43], Jennissen [33], Pedersen et al. [44], Sprenger [45], Sulaimanova and Bostan [46]
Inflation Rate (CPI) Acupan et al. [34], Ahad [39], Deluna and Darius [35] Foreign Direct
Investment (US$) Acupan et al. [34]
Social
Number of Crime Beine and Parsons [61], Deluna and Darius [35] Farooq et al. [42], Freguglia et al. [30], Naudé [47], Vogler and Rotte [23]
Infant Mortality Rate (died before 1 year of age
for boys and girls)
Kim and Cohen [49]
Population (annual population growth)
Acupan et al. [34], Balderas and Greenwood [27], Carlos [41],
Darkwah and Verter [38], Deluna and Darius [35], Etzo [36], Freguglia et al. [30], Gregoriou et al. [43], Kim and Cohen [49], Lewer and Van den Berg [60], Mayda [24], Naudé [47], Pedersen et al. [44], Sprenger [45], White [50], Yang and Guo [48]
Health Number of the Beds inthe Hospital Farooq et al. [42], Freguglia et al. [30],
Educational
Number of the Schools Farooq et al. [42], Freguglia et al. [30], Jennissen [33], VanWey [25]
The Rate of Illiteracy Acupan et al. [34], Beyene (2011), [28], Deluna and Darius [35], Lewer and Van den Berg [60], Pedersen et al. [44], Sprenger [45], Yang and Guo [48] Number of the Teachers Farooq et al. [42], Jennissen [33], VanWey [25]
4.2. Methodology: MARS Method
Multivariate Adaptive Regression Splines (MARS) method was developed by Jerome Friedman in 1991. It is a type of the regression method, which analyzes the relationship between dependent and independent variables. This method has some advantages in comparison with some other estimation methods. First, it allows using number of explanatory variables because of its “multivariate nature”. Moreover, the word “adaptive” refers to the situation that it can choose the best model while evaluating many different alternatives. In addition, instead of making a simple regression line “smoothing splines” are used in the analysis process. Therefore, it can be argued that the relationship between the variables can be analyzed more effectively [62]. The equation of MARS method was given below.
Y=B0+ K
∑
n=1
anBn(Xt) +ε (1)
In this equation, the term “Y” refers to the dependent variable. On the other hand, “X” shows the independent variables that may have an effect on the dependent variable. Therefore, it can be understood that there are k explanatory variables in the analysis. Additionally, “anBnXt” refers to the basis function, so “anBn” gives information about the coefficient of the basis of functions. In other words, it can be also seen that there will be k different basis functions with the combinations of t different explanatory variables. Furthermore, “ε” demonstrates error term of the equation.
MARS method has some advantages by comparison with other regression analysis. First, in this method, independent variables can take more than one coefficient in accordance to different conditions. In this regard, it can be possible to reach more successful results. In addition, in MARS method, there is no Multicollinearity problem, which refers to the high value of the relationship among
explanatory variables. Thus, relatively higher number of independent variables can be included in the analysis process.
On the other side, with respect to the model developing process, MARS method has two different stages. First, all potential basis functions are developed by the system while considering the meaningful combinations of independent variables. This process continues until the reaching of the most complex model. The size of the most complex model depends on the data embedded to the MARS system by the users. Within this scope, on the system, the space of “the maximum amount of basic functions” should be completed with numbers that are between 0 and 250 [63].
The second stage of the modeling process in MARS method is reaching the best model. Within this context, some unnecessary basis functions are eliminated from the most complex method by the system. For this purpose, two different criteria play an important role, which are GCV (generalized cross validation) and R2values. Since GCV refers to error value and R2shows how well a model is explained, the bases of functions, which will be eliminated by the system, have high GCV and low R2 values. In other words, the best model has the highest R2and lowest GCV values [62].
Since MARS is a relatively new method, it can be seen that there are few studies in the literature in which this method was used. Sephton [64], determined that MARS method is more successful than probit method [65] to predict the recession. Similar to this study, Bolder and Rubin [66], concluded that MARS method gives better results to define the best debt strategy in comparison with Kernel regression analysis. Moreover, Muzır [67], made a study about credit risk of Turkish banks and defined that MARS method measures this risk better than the logistic regression [68] analysis. Migues et al. [69], also reached the same conclusion with respect to the evaluation of customer attrition. Furthermore, Yüksel and Zengin [70] identified that MARS method is better than logit method [68] so as to determine the early warning signals of global mortgage crisis.
In addition to those studies, Tunay [63] and Oktar and Yüksel [71], used MARS method in order to evaluate the significant factors of the banking crisis in Turkey. Moreover, Sephton [64] and Tunay [72], made a study to analyze the recession by using this method. Yüksel [73], analyzed the determinants of non-performing loans and Tunay [74], evaluated the stability in Turkey with respect to the velocity of money circulation. Altun and Türkan [75], determined that employment rate is the most important indicator of the life satisfaction in OECD countries, employing MARS method.
The next section provides the empirical results based on the employing MARS method to the Azerbaijani data.
5. Empirical Results
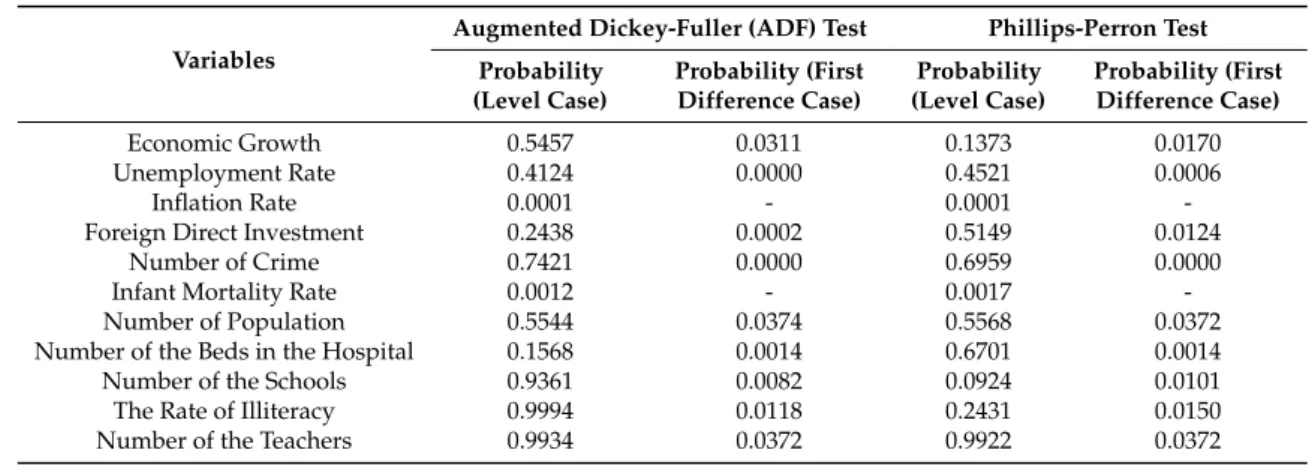
In the first step of the analysis, a control was made to understand whether independent variables are stationary or not. In this context, Augmented Dickey Fuller (ADF) [58] and Phillips-Peron (PP) [59] unit root tests were performed to reach this objective. The details of these tests were given in Table4.
Table 4.Unit Root Test Results.
Variables
Augmented Dickey-Fuller (ADF) Test Phillips-Perron Test Probability (Level Case) Probability (First Difference Case) Probability (Level Case) Probability (First Difference Case) Economic Growth 0.5457 0.0311 0.1373 0.0170 Unemployment Rate 0.4124 0.0000 0.4521 0.0006 Inflation Rate 0.0001 - 0.0001
-Foreign Direct Investment 0.2438 0.0002 0.5149 0.0124
Number of Crime 0.7421 0.0000 0.6959 0.0000
Infant Mortality Rate 0.0012 - 0.0017
-Number of Population 0.5544 0.0374 0.5568 0.0372
Number of the Beds in the Hospital 0.1568 0.0014 0.6701 0.0014
Number of the Schools 0.9361 0.0082 0.0924 0.0101
The Rate of Illiteracy 0.9994 0.0118 0.2431 0.0150
The probability values of these tests give information about the stationary properties of the variables. Considering the null hypothesis, which states the non-stationarity of the variable, if the p-values are less than 0.05, it can be concluded that the variable is stationary. As it can be seen from Table4, the probability values of only 2 independent variables (inflation rate, infant mortality rate) are less than 0.05. Therefore, it was identified that these 2 variables are stationary whereas other 9 variables are not. (Note that, [76] also found GDP variable to be I(1) as a result of PP test). Owing to this condition, the first difference of these 9 variables and level forms of the stationary (2) variables are used in the analysis.
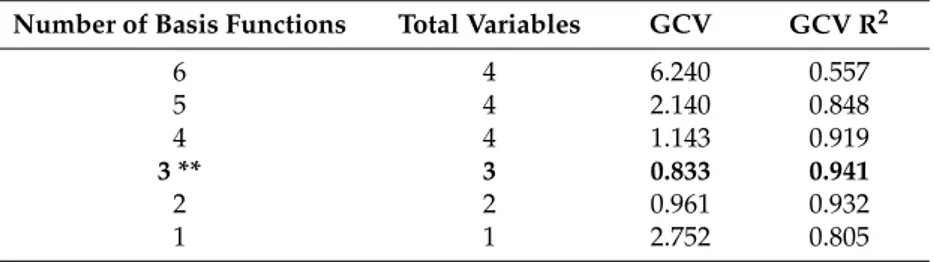
After performing unit root tests, an analysis was made by using MARS method to understand the relationship between dependent and independent variables. MARS system created 6 different models. The details of them were demonstrated in Table5.
Table 5.All Models Conducted by MARS System.
Number of Basis Functions Total Variables GCV GCV R2
6 4 6.240 0.557 5 4 2.140 0.848 4 4 1.143 0.919 3 ** 3 0.833 0.941 2 2 0.961 0.932 1 1 2.752 0.805
Notes: ** shows the chosen model.
The model, which is at the bottom of Table5, is called as starting model that has only one basis function and variable. After that, MARS system produced all different models according to the criteria embedded on the system. Therefore, the model, which is at the top of Table5, is named as the most complex model. It has 6 basis functions and 4 different variables. Next, MARS system eliminated some basis functions from the most complex model. In this process, the functions, which decreased the explanatory power of the model, were excluded by the system. In other words, basis functions, which increase GCV (error value) and decrease R2values, were eliminated. As a result of this process, the best model can be obtained. As it can be seen from Table6, the best model has 3 basis functions and 3 different variables. Additionally, it also has the lowest GCV and highest R2values. The details of the best model were explained in Table6.
Table 6.The Details of the Best Model.
Variable Coefficient p-Value
Constant 1.792 0.000 Basis Function 2 −0.020 0.000 Basis Function 3 −0.588 0.000 Basis Function 4 −0.003 0.002
F Test: 267.290 [0.000]. Adj R2: 0.976.
As it can be seen from Table6, p-values of all basis functions are less than 0.01. This means that the coefficients of these variables are statistically significant. On the other hand, the p-value of F test demonstrates that all coefficients of the model are jointly significant. In addition, adjusted R2value (0.976) is very high. This value means that independent variables can explain 97.6% of the change in the dependent variable. The basis functions in the model were detailed in Table7.
Table 7.The Details of the Basis Functions.
Basis Functions Details Coefficient
Basis Function 1 max (0, Population-8234.10) -Basis Function 2 max (0, 8234.10-Population) −0.020 Basis Function 3 max (0, Unemployment Rate-4.700) −0.588 Basis Function 4 max (0, Infant Mortality Rate-11.300) * BF1 −0.003
As it can be seen from Table7, 3 different independent variables are significant in order to explain international migration in Azerbaijan. The variable of “population” is stated in both basis functions 1 and 2. On the other side, basis function is linked to basis function 4. Because both of the coefficients of basis function 2 and 4 are negative, it was defined that there is an inverse relationship between population growth and international migration. In other words, it was identified that when population increased, people preferred to move from Azerbaijan to other countries.
Another important explanatory variable that affects international migration in Azerbaijan is unemployment rate. It is stated in basis function 3 and the coefficient of this basis function (−0.588) is negative. This situation shows that there is a negative relationship between unemployment rate and international migration. That is to say, when unemployment rate is high in Azerbaijan, people opt for moving to other countries. While considering this result, it can also be said that these people move to other countries in order to have a job.
In addition to these variables, the variable of “infant mortality rate” also influences international migration in Azerbaijan. It takes place in basis function 4 and the coefficient of this basis function is
−0.003. Therefore, it was determined that there is a negative relationship between infant mortality rate and international migration. In other words, it was identified that people do not prefer to live in Azerbaijan when there is a high infant mortality rates.
6. Discussion and Conclusions
The purpose of this study is to identify the determinants of international migration in Azerbaijan. In this context, annual data of 11 explanatory variables for the period of 1995–2015 was considered in this study. The Multivariate Adaptive Regression Spline (MARS) method was used in order to reach this objective.
First of all, we employed unit root tests to understand whether the variables are stationary or not. For this purpose, Augmented Dickey Fuller (ADF) [58] and Phillips Peron (PP) [59], unit root tests were performed. As a result of this analysis, it was defined that the probability values of only 2 independent variables (inflation rate, infant mortality rate) are less than 0.05. This means that these 2 variables are stationary while other 9 variables are not. Because of this issue, the first difference of these 9 variables and level values of other 2 variables are used in the analysis.
After unit root tests, we investigated the relationship between dependent and independent variables by using MARS method. MARS system produced 6 different models. Moreover, it was also identified that the best model has 4 basis functions and 3 different independent variables, which are statistically significant at 99% significance level. On the other side, adjusted R2value showed that independent variables can explain 97.6% of the change in the dependent variable.
According to the results of the analysis, it was determined that 3 different independent variables are significant in order to explain international migration in Azerbaijan. First of all, with respect to the economic factors, it was identified that there is a negative relationship between unemployment rate and international migration. This shows that when unemployment rate is high in Azerbaijan, people opt for moving to other countries to find a job. In other words, it can be said that better job opportunity is a significant factor for Azerbaijani people to move to another country. This result is very parallel to the thought in the literature that people more emigrate when there is unemployment problem in a city
or a country. For instance, Ahad [39], Farooq et al. [42] and Sulaimanova and Bostan [46], also reached the similar conclusions in their studies.
On the other side, regarding social factors, it was defined that there is a negative relationship between population growth and international migration. This situation means that when population increases, people prefer to move from Azerbaijan to other countries. The main reason behind this situation is that in case of population increase, people start to face some difficulties to find a job. Owing to this condition, these people have some financial loss. It can be understood that this conclusion is very appropriate the general thought in the literature. For example, this issue was also underlined in many different studies [49,50].
Another important explanatory variable that influences international migration in Azerbaijan is infant mortality rates. It was determined that people do not prefer to live in Azerbaijan when it has high infant mortality rates. The main reason is that high infant mortality rate is an important social indicator that shows the poor quality of life in a country or city. Because of this situation, it is thought in the literature that it influences people to move this country. For instance, Farooq et al. [42], also emphasized the significance of this aspect on emigration rates.
The outcomes of the research show that Azerbaijani government should focus to solve economic and social problems in order to overcome problems that may rise from international migration. In particular, after the drop of oil prices in the global energy markets the revenues of the country decreased dramatically. As a result, incomes of the population decreased relevantly and according to independent observers there is high risk of the increase of unemployment rate in the country if substantive measures are not taken. Besides, there is a high risk of brain drain from the country. In the interview with the local specialists on migration issue from one of the Baku based NGO, it was stated that however there is not accurate statistic, the number of high quality emigrants increased since 2015 and the trend has been continuing during 2017.
On the other hand, political problems in Middle East may trigger inflow of immigrants from this region to Azerbaijan. Therefore, by giving importance to those problems Azerbaijani government may minimize their negative effects. To sum up, based on the estimations results we can conclude that there is enough evidence to support hypotheses 1 and 4, set in the Theoretical Framework Section. The results for hypotheses 2, 3, 5 and 6 are not straightforward, since the related variables, i.e., inflation rate, GDP per capita, foreign direct investment, health and education level representative variables are found to be insignificant. The impact of these factors is an interesting area for future research, employing different econometric methodologies, time span and theoretical framework. While analyzing an important topic for Azerbaijan, this study aims to make a significant contribution to the literature. Nevertheless, a new study that covers many different emerging countries for this framework will also be beneficial.
Acknowledgments: We are grateful to three anonymous referees, and the editors for their comments and suggestions that have helped to improve considerably the paper; nonetheless, we are of course responsible for all errors and omissions. Finally, the views expressed in this paper are those of the authors and do not necessarily represent the views of their affiliated institutions.
Author Contributions:All authors contributed equally to all aspects of the research reported in this paper.
Conflicts of Interest:The authors declare no conflict of interest. References
1. Fisher, M.H. Migration: A World History; Oxford University Press: New York, NY, USA, 2013.
2. Yüksel, S.; Ero ˘glu, S.; Özsarı, M. An Analysis of the Reasons of Internal Migration in Turkey with Logit Method. Bus. Manag. Horizons 2016, 4, 34–45. [CrossRef]
3. Sachs, J.D. Toward an International Migration Regime. Am. Econ. Rev. 2016, 106, 451–455. [CrossRef] 4. Duru, D.N.; Trenz, H.J. From diversity to conviviality: ˙Intra-EU mobility and international migration to
5. Schmidt, K. Social Inequality and International Migration Related to Climate Stressors: The Case of Mexico. In Environmental Migration and Social Inequality; Springer International Publishing: New York, NY, USA, 2016; pp. 117–128.
6. Tishkov, V. Migration in the Countries of the Former Soviet Union. 2005. Available online:https://www.iom.int/ jahia/webdav/site/myjahiasite/shared/shared/mainsite/policy_and_research/gcim/rs/RS3.pdf(accessed on 8 January 2018).
7. Brunarska, Z.; Nestorwics, J.; Stefan, M. Internal and External Migration in Post-Soviet Space. 2014. Available online:https://depot.ceon.pl/bitstream/handle/123456789/3398/WP67125.pdf?sequence=1(accessed on 8 January 2018).
8. Mahmudlu, C. Theorizing Nationalism in Azerbaijan, under the Editorship of Mammadli, Braux and Mahmudlu, Azerbaijani and Beyond: Perspectives on the Construction of National Identity; Verlag Dr. Köster: Berlin, Germany, 2017; pp. 129–157.
9. Mahmudov, C. Azerbaijani Diaspora Organizations in Sankt Petersburg. Azerb. Azerb. 2007, 5, 231–239. 10. Rowland, R. National and Regional Population Trends in Azerbaijan. Eurasian Geogr. Econ. 2013, 45, 285–315.
[CrossRef]
11. Aliyev, I. Rural-Urban Labor Migration in Azerbaijan. Master’s Thesis, Central European University, Budapest, Hungary, 2008.
12. Braux, A. Moscou-Caucase: Migrations et Diasporas Dans L’espace Post-Soviétique; Pétra Éditions: Paris, France, 2015. 13. Mahmudlu, C. Rusiyada ya¸sayan azərbaycanlıların etnik iqtisadi ¸səbəkələri. In Etnoqrafiyadan Etnologiyaya Do˘gru: Azərbaycanda Müasir Etnoloji Tədqiqtlar; Alia˘ga, M.R., Ed.; Khazar University Press: Bakı, Azerbaijan, 2013. 14. Mahmudov, C. Rusiyada ya¸sayan azərbaycanlılar arasında etnik identiklik məsələləri. J. Qafqaz Univ. 2007,
20, 62–71.
15. Rumyantsov, S. Immigrants in Azerbaijan: Current Situation and Prospects of (Re) integration Policy. Int. Migr. 2014, 52, 82–94. [CrossRef]
16. Dermendzhieva, Z. Emigration from the South Caucasus: Who goes abroad and what are the economic implications? Post-Communist Econ. 2011, 23, 377–398. [CrossRef]
17. Simmel, G. Simmel on Culture; Frisby, D., Featherstone, M., Eds.; Sage: London, UK, 1997. 18. Sheller, M.; Urry, J. The New Mobility Paradigm. Environ. Plan. A 2006, 38, 207–226. [CrossRef] 19. Strathern, M. Partial Connections; Rowman and Littlefield: Savage, MD, USA, 1991.
20. Maurer, B. Recharting the Caribbean: Land, Law and Citizenship in the British Virgin Islands; University of Michigan Press: Ann Arbor, MI, USA, 1997.
21. Sheller, M. Automotive emotions: Feeling the car. Theory Cult. Soc. 2004, 21, 22–242. [CrossRef] 22. Edensor, T. National Identities in Popular Culture; Berg: Oxford, UK, 2002.
23. Vogler, M.; Rotte, R. Determinants of International Migration: Empirical Evidence for Migration from Developing Countries to German. 1998. Available online:http://ssrn.com/abstract=166340(accessed on 6 January 2018).
24. Mayda, A.M. International Migration: A Panel Data Analysis of Economic and Non-Economic Determinants. IZA Discussion Paper No. 1590. 2005. Available online:http://ssrn.com/abstract=725441(accessed on 6 January 2018).
25. VanWey, L.K. Land ownership as a determinant of international and internal migration in Mexico and internal migration in Thailand. Int. Migr. Rev. 2005, 39, 141–172. [CrossRef]
26. Mayda, A.M. International migration: A Panel Data Analysis of The Determinants of Bilateral Flows. J. Popul. Econ. 2010, 23, 1249–1274. [CrossRef]
27. Balderas, U.J.; Greenwood, J.M. From Europe to the Americas: A comparative panel-data analysis of migration to Argentina, Brazil, and the United States, 1870–1910. J. Popul. Econ. 2010, 23, 1301–1318. [CrossRef]
28. Beyene, B.M. Determinants of Internal and International Migration in Ethiopia. Memorandum 2011, 24, 1–48. 29. Pânzaru, C. Determinants of International Migration: A Panel Data Analysis. J. Pol. L 2013, 6, 142. [CrossRef] 30. Freguglia, R.S.; Gonçalves, E.; Silva, E.R. Composition and determinants of the skilled out-migration in the Brazilian formal labour market: A panel data analysis from 1995 to 2006. EconomiA 2014, 15, 100–117. [CrossRef]
31. Campaniello, N. The causal effect of trade on migration: Evidence from countries of the Euro-Mediterranean partnership. Labour Econ. 2014, 30, 223–233. [CrossRef]
32. Ushakov, D.S.; Kozlova, E.V. International migration as a factor of economic growth under globalizing. Aktualniye Problemi Ekonomiki (APE) 2015, 1, 391–397.
33. Jennissen, R. Economic Determinants of Net International Migration in Western Europe. Eur. J. Popul. Rev. Eur. Démogr. 2003, 19, 171–198. [CrossRef]
34. Acupan, A.; Angelito, B.; Agbola, F.W. On The Determinants of International Labour Migration in The Philippines. In Singapore Economics Review Conference; Meritus Mandarin Singapore: Singapore, 2007. 35. Deluna, R.; Darius, A. Analysis of Pull-Factor Determinants of Filipino International Migration. 2014.
Available online:https://mpra.ub.uni-muenchen.de/60156/(accessed on 6 January 2018).
36. Etzo, I. Determinants of ˙Interregional Migration in Italy: A Panel Data Analysis. 2008. Available online:
https://papers.ssrn.com/sol3/papers.cfm?abstract_id=1135165(accessed on 6 January 2018).
37. Agbola, F.W.; Acupan, A.B. An Empirical Analysis of International Labour Migration in the Philippines. Econ. Syst. 2010, 34, 386–396. [CrossRef]
38. Darkwah, S.; Verter, N. Determinants of International Migration: The Nigerian Experience. Acta Univ. Agric. Silvic. Mendel. Brun. 2014, 62, 321–327. [CrossRef]
39. Ahad, M. The Determinants of International Migration in Pakistan: New Evidence from Combined Cointegration, Causality and Innovative Accounting Approach. Econ. Res. Guard. 2015, 5, 159–175. 40. Brücker, H.; Siliverstovs, B. On the estimation and forecasting of international migration: How relevant is
heterogeneity across countries? Empir. Econ. 2006, 31, 735–754. [CrossRef]
41. Carlos, R.D. On the Determinants of International Migration in the Philippines: An Empirical Analysis. Int. Migr. Rev. 2002, 36, 81–102. [CrossRef]
42. Farooq, M.; Tariq, S.; Ghulzar, F.; Mirza, F.I.; Riaz, F. Determinants of International Migration in Pakistan. Mediterr. J. Soc. Sci. 2014, 5, 2028–2032. [CrossRef]
43. Gregoriou, P.; Kontolemis, Z.; Matsi, M. Immigration in Cyprus: An analysis of the determinants. Cyprus Econ. Policy Rev. 2010, 4, 63–88.
44. Pedersen, P.J.; Pytlikova, M.; Smith, N. Selection and Network Effects? Migration Flows into OECD Countries 1990–2000. Eur. Econ. Rev. 2008, 52, 1160–1186. [CrossRef]
45. Sprenger, E. The Determinants of International Migration in the European Union: An Empirical Analysis. Institute for East and South-East European Studies. 2013. Available online: https://www.dokumente.ios-regensburg.de/publikationen/wp/wp_ios_325.pdf(accessed on 6 January 2018).
46. Sulaimanova, B.; Bostan, A. International migration: A panel data analysis of the determinants of emigration from Tajikistan and Kyrgyzstan. Eurasian J. Bus. Econ. 2014, 7, 1–9.
47. Naudé, W. The Determinants of Migration from Sub-Saharan African Countries. J. Afr. Econ. 2010, 19, 330–356. [CrossRef]
48. Yang, X.; Guo, F. Gender differences in determinants of temporary labor migration in China: A multilevel analysis. Int. Migr. Rev. 1999, 33, 929–953. [CrossRef] [PubMed]
49. Kim, K.; Cohen, J.E. Determinants of International Migration Flows to and from Industrialized Countries: A Panel Data Approach Beyond Gravity. Int. Migr. Rev. 2010, 44, 899–932. [CrossRef]
50. White, R. Is cultural distance a determinant of international migration flows? Evidence from Denmark, Germany, and the Netherlands. Econ. Bull. 2013, 33, 2156–2168.
51. Beissinger, M.R. Nationalist Mobilization and the Collapse of the Soviet State; Cambridge University Press: Hong Kong, China, 2002.
52. Abilov, S.H.; Isayev, I. The Consequences of the Nagorno-Karabakh War for Azerbaijan and the Undeniable Reality of Khojaly Massacre: A View from Azerbaijan. Pol. Political Sci. Yearb. 2016, 45, 291–303. [CrossRef] 53. Mahmudlu, C.; Ahmedov, A. High Degree Autonomy Status for Nagorno Karabakh and its Possible Role in
the Solution of the Conflict. J. Qafqaz Univ. 2014, 2, 115–123.
54. Dədəyev, B.; Mahmudlu, C.; Abilov, ¸S. Qaraba˘g 99 Sualda; CBS: Bakı, Azerbaijan, 2014; p. 365.
55. The State Statistical Committee of the Republic of Azerbaijan (SSC). 2016. Available online:https://www. stat.gov.az/source/demoqraphy/(accessed on 6 January 2018).
56. The State Statistical Comitee of Azerbaijan. 2016. Available online:https://www.stat.gov.az/menu/13/
(accessed on 6 January 2018).
57. World Bank. Countries and Economies. In The World Bank Data; World Bank: Washington, DC, USA, 2016. 58. Dickey, D.; Fuller, W. Likelihood ratio statistics for autoregressive time series with a unit root. Econometrica
59. Phillips, P.C.B.; Perron, P. Testing for a Unit Root in Time Series Regression. Biometrika 1988, 75, 335–346. [CrossRef]
60. Lewer, J.J.; Van den Berg, H. A gravity model of immigration. Econ. Lett. 2008, 99, 164–167. [CrossRef] 61. Beine, M.; Parsons, R.C. Climatic Factors as Determinants of International Migration: Redux (No. 16-11).
Scand. J. Econ. 2015, 117, 723–767. [CrossRef]
62. Friedman, J. Multivariate Adaptive Regression Splines. Ann. Stat. 1991, 19, 1–141. [CrossRef]
63. Tunay, K.B. Bankacılık Krizlerinin Erken Uyarı Sinyalleri: Türkiye ˙Için Bir Model Analizi. BDDK Bank. Finans. Piyas. Derg. 2010, 4, 9–46.
64. Sephton, P. Forecasting Regressions: Can We Do Better on MARS? Fed. Reserve Bank Louis Rev. 2001, 1, 39–49. 65. Bliss, C.I. The Method of Probits. Science 1934, 79, 38–39. [CrossRef] [PubMed]
66. Bolder, J.; ve Rubin, T. Optimization in a Simulation Setting: Use of Function Approximation in Debt Strategy Analysis. SSRN 2007, 1–92. [CrossRef]
67. Muzır, E. Basel II Düzenlemeleri Do˘grultusunda Kredi Riski Analizi ve Ölçümü: Geleneksel Ekonometrik Harris Modellerin Yapay Sinir A˘gları ve MARS Modelleriyle Kar¸sıla¸stırılmasına Yönelik Ampirik Bir Çalı¸sma. Dalı Doktora Tezi; ˙Istanbul Üniversitesi Sosyal Bilimler Enstitüsü ˙I¸sletme Anabilim: Istanbul, Turkey, 2011.
68. Cox, D.R. The regression analysis of binary sequences (with discussion). J. R. Stat. Soc. B. 1958, 20, 215–242. 69. Miguéis, V.L.; Camanho, A.; e Cunha, J.F. Customer attrition in retailing: An application of multivariate
adaptive regression splines. Expert Syst. Appl. 2013, 40, 6225–6232. [CrossRef]
70. Yüksel, S.; Zengin, S. Leading Indicators of 2008 Global Crisis: An Analysis with Logit and Mars Methods. Finans. Ara¸stırmalar Çalı¸smalar Derg. 2016, 8, 495–518. [CrossRef]
71. Oktar, S.; Yüksel, S. 1998 Yılında Rusya’da Ya¸sanan Bankacılık Krizi ve Öncü Göstergeleri. ˙Iktis. ˙Idari Bilim. Derg. 2015, 37, 327–340. [CrossRef]
72. Tunay, K.B. Türkiye’de Durgunlukların MARS Yöntemi ile Tahmini ve Kestirimi. Marmara Üniv. ˙I.˙I.B.F. Derg.
2011, 30, 71–91.
73. Yüksel, S. Bankaların Takipteki Krediler Oranını Belirleyen Faktörler: Türkiye ˙Için Bir Model Önerisi. Bankacılar Derg. 2016, 98, 41–56.
74. Tunay, K.B. Türkiye’de Paranın Gelir Dola¸sım Hızlarının MARS Yöntemiyle Tahmini. ODTÜ Geli¸s. Derg.
2001, 28, 431–454.
75. Altun, E.; Turkan, S. Analysis of Better Life Index of OECD Countries with Multivariate Adaptive Regression Splines Model. Int. J. Stat. Econ. 2016, 17, 62–70.
76. Mikayilov, J.; Shukurov, V.; Mukhtarov, S.; Yusifov, S. Does urbanization boost pollution from transport? Acta Univ. Agric. Silvic. Mendel. Brun. 2017, 65, 1709–1718. [CrossRef]
© 2018 by the authors. Licensee MDPI, Basel, Switzerland. This article is an open access article distributed under the terms and conditions of the Creative Commons Attribution (CC BY) license (http://creativecommons.org/licenses/by/4.0/).