CAPITAL STRUCTURE DETERMINANTS OF TURKISH
SMEs IN MANUFACTURING INDUSTRY
A Master’s Thesis
By
UĞUR CAKOVA
Department of
Management
Đhsan Doğramacı Bilkent University
Ankara
CAPITAL STRUCTURE DETERMINANTS OF TURKISH SMEs
IN MANUFACTURING INDUSTRY
Graduate School of Economics and Social Sciences
of
Đhsan Doğramacı Bilkent University
by
UĞUR CAKOVA
In Partial Fulfilment of the Requirements for the Degree of
MASTER OF SCIENCE
in
THE DEPARTMENT OF
MANAGEMENT
ĐHSAN DOĞRAMACI BĐLKENT UNIVERSITY
ANKARA
I certify that I have read this thesis and have found that it is fully adequate, in scope and in quality, as a thesis for the degree of Master of Science in Management.
--- Assoc. Prof. Zeynep Önder Supervisor
I certify that I have read this thesis and have found that it is fully adequate, in scope and in quality, as a thesis for the degree of Master of Science in Management.
--- Assoc. Prof. Süheyla Özyıldırım Examining Committee Member
I certify that I have read this thesis and have found that it is fully adequate, in scope and in quality, as a thesis for the degree of Master of Science in Management.
--- Prof. Nuray Güner
Examining Committee Member
Approval of the Graduate School of Economics and Social Sciences
--- Prof. Erdal Erel
iii
ABSTRACT
CAPITAL STRUCTURE DETERMINANTS OF TURKISH SMEs IN MANUFACTURING INDUSTRY
Cakova, Uğur
M.S., Department of Management Supervisor: Assoc. Prof. Zeynep Önder
August 2011
This thesis investigates the determinants of capital structure of small and medium sized enterprises (SMEs) from manufacturing sector in Turkey. Hypotheses about leverage decisions and debt maturity choices of firms are formulated based on the capital structure theories, mainly trade-off theory and pecking order theory. These hypotheses are tested using fixed effects model with unbalanced panel data set of 44,029 firm-year observations over the period between 1998 and 2008. I find that capital structure decisions of Turkish SMEs are in line with pecking order predictions. The results indicate that larger firms have higher leverage ratios; SMEs use their tangible assets to obtain long term debt; profits are used to decrease debt levels, particularly short term debt; firms with high growth opportunities prefer to finance their future growth with long term debt; rapidly growing firms use more short term debt to finance their growth. In general, SMEs are found to decrease their leverage ratio during the periods of economic growth. Lastly, although small and medium sized firms have significantly different debt ratios over the sample period, results are homogenous across both individual samples of small firms and medium firms.
iv
ÖZET
KOBĐ’LERDE SERMAYE YAPISINI ETLĐYEN FAKTÖRLERĐN
ĐMALAT SANAYĐĐNDE SINANMASI
Cakova, Uğur
Yüksek Lisans, Đşletme Bölümü Tez Yöneticisi: Doç. Dr. Zeynep Önder
Ağustos 2011
Bu tez, Türkiye’de imalat sektöründe yer alan Küçük ve Orta Büyüklükteki Đşletmelerin (KOBĐ) sermaye yapısını etkileyen faktörleri araştırmaktadır. Şirketlerin borçlanma kararları ile ilgili hipotezler, dengeleme teorisi ve finansal hiyeraşi teorisi gibi sermaye yapısı teorileri incelenerek geliştirilmiştir. Bu hipotezler, 1998-2008 dönemini kapsayan ve 44,029 gözlemden oluşan panel veri üzerinde, sabit etkiler modeli kullanılarak sınanmıştır. Türk KOBĐlerinin sermaye yapısı kararları finansal hiyeraşi teorisini desteklemektedir. Sonuçlara göre daha büyük firmalar daha yüksek borç oranına sahip olmakta; KOBĐler maddi duran varlıklarını uzun vadeli borç sağlamak için kullanmakta; elde edilen kar öncelikle kısa vadeli borç olmak üzere borç oranları azaltılmak için kullanılmakta; yüksek büyüme olanaklarına sahip firmalar gelecekteki büyümelerini uzun vadeli borç kullanarak, hızlı büyüyen firmalar ise büyümelerini kısa vadeli borç kullanarak finanse etmektedir. Ekonomik büyüme gerçekleşen dönemlerde firmaların borç oranlarını azalttıkları gözlemlenmiştir. Son olarak, küçük ve orta ölçekteki firmaların borç oranları incelenen dönemde anlamlı bir biçimde farklı olsa da, elde edilen sonuçlar iki tür firma için bir farklılık göstermemektedir.
Anahtar Kelimeler: Dengeleme teorisi, finansal hiyeraşi teorisi, sermaye yapısı, KOBĐ
v
ACKNOWLEDGMENTS
First of all, I would like to express my deepest gratitude to my supervisor Assoc. Prof. Zeynep Önder for her valuable guidance and support during my graduate study. She has supported and motivated me with everlasting interest, which enabled me to complete my thesis.
I am also grateful to Assoc. Prof. Süheyla Özyıldırım, for motivating me in my academic studies and for appreciating my work as her teaching and research assistant. Moreover, I would like to thank to Prof. Nuray Güner for accepting to read my thesis and for her invaluable suggestions.
I am thankful to Central Bank of The Republic of Turkey for letting me to access their valuable database.
I am also lucky to have Gökçe Akın, Korhan Aras and Ömer Yılmaz as three of my best friends who are always ready to listen to me, encourage me and come up instant solutions all the time. I am also indebted to my friend Ezgi Kırdök for her incredible support and encouragement. Additionally, I am thankful to Mert Hakan Hekimoğlu, Alper Küçükkömürcü, Gül Erkekli, Mustafa Onan, Naime Geredeli Usul, and Işıl Sevilay Yılmaz for their invaluable support and friendship during my graduate study.
vi TABLE OF CONTENTS ABSTRACT ... iii ÖZET... iv ACKNOWLEDGMENTS ... v TABLE OF CONTENTS ... vi
LIST OF TABLES ... viii
LIST OF FIGURES ... ix
CHAPTER 1: INTRODUCTION ... 1
CHAPTER 2: LITERATURE REVIEW ... 8
2.1 Capital Structure Theories ... 8
2.1.1 The Modigliani-Miller Theorem... 8
2.1.2 Trade-off Theory ... 9
2.1.3 Pecking order Theory ... 12
2.2 Capital Structure of SMEs in Several Countries ... 14
2.3 Capital Structure of Turkish SMEs ... 22
CHAPTER 3: HYPOTHESES ... 25 3.1 Size ... 26 3.2 Asset Structure ... 29 3.3 Profitability ... 32 3.4 Growth Opportunities ... 33 3.5 Growth ... 36
vii
CHAPTER 4: DATA, VARIABLES AND ECONOMETRIC MODEL ... 38
4.1 Data ... 38
4.1.1 Sample Selection ... 40
4.2 Variables ... 44
4.3 Econometric Model ... 54
CHAPTER 5: EMPIRICAL RESULTS ... 59
5.1 Results with all SMEs ... 59
5.1.1 Firm and Year Fixed Effects... 59
5.1.2 Sector and Year Fixed Effects ... 69
5.2 Small Firms’ and Medium Firms’ Results ... 71
5.3 Further Estimations ... 76
CHAPTER 6: CONCLUSION ... 81
viii
LIST OF TABLES
1. Distribution of firms by year and sector ... 42
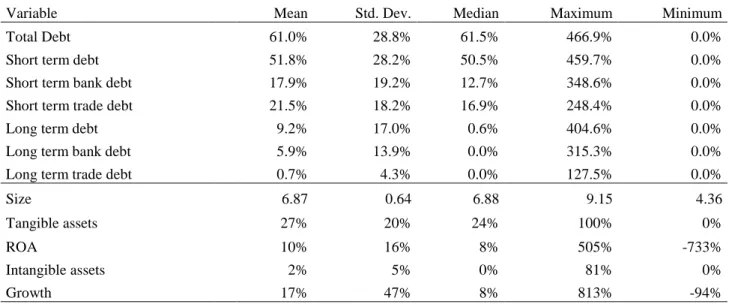
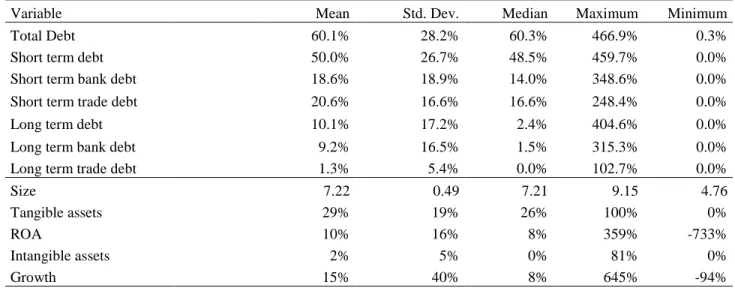
2. Descriptive Statistics of Variables Used in the Analysis for All SMEs ... 49
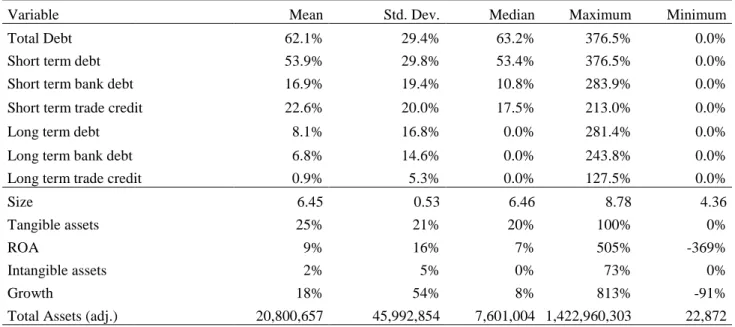
3. Descriptive Statistics of Variables Used in the Analysis for Small Firms 50 4. Descriptive Statistics of Variables Used in the Analysis for Medium aaa Firms ... 51
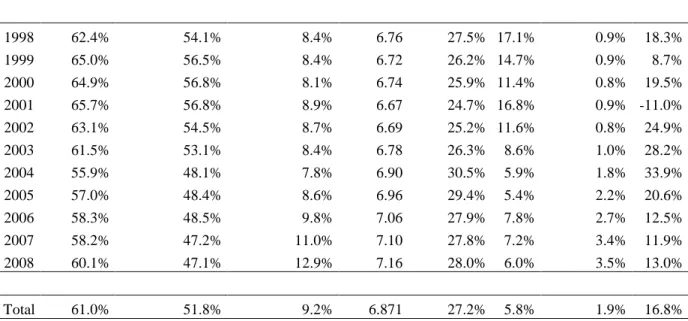
5. Mean values of Variables on a Yearly Basis for all SMEs ... 52
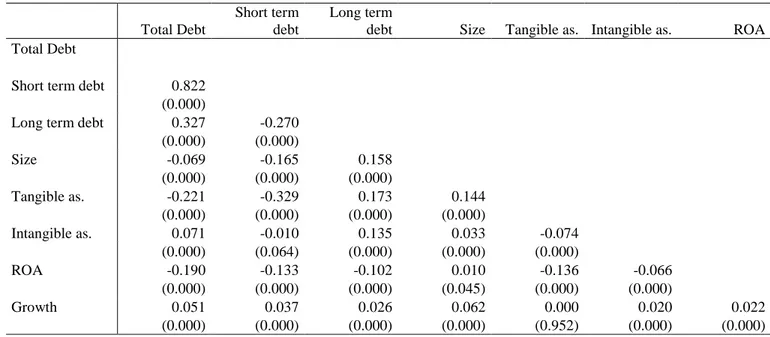
6. Correlation Coefficients between Variables ... 53
7. Hausman test results ... 55
8. T-test for testing equality of means of debt ratios for small sized and aaaaaaa medium sized firms ... 58
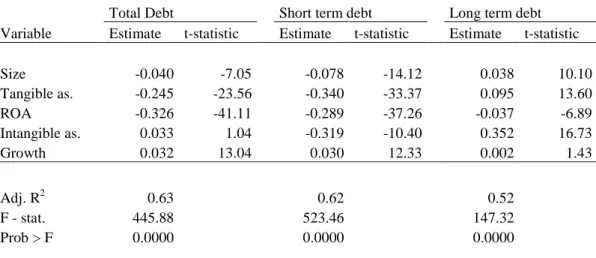
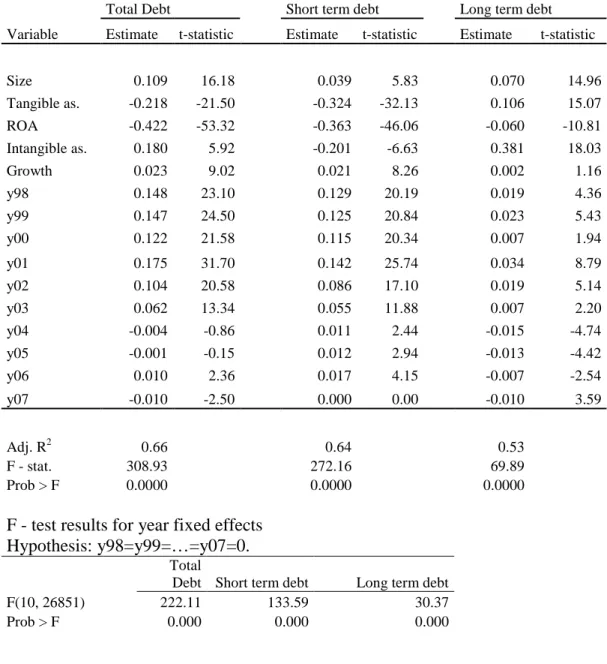
9. The results of the Fixed effects Model for all SMEs ... 60
10. Results of two-way fixed effects (sector and year) model ... 70
11. The results with firm and year fixed effects for small and medium sized a a firms ... 72
12. Predictions of hypotheses and observed results ... 75
13. Results with workers in place of size ... 76
14. Results having tax as an additional variable ... 77
15. Regression results having total bank debt as dependent variable ... 79
16. Regression results having short term bank debt and short term trade credit a as dependent variables ... 80
ix
LIST OF FIGURES
1. The Trade-off Theory of Capital Structure ... 11 2. Coefficients of Year Dummy Variables and Change in GDP ... 68
1
CHAPTER 1
INTRODUCTION
Deciding on capital structure is very critical for every firm. Most of the empirical studies investigating capital structure decisions examine firms that are generally publicly traded. Zingales (2000) supports this view as follows, “Empirically, the emphasis on large companies has led us to ignore (or study less than necessary) the rest of the universe: the young and small firms, who do not have access to public markets”.
Small and medium sized firms are very important for the economy. European Commission (2009) report states that more than 99.8% of European businesses are produced by SMEs in 2008 and they provide more than two-third of private sector employments. Moreover, SMEs contribute to more than half of total value added created by businesses in the European Union (EU). In other words, they are the main source of employment and they have a very important role in economical growth.
2
Turkey is similar to European countries. According to European Commission (2009), in 2008, 99.9% of enterprises are considered as SMEs and their contribution to the overall economy is 51% in value added terms, which is lower than EU-27 average (57.9%). On the other hand, the contribution of Turkish SMEs to total employment is 81.7%, which is much higher than the European average (67.4%).
SMEs do not need special attention just because they constitute an important portion in the economy. They have also unique characteristics that differentiate them from larger ones. SME owners’ desire for control and more severe information asymmetry problems are the two main factors that lie behind these differences (Bhaird and Lucey, 2010). Furthermore, SMEs are much more fragile than large companies. 20% of newly founded SMEs are closed in a year and higher portion of them closed during their second year (DPT, 2006). Therefore, it is very essential to identify the factors that influence the financial structure of small and medium sized companies.
The capital structure of SMEs has been investigated for several countries, including Australia (Romano et al., 2000; Cassar and Holmes, 2003), Belgium (Heyman et al., 2008), Germany (Van der Wijst and Thurik, 1993), Ireland (Bhaird and Lucey, 2010), the Netherlands (Degryse et al., 2010), Poland (Klapper et al., 2006), Portugal (Pindado et al., 2006), Spain (Sogorb-Mira, 2005), the U.K. (Chittenden et al., 1996; Michaelas et al.,1999). In general, they find that
3
the information asymmetry costs and agency costs are the main factors that influence the financing decisions of SMEs. These studies indicate that the most influential variables on capital structures of SMEs are found as size, profitability, growth rate, asset tangibility, tax rate and growth opportunities.
Since previous studies mostly applied on developed countries, discovering financial determinants of SMEs in a developing country like Turkey is particularly interesting. There exist limited number of capital structure studies in Turkey and most of them examine listed and big companies that may not face with asymmetric information problems in financing. Korkmaz et al. (2007) investigate capital structure of SMEs whose stocks are traded on Istanbul Stock Exchange. Korkmaz et al. (2009) examine determinants of capital structure of 16 listed companies from automotive and auto parts industry. Doğukanlı and Acaravcı (2004), Akkaya and Güler (2008) and Yıldız et al. (2009) test capital structure determinants of listed manufacturing companies. Studies in Turkey are also in line with studies conducted in other countries.
In this thesis, I empirically investigate the factors that affect financial structures of Turkish SMEs operating in manufacturing industry. I focus on their leverage decisions as well as their debt maturity choices. I especially work on manufacturing sector because it provides 32% of the employment in Turkey and 99.63% of enterprises in manufacturing sector is SMEs. Moreover, on average,
4
54% of total investment incentives given by government are utilized by firms operating in manufacturing sector.
My dataset contains 44,029 firm-year observations. It covers 14 sub-sectors of manufacturing industry over eleven year period between 1998 and 2008. Although only firms from manufacturing sector are analyzed in this study, the sample is more comprehensive than the previous studies. I test predictions of trade-off theory and pecking order theory on the data. I also analyze small firms (46% of total observations) and medium firms (54% of total observations) separately. Furthermore, since previous papers like Van der Wijst and Thurik (1993), Michaelas et al. (1999), Degryse et al. (2010) find that there exist significant differences in the capital structures of SMEs across industries, I analyze whether there exist any differences in capital structures of companies operating in several sub-industries within manufacturing sector. Whether firm characteristics or sub-industry differences are more important in determining capital structure is also examined. According to World Competitiveness Yearbook, Turkeys’ competitiveness exhibits a downward trend between 2001 and 2004 and is able to observe its ranking in 2001 again in 2005 (DPT, 2006). Since SMEs are fragile companies, changes in economy generally have amplified results over them. Considering the economically instable nature of Turkey, whether capital structures of SMEs change over years is also investigated.
5
Two way fixed effects model is estimated to explain total debt, short term debt and long term debt ratios of SMEs. The first set of regressions is composed of firm and year effects and the second set of regressions estimate sector and year fixed effects. The results confirm that capital structure decisions of Turkish SMEs are consistent with pecking order theory. It is found that larger firms have higher leverage. This positive relation between size and leverage is found to be greater for long term debt. Moreover, SMEs use collaterals to obtain especially long term debt. SMEs with higher amount of collaterals switch from short term debt to long term debt. The maturity matching principle is also supported since firms match duration of their assets with the duration of their liabilities. SMEs with higher profitability ratios use less debt. In addition, SMEs seems to use profits to reduce especially short term debt. SMEs with higher growth opportunities have higher leverage. Just like collaterals, SMEs seem to use their growth opportunities to obtain long term debt and decrease their short term debt levels. However, current growth is found to increase debt levels of all kind of maturities. The results suggest that fast growing firms are likely to have insufficient funds to finance their growth internally and use short term debt as first resort since it may be harder to obtain long term debt.
Regarding the year effects, the SMEs have debt levels higher between 1998 and 2001. The year of banking crisis, 2001, is the year that SMEs are found to have the highest debt ratio. After 2001, a substantial decrease in debt ratios is observed with economic improvements in the country. Moreover, I observe a negative
6
relation between debt ratios and economic conditions. That is, firms decrease their average debt ratios as economic conditions improve. Firm characteristics are found to affect capital structure of SMEs more than the characteristics of their sub-sectors. Across 14 sub-sectors examined, only 4 of them have significantly different total debt ratios than others. The food products, beverages and tobacco sub-sector is found to have the highest debt while manufacture of pulp, paper and paper products publishing and printing sub-sector has the lowest ratio.
Although findings are valid for both small sized firms and medium sized firms, their separate analysis shows that there exist differences in the magnitudes of the coefficients. Medium sized firms are found to have relatively more long term debt ratio and less short term debt ratio. This finding can be explained as follows: smaller firms may have more problems in obtaining long term debt or firms may use more long term debt as they get larger. The results suggest that small firms rely more on collaterals since they have relatively higher information asymmetry problems. It is also found that medium firms are more profitable and have more opportunities to decrease their debt ratios by using their profits. Furthermore, small firms are more likely to have insufficient funds to finance their growth since growth is found to have a greater impact on small firms.
The remainder of the thesis is organized as follows. Chapter 2 provides a summary of major capital structure theories and reviews the literature about the determinants of capital structures of SMEs in several countries. Chapter 3
7
introduces the hypotheses tested in this thesis. In Chapter 4, data, variables and empirical model are presented. I discuss empirical results in Chapter 5. Finally, I conclude in Chapter 6.
8
CHAPTER 2
LITERATURE REVIEW
2.1 Capital Structure Theories
The choices of firms regarding their capital structure and what is the optimal capital structure are long lasting questions that researchers are looking for an answer. In 1955, Weston underline that “there can be no science of business finance since experts cannot arrive at unique answers”. There are mainly three capital structure theories in the literature that provides different answers for the optimal debt usage. In this chapter, first, I briefly explain these theories. Then, I present empirical evidence regarding to the determinants of capital structures of small and medium sized enterprises (SMEs) in different countries.
2.1.1 The Modigliani-Miller Theorem
Modigliani-Miller (MM) irrelevance theorem is a cornerstone in capital structure literature. Although Williams (1938) presents similar ideas, he does not provide
9
an arbitrage based proof. So, MM (1958) is considered to be the first accepted capital structure theory.
The first proposition of MM (1958) states that, under perfect market conditions (in efficient markets with no taxes, no bankruptcy costs, and no asymmetric information), how a firm is financed has no effect on its value. The value of the company is determined by the amount of cash flows coming from investments and other activities, and the risk associated with these cash flows. The debt-to-equity is used only to split the cash flows between equity holders and lenders. Since in a world with no tax, these cash flows are independent from the financing decisions, capital structure has no effect on the firm’s value. Hence, the MM theorem is also called as the capital structure irrelevance principle.
Even though the MM theorem only holds in their theoretical world with unrealistic assumptions, it is still very important because they attracted and stimulated many researchers to develop new theories on capital structure.
2.1.2 Trade-off Theory
The MM (1958) model is criticized, mainly because it has very unrealistic assumptions and fails when taxes, bankruptcy costs, or asymmetric information were introduced. In their later paper, MM (1963) introduced taxes to their model.
10
They find that firm value is positively related with the amount of debt used. In other words, it is specified as a linear function of debt-equity ratio and maximized with 100% usage of debt financing (MM, 1963). In this model, they assume that there is no bankruptcy cost. However, there exists an offsetting cost of debt which avoids this extreme choice. There is an increasing stress of bankruptcy with increasing usage of debt. Therefore, bankruptcy is the balancing factor for the extreme situation shown by MM in 1963.
Myers (1984) modified the MM (1963) model and developed the ‘static trade-off’ theory. It claims that there is a trade-off between benefits of debt usage and the financial distress, which occurred because of the increase in the likelihood of bankruptcy with the higher usage of debt. According to Myers’ (1984) trade-off theory, firms have their target debt levels and make their capital structure decisions accordingly.
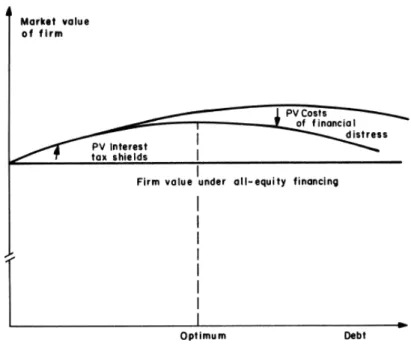
Below, Figure 1 shows a graphical representation of the trade-off theory. According to this theory, as ratio of debt in the capital structure increases, first, the value of firm increases because of the increase in the present value of marginal tax shield. However, at higher levels of debt ratio, the increase in the present value of cost of financial distress will offset the increase in the marginal benefits and as debt ratio increases, the value of firm will decline. This allows the firms to optimize their debt levels.
11
Figure 1 - The Trade-off Theory of Capital Structure
Source: Myers (1984)
The assumptions of the trade-off theory can be stated as follows: Investors are risk-neutral; they are obliged to pay a personal tax rate on income from bonds while firms are required to pay a constant marginal tax on their corporate income; corporate and personal taxes are based on the end of period wealth; dividends and capital gains are also taxed at a constant rate; there exist non-debt tax shields which decrease firms’ tax liability; firms which are not able to pay their debts faced with a financial distress cost which reduces the firms’ value.
Bradley et al. (1984) summarizes the main predictions of trade-off theory as follows:
12
2) Optimal debt level decreases with increasing non-debt tax shields. 3) Optimal debt level increases with increasing personal tax rate on equity
income.
4) At the optimal debt level, an increase in the marginal bondholder tax rate decreases the optimal debt level.
2.1.3 Pecking order Theory
In addition to trade-off theory, another theory that has a big impact on the literature is pecking order theory. Pecking order theory was initially suggested by Donaldson (1961) and modified by Myers and Majluf (1984), based on the works about agency theory of Jensen and Meckling (1976), adverse selection model in Myers and Majluf (1984) and signaling theory of Ross (1977).
Agency theory is emerged from moral hazard and conflict of interest between principal and agent. It suggests that agents of a company have a tendency to take actions which are not best for the company because the benefits are higher than costs as such costs are shared between shareholders.
Adverse selection is based on the asymmetric information between buyers and sellers. When buyers and sellers are able to access different information, “bad” products are more likely to be selected. In a setup like Modigliani and Miller
13
(1958), where efficient market hypothesis holds and all of the members of the market has a chance to reach same information under equal conditions, there would not exist any problem related with asymmetric information and all sources would be equally preferable. However, in real world, because of the asymmetric information problems, firms prefer to obtain financing from sources where there exist lowest amount of information asymmetry problems.
The main idea behind the pecking order theory is that, only the owner of the company knows the true value of the firm and its growth opportunities. However, an outsider can only guess these values. Therefore, people react suspiciously when owner of a firm tries to sell equity. Normally, owner of an overvalued company prefers to sell equity while owner of an undervalued company uses equity financing only as a last resort. Therefore, the announcement of an equity issue will decrease the value of shares of a company (Ross, 1977). On the other hand, using retained earnings or riskless debt will not cause any change in the value of the shares.
Myers (1984) states that a firm follows a pecking (preference) order if it prefers internal financing (retained earnings) to external financing and if it prefers debt to equity at external financing. Myers (1984) also indicates that if it is possible, using a riskless debt should be equally preferable as internal financing. However, if debt is available but risky, it should be placed somewhere between retained earnings and equity which actually creates the pecking order.
14
2.2 Capital Structure of SMEs in Several Countries
Ang (1991) indicates that theories of capital structure were not developed with thinking SMEs in first place so they may not be directly appropriate for them. However, the validity of trade-off theory and pecking order theory for SMEs are tested empirically in many countries. In addition to size, there are two main factors that differentiate SMEs from large firms (Bhaird and Lucey, 2010). The first one is the SME owners’ desire for keeping their independence and control. The second one is the fact that SMEs are having more severe information asymmetry problems in financing decisions. These differences affect capital structure decisions of SMEs mainly in the following ways: In order to keep control, SME managers tend to reject external finance, even for projects with positive net present values (Holmes and Kent, 1991). Also, because of information asymmetry problems, lenders are unwilling to provide finance to SMEs. For example, Berger and Udell (1995) show that, small and young firms have shorter banking relationships, pay higher interest rates and are more likely to pledge collateral to borrow money.
Hughes (1997) compares small businesses with large ones and identifies the following differences:
i. SMEs have lower fixed assets - to - total asset ratios; ii. SMEs have higher proportion of trade debt to total assets;
15
iii. SMEs have much higher proportion of current liabilities to total assets; iv. SMEs are reliant on retained profits to finance their investments;
v. SMEs are financially more risky.
Hall et al. (2004) mention that there exist differences in factors that affect capital structures of SMEs across countries. Several studies examine the factors affecting the capital structure of SMEs in several countries. Van der Wijst and Thurik (1993) make a panel data analysis on German small firms operating in the retail sector and work on average financial data of 27 different shop types for a period of 24 years. They find that tangible assets, inventory turnover and return on investment have significant effects. Although inventory turnover is not a commonly used tool in the literature, it constitutes an important part of assets of firms in retail industry. Furthermore, they observe that, non-debt tax shields, measured by depreciation expenses, have no significant influence on debt ratios. The variables that they use have an influence on maturity structure of debt rather than total debt. So, the effects on long term debt and short term debt have a tendency to cancel out. They observe that both industry characteristics and time specific effects have significant impact on capital structure of firms.
Chittenden et al. (1996) analyze a U.K. database for a sample of both listed and unlisted small firms with an emphasis on growth and being quoted in stock market. Using OLS regression, they find that tangible assets, profitability, size and being listed have significant effects on financial structure of small firms.
16
Growth does not have a significant effect on leverage but combination of rapid growth and being unlisted have. They find that collaterals are used by lenders to solve information asymmetry problem widely, especially for small unlisted firms. Moreover, the importance of collateral decreases with the increase in size. Furthermore, long term debts provided to small companies are mostly based on collaterals. They conclude that financial barriers to enter stock markets for small firms needs to be reduced and innovative solutions are needed to solve agency problem between small firms and lenders.
Like Chittenden et al. (1996), Michaelas et al. (1999) also analyze a U.K. database for SMEs. Using panel data methodology, they find that size, asset structure, profitability, growth, future growth opportunities, age, stock turnover and net debtors have significant effect on short term debt and long term debt levels. They find that tax rate has an insignificant effect. Moreover, their results indicate that average short term debt ratios of SMEs increase during periods of economic recession and decrease as economic conditions improve. However, long term debt ratio is positively associated with economic growth.
Romano et al. (2000) study factors influencing capital structure decisions of family businesses in Australia. They collect primary data with 250 item questionnaire, mailed to a random sample of 5000 business owners. Their response rate was 29.2%. They analyze the data of in four stages: data screening, a principal component analysis, a confirmatory factor analysis and structural
17
equation modeling. They disclose that firm size, age and owners preference for maintaining their control of the business has significant effects on debt levels. Furthermore, having a formal business plan and owners desire for growth and their desire to control are the other factors that influence the capital structure of family businesses. According to them, small firms without a formal business plan rely on loans from other family members. However, firms in the service industry and firms whose owners plan to achieve growth by new product or process development are less likely to use family loans. They also report that MM propositions are more appropriate for public companies and pecking order predictions are in line with the capital structure decisions of family businesses.
Cassar and Holmes (2003) also examine Australian SMEs. Using OLS regression, they find that size, profitability, growth of assets and asset tangibility are important factors in determining the capital structure of SMEs. Moreover, what is different in their study is that, they examine if there is a difference between financing and firm characteristics of small firms and relatively larger firms in the sample. They divide their sample into two using sample median for total assets. They discover that, the effects of these factors on capital structure are homogenous across both small and large firm.
Hall et al. (2004) examine the determinants of the capital structures of 4,000 SMEs from Belgium, Germany, Spain, Ireland, Italy, Netherlands, Portugal and the UK. They define firms with fewer than 200 employees as SMEs. They test
18
profitability, growth, asset structure, size and age as capital structure determinants. Growth is measured by the percentage change in sales turnover in previous 3 years and assets structure is measured by the ratio of tangible assets to total assets. For the whole sample, they find collateral as the strongest and growth as the weakest determinants of the capital structure. Furthermore, they observe that the country fits best to pecking order predictions is the UK, followed by Spain and Italy. Hence, firms in the UK rely more on their retained earnings and need collaterals to obtain external finance more than other countries in their sample.
Sogorb-Mira (2005) tests how firm characteristics affect SME capital structure in Spain. Their data consists of 6,482 firms over the period between 1994 and 1998. Using panel data analysis, he finds that non-debt tax shields and profitability are negatively related with leverage while size, assets structure and growth options have positive effect on leverage. The results support maturity matching principle. That is, Spanish firms are trying to finance their long term assets with long term debt and their current assets with short term debt.
Bhaird and Lucey (2010) examine capital structure of Irish SMEs. They emphasize the role of personal wealth of the owner especially in the early years of a firm. They find that owner’s personal assets, which can be shown as collateral, play significant role in capital structure of small firms. They observe that after first years, firms rely more on retained profits and short term debt. Owners’ desire
19
to keep control also plays a role in these decisions. They find that asset tangibility is positively related with long term debt. Irish firms with more growth options are positively associated with external equity and negatively associated with retained earnings.
Pindado et al. (2006) investigate the effect of financial distress on the capital structure of Portuguese small firm. They estimate models using Generalized Method of Moments (GMM) on a panel data of small Portuguese firms during a period of recession. Using GMM they solve the endogeneity problems by using instruments. They define financially distressed firms as if they fail to satisfy their financial obligations, starting from the first period that financial distress occurs. In their regressions they also include lagged debt ratios. To they measure the speed of adjustment to target levels. They find that small firms adjust their debt to target levels. However, financially distressed firms act randomly. The coefficients on lagged debt ratios for financially distressed firms are found to be not significant, probably because they lack the knowledge to handle the distress.
Klapper et al. (2006) analyze SME financing in Poland. The majority of firms in their sample operate in service sector. They observe that larger firms generally have higher leverage and older firms tend to decrease their debt levels. They suggest that age may not be a good proxy for reputation in transition economies like Poland. They also find that leverage is positively associated with asset tangibility and growth in assets. Information asymmetry problem is observed
20
mostly small firms thus these firms have to rely on more their retained earnings and they use external equity only as a last resort.
Heyman et al. (2008) examine capital structures of privately held Belgian firms. They conduct panel data methodology and observe that firms having rapid growth in their assets and firms with fewer tangible assets have lower debt ratios. They find that firms are trying to match the maturity of their assets with the maturity of their liabilities. Furthermore, they measure the credit worthiness of firms by a short term default risk indicator and they observe that firms having low credit risk borrow more long term debt and firms having high credit risk forced to take short term debt, as expected.
Degryse et al. (2010) investigate the capital structure of Dutch SMEs. They employ a panel data analysis in their investigation. Their results are in accordance with pecking order theory. That is, size, asset tangibility, growth of assets and growth opportunities are positively associated with leverage. Furthermore, they observe that SMEs prefer to use their profits to decrease their debt levels. They find that the industry that the firm operates in is also important factor for the capital structure of Dutch SMEs. They also support the maturity matching principle.
Fan et al. (2010) examine the capital structures of debt maturity choices of 39 developed and developing countries including United States and Turkey. They
21
measure the total leverage as the ratio of total debt to market value of the firm. Market value of firms is defined as the market value of common equity added by book value of preferred stock and total debt. Moreover, they use long term debt to total debt ratio as indicator of debt maturity. Turkey and USA are found among five countries which have lowest amount of total debt in their capital structures. However, when debt maturity is observed, USA is found as the fourth country which has highest long term debt ratio while Turkey is the thirty seventh. This difference stems from being a developed economy or not. Hence developed economies have more long term debt in their capital structure. In order to investigate the difference between countries, they use some country specific measure like usage of common law, level of corruption, existence of an explicit bankruptcy code, existence of deposit insurance. They provide such measures from sources including International Country Risk Guide and Corruption Perception Index. In general they find that, being a developed economy, common law and low level of corruption are associated with lower leverage and higher long term debt. Related with USA they report that, ratio of tangible assets to total assets, profitability and size is positively and market-to-book ratios of firms are negatively related with both leverage and debt maturity.
22
2.3 Capital Structure of Turkish SMEs
Regarding with Turkish SMEs, Korkmaz et al. (2007) analyze capital structure of the SMEs listed in the Istanbul Stock Exchange (ISE). They examine 37 firms over period between 1997 and 2004 using stepwise least squares regression technique. They consider firm size, risk, profitability, non-debt tax shields and growth rate as the variables of capital structure determinants. They find that profitability, firm risk, and non-debt tax shields are the most important factors that influence SMEs capital structure. Firm risk is measured by the variability in net sales. They observe that an increase in the variability of firm’s assets will lead to an increase in the leverage.
Acaravcı and Doğukanlı (2004) examine the factors affecting structure of manufacturing firms listed on the ISE. However, they do not focus on SMEs. They conduct panel data analysis of 66 firms over a period between 1992 and 2003. In addition to firm characteristics, they have also test macroeconomic indicators such as development of stock markets, development of banking sector, change in real GDP, inflation, total government domestic debt stock which are uncommon in SME literature. The development of stock market is measured by the total market value of the stocks trading in the ISE. The development of banking sector is measured by the total amount of credits provided to private sector. Both of these measures and domestic debt are scaled by nominal GDP. They find that growth rate of total assets, development of banking sector, inflation
23
and corporate tax rate are positively related with leverage. On the other hand, profitability is found to be negatively associated with debt ratio as expected. The remaining variables are found to be insignificant.
Akkaya and Güler (2007) investigate the capital structure of big sized manufacturing company’s trade on the ISE. They use panel data methodology and use total debt to total assets, total debt to total equity and short term debt to total assets as dependent variables. They find that firm characteristics are more important than market characteristics in deciding the maturity of firms debt. Both short term debt and long term debt are found to be influenced by similar variables such as profitability, assets turnover, growth in sales and assets. Furthermore, they find a negative relation between profitability and leverage consistent with pecking order theory. Also, the positive relation between assets turnover and total debt is in line with free cash flow theory of Jensen (1986).
Yıldız et al. (2009) test the predictions of trade-off theory and pecking order theory using a panel data of manufacturing firms listed on the ISE during the period between 1998 and 2006. Total debt, short term debt and long term debt scaled by equity and used as dependent variables in their regressions. They observe a negative relation between profitability and leverage. Moreover, asset tangibility is found as insignificantly related with total debt and long term debt and have significant negative effects on short term debt. Furthermore, size is found as positively associated with total debt and short term debt and asset growth
24
is positively associated with total debt and long term debt. Lastly, tax rate and non-debt tax shields are found to be insignificant in explaining capital structure of Turkish firms. According to Yıldız et al. (2009), this finding shows that taxes paid by companies are very low and they are omitted by firms in deciding their capital structures.
In addition to firm characteristics, country specific environmental factors can also affect SMEs access to finance. For example, Levy (1993) underlines that, in Tanzania, regulatory and tax constraints appear largest for small firms and this restricted access to financial services decreases the growth of SMEs. In addition, Beck et al. (2005) mention that SMEs that operate in underdeveloped systems, which has higher level of corruption, are affected by all obstacles like financing problems, legal constraints and corruption more than firms operating in countries with a smaller level of corruption. The development in the financial and legal systems decreases the corruption and relaxes the constraints on the SMEs.
Hence, the literature examining the capital structure of SMEs in several countries support pecking order theory is valid. Moreover, the characteristics of firms, such as size, profitability, having tangible assets, growth and growth opportunities are factors that determine the choice of financing. In this thesis, I will follow the existing literature and test the predictions of the trade-off theory and pecking order theory for the SMEs in Turkey.
25
CHAPTER 3
HYPOTHESES
Both trade-off theory and pecking order theory are “point of view” theories according to Frank and Goyal (2007). That is, they do not give explicit mathematical models but they explain the intuition about the relationship between capital structure and its determinants. This allows researchers to develop and test their hypotheses. Following the literature, in this chapter I will discuss the hypotheses that will be tested about the capital structure of Turkish SMEs.
Like in most empirical papers, theoretical results must be interpreted using hypotheses constructed from the theoretical effects of firms’ variables. The most frequently used variables in the literature to test capital structure of firms are firm size, asset tangibility, profitability, growth and growth opportunities. Both trade-off theory and pecking order theory have some predictions about the impact of these variables on capital structure. They can be summarized as follows:
26
Trade-off theory Pecking order theory
Size + +
Asset Tangibility + +
Profitability + -
Growth - +
Growth Opportunities - +
An increase in size will decrease probability of bankruptcy and information asymmetry problems. Hence, both pecking order theory and trade-off theory predicts that firms’ debt level increase with an increase in size. Moreover, collaterals may decrease cost of bankruptcy and give opportunity to lenders to assess firms. Therefore, tangible assets are expected to have positive effect on debt ratio. Furthermore, pecking order theory expects that firms use their profits to decrease their debt levels while trade-off theory expects the opposite since more profitable firms have more opportunity to take debt. Additionally, fast growth and high growth opportunities are positively associated with debt usage according to pecking order theory. However, trade-off theory anticipates that high financial distress, resulted from fast growth and high growth opportunities, leads firms to decrease their leverage.
3.1 Size
One of the main problems faced by SMEs in their debt financing is information asymmetry problem. Lenders use size as a proxy to solve this problem. First of all, smaller firms find more difficult and costly to solve the information
27
asymmetry problems with lenders. Moreover, lenders also do not prefer to finance small firms because most of the data provided by small firms to banks are not easily verifiable and needs extra effort to verify. Furthermore, smaller firms have limited capital resources and they reach capital at higher costs than relatively bigger firms. Transaction costs can also discourage small firms from obtaining debt finance since smaller amount of financing cause relatively higher transaction costs (Titman and Wessels, 1988).
Size might be also used as a proxy for bankruptcy cost. Another explanation for using firm size and as one of the determinants of leverage is the negative relation between probability of bankruptcy and firm size. With an increasing firm size, cash flows of the firm become less volatile and earnings of the firm become more predictable (Degryse et al., 2010). Therefore, financial distress of bankruptcy decreases and firms prefer to take more debt. Also from lenders point of view, as it is indicated in Berryman (1982), lending to small firms represents a significant risk because of the negative relation between firm size and probability of insolvency. Both limited management skills and attitude of banks to small firms play a role in this negative relation.
Trade-off theory, which balances the benefits of debt and the financial distress of bankruptcy, expects size to be positively associated with leverage since probability of bankruptcy decreases with size. By this way, firms can take more debt. Like trade-off theory, pecking order theory also expects a positive relation
28
between firm size and leverage since information asymmetry problems reduce as size increases.
Unlike expectations of trade-off theory and pecking order theory, it is also possible to have a negative relation between size and debt. Petit and Singer (1985) argue that although it is more costly to provide debt for smaller firms, cost of providing equity may be even higher. Therefore, smaller firms might prefer having more debt in their capital structure. However, most of the papers in the literature find a positive relation between firm size and debt ratio. For example, Van der Wijst and Thurik (1993), Chittenden et al. (1996), Jordan et al. (1998), Michaelas et al. (1999), Romano et al. (2000), Cassar and Holmes (2003), Pindado et al. (2006), Klapper et al. (2006), Heyman et al. (2008) all find a positive relation between size and leverage. Therefore, the first hypothesis is:
H1: Firm size is positively related with debt ratio.
It will be advantageous to evaluate short term debt and long term debt separately while analyzing the capital structure and financing of firms. In general, small firms have more problems in finding long term debt than short term debt. Therefore, long term debt is expected to be positively related with firm size. Due to the problems in raising long term debt, small firms tend to use short term debt more, so firm size is expected to be negatively related with short term debt. The relation between short term debt, long term debt and firm size has been analyzed
29
for SMEs in several countries. Michaelas et al. (1999), Hall et al. (2004) and Degryse et al. (2010) find a significantly negative relation between short term debt and firm size while effect of size on long term debt is significantly positive. Although Bhaird and Lucey (2010) find a positive relation between size and long term debt, it is not significant. Cassar and Holmes (2003) show a significantly positive relation with long term debt but an insignificant relation with short term debt. Hence, I will test the following hypotheses for the relation between size and debt usage with different maturities:
H1-1: Firm size is positively related with long term debt. H1-2: Firm size is negatively related with short term debt.
3.2 Asset Structure (Collateral)
The tangibility of assets is another important determinant for the capital structure of firms. The probability of not taking money back from the firms makes banks and other lenders more reluctant to provide financing. Although financial policies differ across countries, collateral is appreciated by every lender. As Titman and Wessels (1988) indicate, firms’ liquidation values increase as firms have more assets to show as collateral. Therefore, asset tangibility is expected to be positively correlated with debt level. Collaterals decrease the losses faced by lenders by increasing the liquidation value of a firm. Pledging firms’ assets as
30
collateral not only decreases the agency cost of debt; but also reduces the adverse selection and moral hazard costs (Cassar and Holmes, 2003). Hence, firms having assets with high liquidation value face with relatively less problems in debt financing. As a result, they are expected to have higher leverage.
In this thesis, I use tangible assets to measure asset structure. Since tangible assets reduce the potential bankruptcy costs and credit risk, trade-off theory expects a positive association between collateral and leverage. In addition, tangible assets help to decrease the problem of information asymmetry, which is the main argument of pecking order theory. Thus, not surprisingly, like trade-off theory, pecking order theory also expects a positive relation between collateral and leverage.
As explained in the literature review, information asymmetry problems are even more severe for smaller firms. Smaller firms are not obligated to announce their financial statements which make it harder to assess them. Beck et al. (2006) indicate that collateral requirements of lenders have a significant constraining effect on small firms’ growth. Moreover, large firms are not affected by obstacles like collateral requirements, high amount of bank paperwork and bureaucracy, limited loanable funds, need for special connections with lenders, accessing long term debt etc. However, these obstacles have a significantly negative effect on SMEs. Hence, collaterals are very important for SMEs.
31
Jordan et al. (1998) and Michaelas et al. (1999) find a positive relation between asset tangibility and debt ratio for U.K. SMEs. Moreover, Cassar and Holmes (2003), Klapper et al. (2006), Pindado et al. (2006) and Heyman et al. (2008) also observe positive relation between debt ratio and collateral for Australian, Eastern European, Portuguese and Belgian SMEs. Therefore, I form the second main hypothesis as:
H2: Collateral is positively related with debt ratio.
In addition to total debt, the effect of collaterals on short term debt and long term debt is also analyzed separately in the literature. Since lenders prefer collateral to assess the firms, it is expected that the long term debt to be positively correlated with asset tangibility. Furthermore, as Myers (1977) indicates, the loan maturity is correlated with the maturity of the assets used as collateral. Therefore, if the firm has long term assets, they are more likely to use long term debt rather than short term debt. Van der Wijst and Thurik (1993), Chittenden et al. (1996), Hall et al. (2004) and Sogorb-Mira (2005) found that collateral has a significant positive relation with long term debt but a significant negative relation with short term debt. Additionally, Bhaird and Lucey (2010) indicate a positive relation between collateral and long term debt for manufacturing, hotel and service industries except for metal manufacturing industry. Hence, two hypotheses regarding to the maturity of debt and collateral are stated as:
32
H2-1: Asset structure is positively related with long term debt. H2-2: Asset structure is negatively related with short term debt.
3.3 Profitability
Trade-off theory expects that firms with more profits have a higher debt ratio. According to trade-off theory, firms use debt as a tool to decrease their tax liabilities and more profitable firms have more opportunity to obtain debt.
On the other hand, pecking order theory predicts that profitability and leverage are negatively related. Myers (1984) explains this relation as follows: More profitable firms will need less external finance since retained earnings are the most desirable source of financing. Although more profitable firms have fewer problems in reaching external finance, they prefer retained earnings since external capital is more costly. Almost all of the empirical studies found a negative relation between profitability and leverage (see e.g. Van der Wijst and Thurik, 1993; Chittenden et al., 1996; Jordan et al., 1998; Coleman and Cohn, 1999; Michaelas et al., 1999; Sogorb-Mira, 2005; Pindado et al., 2006; Heyman et al., 2008). Therefore, my hypothesis regarding profitability is:
33
Since retained earnings are more desirable than external capital according to pecking order theory, profitability is negatively related with both short term debt and long term debt. Moreover, SMEs use short term debt more than long term debt. So, it can be also expected that profitability has a higher negative impact on short term debt than long term debt. The empirical findings also support the prediction of pecking order theory. Cassar and Holmes (2003) and Sogorb-Mira (2005) show that profitability is negatively related with both long term debt and short term debt and it has a greater negative effect on short term debt. Chittenden et al. (1996) and Hall et al. (2004) also find the same relations for British and European SMEs except the impact of profitability on long term debt is not significant. Therefore, my hypotheses about the type of debt usage and profitability are stated as follows:
H3-1: Profitability is negatively related with short term debt. H3-2: Profitability is negatively related with long term debt.
H3-3: The impact of profitability on short term debt is higher than that on long term debt.
3.4 Growth Opportunities
Myers (1977) indicates that agency problems between managers and lenders, especially the underinvestment problem, are more severe for firms with more
34
growth opportunities which make these firms to prefer less debt. Also, as growth opportunities increase, the financial distress that firm faces increases because they have more things to lose. Therefore, trade-off theory predicts that firms with high growth opportunities decrease their debt levels. Underinvestment problem occurs because firms obtaining debt with high interest rates may have a tendency to reject projects with positive net present values. The equity holders bear the entire cost of the project but they may not earn profit because of high interest rates (Myers, 1977). Also, Myers (1977) adds that the lenders may not take the advantage of growth since they will only get back the amount that they lend. This increases the cost of long term debt and encourages firms to use more short term debt.
However, pecking order theory predicts the opposite of trade-off theory. In other words, it expects leverage is expected to be positively related with growth opportunities. According to pecking order theory, growing firms will first try to finance their investments through retained earnings. If it is not possible, firms with high growth opportunities will use debt to finance their growth. Moreover, firms with high growth opportunities can use these growth opportunities to attract external finance. Since obtaining short term debt can be more expensive, it is expected that growth opportunities lead to a decrease in short term debt and an increase in long term debt.
35
There exist several papers in the literature examining the relation between growth opportunities and leverage. Mostly, book to market ratio, research and development expenses or the relative amount of intangible assets is used as a proxy to measure the growth opportunities. Titman and Wessels (1998) use ratio of capital expenditure to total assets and research and development expenses over sales as indicators of growth. They find a significant and negative relation between growth opportunities and leverage. In addition, Barclay et al. (1995) and Barclay et al. (2006) report a negative relation between growth opportunities and leverage which is consistent with trade-off theory. However, papers analyzing SMEs find results in line with pecking order predictions. Michaelas et al. (1999), Sogorb-Mira (2005) and Degryse et al. (2010) all report positive relations between growth opportunities and leverage. Moreover, Sogorb-Mira (2005) and Degryse et al. (2010) observe a significantly negative relation with short term debt and a significantly positive relation with long term debt. Therefore I form the following hypotheses:
H4: Growth opportunities are positively related with leverage.
H4-1: Growth opportunities are negatively related with short term debt. H4-2: Growth opportunities are positively related with long term debt.
36
3.5 Growth
In addition to growth opportunities, past growth rate also has significant effects on the debt ratio. It is important to analyze them separately since past growth rate and growth opportunities may not be good indicators of each other (Heyman et al., 2007). Predictions of trade-off and pecking order theory about past growth are similar to their predictions for growth opportunities. It is likely for fast growing small firms to have insufficient funds to finance their growth internally. Hence, these firms issue debt to finance their growth. Also, considering the problems that small firms face in raising long term debt, growth rate is likely to have a higher effect on short term debt than long term debt.
Michaelas et al. (1999) find significantly positive relation between growth and for long, medium and short term debt maturities. Furthermore, Degryse et al. (2010) indicates an insignificant relation with short term debt but significantly positive relations with total debt and long term debt. Lastly, Chittenden et al. (1996) report positive and significant coefficients for total debt and short term debt. In light of these findings, I form the following hypotheses related with growth.
H5: Growth is positively related with total debt.
H5-1: Growth is positively related with short term debt. H5-2: Growth is positively related with long term debt.
37
Below table summarizes my hypotheses described in this section.
Total Debt Short term debt Long term debt
Size + - +
Collateral + - +
Profitability - - -
Growth + + +
Growth Opportunities + - +
Hence, I expect that larger firms, those with higher amount of tangible assets, and those with growth opportunities use more debt. Moreover, these firms reduce their short term debt levels and prefer long term debt in particular since it is more advantageous. More profitable firms are expected to use less external debt since retained earnings are the most desired financial sources. Lastly, rapidly growing firms are likely to have insufficient internal funds. So, they are expected to use external finance, especially short term debt, which is easier to obtain, in the first place.
38
CHAPTER 4
DATA, VARIABLES AND EMPIRICAL MODEL
4.1 Data
The data used in this thesis is obtained from Central Bank of the Republic of Turkey (CBRT) upon confidential agreements. In order to investigate developments in each sector and evaluate behavior of the markets, since 1990, CBRT prepares yearly “Company Accounts” with voluntary participation of firms. Using these data, CBRT reports the aggregated financial statements of each sector. This dataset includes all industries and firms located in all of cities in Turkey. Therefore, it can be evaluated as a valid representative of Turkish economy. It includes firm level data of over 8000 firms from non-financial sectors. According to European Commission (2009), there exist 2,313,720 SMEs in Turkey by 2008. Although, CBRT dataset is the most comprehensive available dataset on SMEs, it covers only very small portion of all SMEs in Turkey. Financial firms are excluded from the sample because they have different capital structures. They classify the firms into 13 main and 162 sub-sectors. Nearly 4000
39
of them are manufacturing firms. In addition to the balance sheet and income statement accounts, information about the sector that the firm is operating, the number of workers, its foundation date, and its legal form are also provided in the dataset. However, financial statements provided by the companies are not audited. Companies’ declarations are taken as true in the analysis.
Data that I use in the analysis has cross sectional observations for several years. This panel nature of the data encourages me to use panel data methodology to test the capital structure theories. The number of firms existing in the data set changes year by year which makes the dataset an unbalanced panel.
Hsiao (2007) denotes that there exist several advantages of panel data compared to cross-sectional or times series data. Panel data controls firm heterogeneity and reduce the collinearity among the variables used in the model (Arellano and Bover, 1990). Omitting heterogeneity in the variables causes bias in estimation. Furthermore, panel data contains more data points, more degrees of freedom and more sample variability than cross sectional data. This provides higher efficiency for the estimations. Moreover, panel data have information about both the intertemporal dynamics and individuality of entities. So, it is better to identify and measure effects which are not easy to detect in cross-section or times series data individually (Baltagi, 1995).
40
4.1.1 Sample Selection
The time period between 1998 and 2008 is used in the analysis. The sample includes only manufacturing firms. Firms in the service sector including financial ones are excluded from the sample. One of the firm classification methods that CBRT use is based on the number of workers which is the method that I also prefer in this paper.
In this thesis, I analyze the capital structure of Small and Medium Sized Enterprises from manufacturing sector. The firms are grouped into two categories based on their size measured with the number of workers they have. Companies having workers less than or equal to 50 are classified as small firms. If they have workers between 51 and 500, they are considered as medium sized firms, as grouped by the CBRT.
Firms included in my sample have less than 500 workers during the time period between 1997 and 2008. However, observations from 1997 are not included in the analysis because they are used to calculate growth variable. While investigating data, I observe that there exists high number of firms having abnormal growth in their total assets (more than 400% in a year). Since the data is entered manually, there were some entry mistakes in the data. I try to clean them. Originally, there were 49,198 observations including 4,011 observations from big (more than 500 workers) companies. First, I delete observations of big companies. Second, since
41
it is not known at which month of the year the firm was established, the financial statements, mainly income statements may not cover the whole year. If the firm was established in that year, it was excluded from the sample because its profit may not cover the whole year. With this elimination, 167 observations were lost. Third, if the firm has negative age or was established before the Republic of Turkey was established, they were excluded. Fourth, the yearly growth rate in number of workers, total assets and net sales were calculated and compared over the years. Those with inconsistent values are excluded from the sample as well. If the number of workers in a single year is missing, I fill the missing year with the average of one year before and after. After the cleaning procedure, there were 44,029 observations.
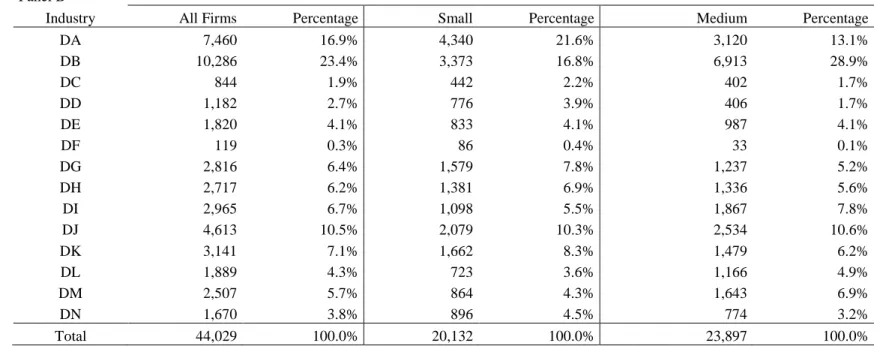
My data set contains 4003 firms per year on average and 44,029 observations in total. The yearly distribution of the number of firms, and their distribution over 14 sub-sectors of manufacturing are given for all firms and for small and medium sized enterprises in Table 1. Percentage that each sector constitutes in total sample by year is also presented in Table 1. Total number of firms in data has an upward trend between 1998 and 2002 and it increases every year in that period except 2001. On the other hand, between 2002 and 2008 it discloses a downward trend. Firms operating in textile and textile products industry constitutes biggest portion of the sample (23.4%). It is followed by firms in food products, beverages and tobacco industry (16.9%). On the other hand, the firms in coke, refined petroleum products and nuclear fuel industry is the smallest, it represents only the 0.3% of
42
the sample. Small and medium firms seem to be evenly distributed in the total sample. That is, 46% of full sample is small firms and remaining 54% is medium sized firms.
Table 1 – Distribution of firms by year and sector
Panel A
Year All Firms Percentage Small Firms Percentage Medium Firms Percentage 1998 3,265 7.4% 1,413 7.0% 1,852 7.7% 1999 3,671 8.3% 1,794 8.9% 1,877 7.9% 2000 3,929 8.9% 1,942 9.6% 1,987 8.3% 2001 3,916 8.9% 1,932 9.6% 1,984 8.3% 2002 4,480 10.2% 2,300 11.4% 2,180 9.1% 2003 4,246 9.6% 2,093 10.4% 2,153 9.0% 2004 4,301 9.8% 1,913 9.5% 2,388 10.0% 2005 4,128 9.4% 1,817 9.0% 2,311 9.7% 2006 3,933 8.9% 1,554 7.7% 2,379 10.0% 2007 4,286 9.7% 1,808 9.0% 2,478 10.4% 2008 3,874 8.8% 1,566 7.8% 2,308 9.7% Total 44,029 100.0% 20,132 100.0% 23,897 100.0%