Full Terms & Conditions of access and use can be found at
http://www.tandfonline.com/action/journalInformation?journalCode=rafe20
Download by: [Bilkent University] Date: 25 October 2017, At: 06:33
Applied Financial Economics
ISSN: 0960-3107 (Print) 1466-4305 (Online) Journal homepage: http://www.tandfonline.com/loi/rafe20
Short- and long-term links among European and
US stock markets
ROBERT-JAN GERRITS & AYSE YUCE
To cite this article: ROBERT-JAN GERRITS & AYSE YUCE (1999) Short- and long-term links among European and US stock markets, Applied Financial Economics, 9:1, 1-9, DOI: 10.1080/096031099332483
To link to this article: http://dx.doi.org/10.1080/096031099332483
Published online: 07 Oct 2010.
Submit your article to this journal
Article views: 172
View related articles
Short- and long-term links among
European and US stock markets
ROBERT-JAN GERRITS and AYSE YU
È
CEBilkent University, Faculty of Management, 06533 Bilkent, Ankara, T urkey
Recently, national economies have become more internationalized because of in-creased trade and inin-creased cooperation between national governments leading to removal of barriers to free ¯ ow of goods and services, and ® nancial, physical and human capital. The relationship between equity markets in various countries has been examined extensively in the literature. This study tests the interdependence between stock prices in Germany, the UK, the Netherlands and the US, using daily closing prices for the period between March 1990 and October 1994. Results of the tests show that the US exerts a signi® cant impact on European markets. Moreover, the three European markets in¯ uence each other in the short and long run. Therefore, diversi® -cation among these national stock markets will not greatly reduce the portfolio risk without sacri® cing the expected return.
I. INTRODUCTION
In the last 30 years there has been an increase in diversi® ca-tion at several levels in the world economy. Large ® rms have discovered advantages in international diversi® cation and have diversi® ed direct investments geographically and across industries to become today’s multinational corpora-tions. Smaller investors and professional investment and pension fund managers who look after their interests, have also become aware of the potential bene® ts of international diversi® cation. Cross-border investment continues its rapid worldwide growth as investors are attracted by the potential opportunities for increased returns and diversi® cation bene-® ts to be gained from an international approach to invest-ment. In response to this phenomenon, banks and ® nancial institutions have increased the number of international products and services they o er, while organized ® nancial markets have tried to cope by adjusting products, proced-ures and trading times. Due to ® nancial deregulation and advances in computer technology, world stock markets have become more integrated. The globalization of markets and economies has resulted in stronger linkages between the markets of the world.
However, at the heart of the concept of international diversi® cation is the notion that economic conditions and shareholders’ returns in di erent (domestic and foreign) markets are less than perfectly correlated. If this is indeed
the case, it is possible to reduce portfolio risk without sacri® cing expected return by selecting individual securities in such a way that their risk characteristics o set each other. In this paper we use a vector error correction model to examine long-term links and short-run causality for four di erent capital markets.
II. PREVIOUS STUDIES
Recently, national economies have become more interna-tionalized because of increased trade and improved co-operation between national governments leading to the removal of barriers to free ¯ ow of goods, services, and ® nancial, physical and human capital. The relationships between equity markets in various countries have been extensively examined in many previous empirical studies. However, many early studies have made a strong case for international portfolio diversi® cation. The bene® ts of inter-national diversi® cation have been documented. Such diver-si® cation allows reduction of the total risk of a portfolio while enhancing the performance opportunities.
The lack of interdependence across national stock mar-kets has been presented as evidence supporting the bene® ts of international portfolio diversi® cation. Agmon (1972), us-ing weekly or monthly return data, ® nds no signi® cant leads or lags among the common stocks of Germany, Japan, the
0960± 3107 Ó 1999 Routledge 1
UK and the USA. Studies, such as Lessard (1976) and Jorion and Schwartz (1986), using regression models to test for the existence but not the degree of market segmentation, suggest that market segmentation does exist in some nation-al equity markets.
The stock market crash of 1987 provided new insights into the economic nature of globalization of stock markets. Dwyer and Hafer (1988), using daily data for seven months before and after the October 1987 crach, show no evidence that the levels of stock price indices for the US, Japan, Germany and the UK are related. They report statistical evidence, however, that the changes in the stock price indices in these four markets are generally related.
More recent studies, however, examining the stock price indices around the stock market crash of 1987 by Eun and Shim (1989). Von Furstenberg and Jeon (1989), and Bertera and Mayer (1990) report a substantial amount of inter-dependence among national stock markets.
Many studies have been made to examine the interna-tional linkage between the US and Japan. Becker et al. (1990), Hamao et al. (1990), Kasa (1992) ® nd strong correla-tion between the two markets with an asymmetric spillover e ect from the US to the Japanese market, while Smith et al. (1993) and Aggerwal and Park (1994) ® nd that US equity prices do not lead Japanese equity prices and state that gains from international diversi® cation are obtainable.
Recently, considerable attention has been given to pos-sible linkages and interdependencies in major Asian coun-tries. Lee et al. (1990), Chan et al. (1992), Chowdhury (1994), Rogers (1994) and Kwan et al. (1995), using cointegration tests and vector autoregression analyses, report that inter-national diversi® cation in those countries can be e ective.
European countries are also frequently examined for in-terdependencies between stock exchange markets. Mathur and Subrahmanyam (1990), Arshanpalli and Doukas (1993), and Malliaris and Urrutia (1992) have used the concept of Granger causality, and cointegration and error-correction models to analyse the linkages and dynamic interactions among stock prices.
Taylor and Tonks (1989) examine the impact of the abol-ition of UK exchange control on the degree of integration of UK and overseas stock markets. The authors use monthly stock market index data from the following ® ve stock mar-kets: United Kingdom, West Germany, Netherlands, Japan and the United States. They test short-run causality and cointegration relationships among these markets in two subperiods: April 1973 to September 1979 and October 1979 to June 1986. According to their results all markets are integrated of order 1. The cointegration tests indicate the existence of cointegration between the UK, West Germany, Netherlands and Japan post-1979, but not before. Accord-ing to the Granger causality tests causality runs from the UK to the German, Dutch and Japanese markets and from Germany to the Netherlands, from Japan to Germany, and from Japan to the Netherlands. No signi® cant causality is
deduced in any pair involving the United States. The authors conclude that the bene® ts from international diver-si® cation will be reduced in the long run.
The literature review has shown that there is con¯ icting evidence for possible international stock market linkages. Hence this subject needs further investigation. In this paper, the linkages among stock prices in the stock exchanges of Germany, Holland, the UK and the US are studied, using daily closing data from March 1990 through October 1994. Cointegration tests and a vector error correction model, VEC, are used for the analysis of a possible existence of short- and long-term linkages among the equity markets. III. DATA AND METHODOLOGY
The data used to investigate short-run and long-run interde-pendencies consist of the daily closing prices for the follow-ing equity market indexes: London (FTSE 100 Price Index
± FTSE 100), Frankfurt DAX, Amsterdam EOE, and New
York (Dow Jones Industrial Average ± DJIA). Daily closing data for all four indices have been collected for the period beginning 1 March 1990 and ending 5 October 1994. The sample consists of 1188 observations. When national stock exchanges were closed due to national holidays, bank hol-idays or severe weather conditions, the index level was assumed to remain the same as that on the previous trading day.
The Financial T imes ± Stock Exchange 100 Share (FTSE 100) Index represents 70% of the equity capitalization of all United Kingdom equities. The Amsterdam European Op-tions Exchange (EOE) Index consists of 25 shares, repres-enting 88% of the total market while the Deutsche Aktien Index (DAX) in Frankfurt (consisting of 30 shares) repres-ents 60% of the equity capitalization of all German Equi-ties. The Dow Jones Industrial Average (DJIA), however, is the average of 30 stocks in the NYSE, and represents only 22± 25% of the total market.
In this study, the methodology we use for common trends in international stock markets is based on the vector error correction model, VEC. The ® rst step in examining trends in international stock markets is to test for stationarity of the time series. The time series properties of each series are investigated using Augmented Dickey± Fuller and Phillips± Perron tests.
The methodology used to examine short- and long-term linkages among equity markets, is the vector error correc-tion model, VEC. The VEC model is based on the concept of causality in the Granger sense and on the notion of cointegration.
(a) Granger causality tests
Granger causality tests are used to examine causality in time
series models. A series Xtcauses another series Ytif it is seen
2
R.-J. Gerrits and A. Y uÈce
that the series Xt has information helping to characterize
future Y s that is unique. More speci® cally, X is said to cause
Y if a coe cient ai is not zero in the following equation:
Yt
=
C0+
må
i= 1 aiXt± i+
må
j= 1 bjYt± j+
et (1)Similarly, Y is said to cause X if some coe cienta i is not
zero in Equation 2: Xt
=
F 0+
må
i= 1 a iYt± i+
må
j= 1 b jXt± j+
m t (2)If X causes Y and also Y causes X, then there is said to be feedback. The test for causality is based on an F-statistic that is computed by running the above regressions in both unconstrained (full model) and constrained (reduced model) forms:
F
=
3
(SSEr-
SSEf)m
4
/
3
SSEf
T
-
2m-
14
(3)where SSErand SSEfare the sum of squares of the residuals
of the reduced model and full model, respectively, and m the number of lags and T the number of observations. (b) Cointegration tests
Although individual series that contain stochastic trends are nonstationary in their levels, if the stochastic trends are common across series there will be stationary linear combi-nations of the levels. This phenomenon is known as cointe-gration.
A process Xt is said to be an integrated process, if it is
generated by an equation of the form
ap(B)(1
-
B)dXt=
bq(B)et (4)
where et is zero-mean white noise, a(B), b(B) are
poly-nomials in B of orders p and q, respectively (a(B) being a stationary operator), and d is an integer. Such a process
will be denoted Xt~ ARIMA(p, d, q) (autoregressive
inte-grated moving average of order p, d, q) or Xt~ I(d). If Xt
and Ytare a pair of I(d) series, then it will be generally true
that a linear combination, such as
Zt
=
Xt-
AYt (5) will also be I(d). However, it can happen that there existsa constant A such that Zt ~ I(d
-
b), b>
0. When thishappens, the pair of variables Xt and Yt are said to be
cointegrated and denoted (Xt, Yt) ~ CI(d, b). When
d
=
b=
1 and there exists an A such that Zt=
Xt-
AYtisstationary, i.e. Zt~ I(0) then it means that both series
indi-vidually have extremely important long-run components,
but that in forming Zt these long-run components cancel
out and vanish. Ztcan now be interpreted as the equilibrium
error, that is, the extent to which the economy is out of
equilibrium. Engle and Granger (1987) suggest estimating the value of A by running the regression:
Xt
=
g+
AYt+
e t (6)We can then calculate the values of Zt.
If two time series produce a stationary trend, then there exists an error correction representation, which suggest that one stock price index can be used to forecast the other. In other words, the existence of cointegration between two stock price indices implies that either one or both markets are ine cient.
(c) V ector error correction model, V EC
By combining the causality and cointegration test it is possible to develop a model that allows one to test for both short-term and long-term relationships between the series
Xt and Yt: the vector error correction model (VEC):
Yt
-
Yt± 1=
a0+
a1Z=t± 1+
må
i= 1 ci(Xt± i-
Xt± i± 1)+
å
m j= 1 dj(Yt± j-
Yt± j± 1)+
e t (7) where Z= t± 1=
Xt± 1-
AYt± 1.The potential long-run and short-run impact of the series
X on the series Y are, in the VEC model, decomposed as
follows:
· A long-run component, represented by the cointegration
term aiZ=t± 1, also known as the error-correction term. The
correction adjustments of Yt to a disequilibrium error
from the previous period Zt± 1 can spread over several
periods of time, with the coe cient a1 indicating the speed
of the correction mechanism.
· A short-run component, given by the summation terms
in the right-hand side of Equation 7. These two terms represent past changes in the variables X and Y and characterize the short-run dyamics. Speci® cally, the ® rst summation term in Equation 7 gives the short-run impact of X on Y .
Similarly, the potential long-run and short-run impact of the series Y on the series X can be expressed in the VEC model with a similar formula.
· The series Xtand Ytare cointegrated when at least one of
the coe cients of Zt± 1 is di erent from zero. In this case,
Xt and Ytexhibit long-run comovements.
· There is a short-term relationship between the series
Xt and Yt when at least one of the coe cients of ci is
di erent from zero.
The error correction model has the standard interpretation:
the change in Xt is due to the immediate, short-run
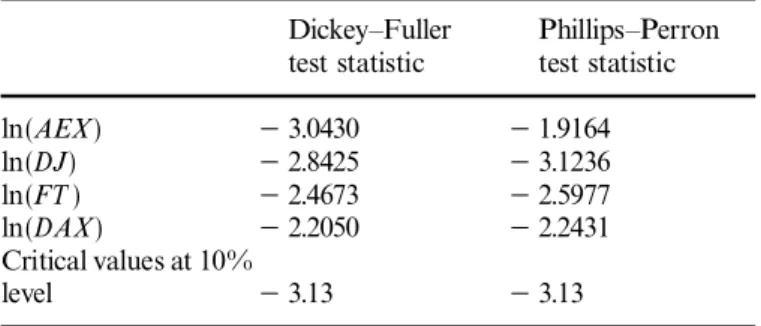
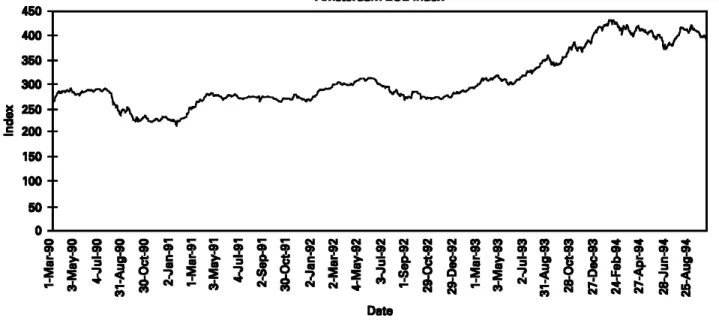
Fig. 1. Daily closing prices of New Y ork DJIA, 01/03/90± 05/10/94 Table 1. Summary of Dickey± Fuller and Phillips± Perron tests
Dickey± Fuller
test statistic Phillips± Perrontest statistic
ln(AEX) - 3.0430 - 1.9164 ln(DJ) - 2.8425 - 3.1236 ln(FT ) - 2.4673 - 2.5977 ln(DAX) - 2.2050 - 2.2431 Critical values at 10% level - 3.13 - 3.13
e ect of the change in Ytand to last period’s error, Zt± 1,
which represents the long-run adjustment to past disequili-brium. Hence, estimation of the error-correction equations is also expected to provide evidence about the long-run relationship and the nature of the adjustment process among national stock markets. Furthermore, the error-correction analysis is fundamental for testing the cross-border market e ciency hypothesis since it describes the long-run dynamic adjustment process between two stock exchange markets.
IV. RESULTS AND INTERPRETATION
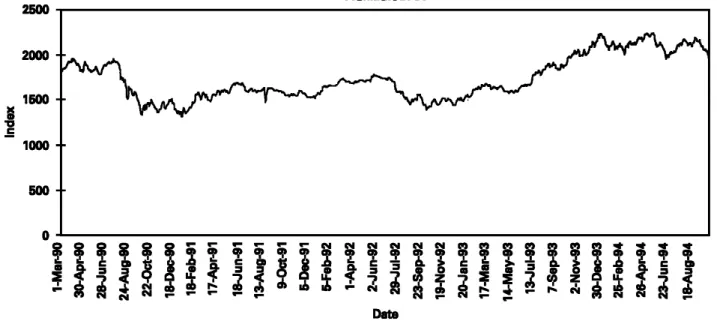
The autocorrelations in all four series do not die out gradually indicating the possibility of a unit root, and nonstationarity. After running both Dickey± Fuller and Phillips± Perron unit root tests on the natural logarithmic transformed data the results obtained are summarized in Table 1. All series exhibit trend components as can be seen
from Figs 1± 4. Therefore we check unit root in series with a null hypothesis as follows:
H0:Xt is a random walk plus drift around a stochastic
trend.
We cannot reject the presence of a unit root in the level series, which indicates nonstationarity in all the time series. Next we check if the time series are integrated of order one by searching for a unit root in the di erence series.
After running Dickey± Fuller and Phillips± Perron tests on the di erenced natural logarithmic transformed data, the results obtained are as summarized in Table 2.
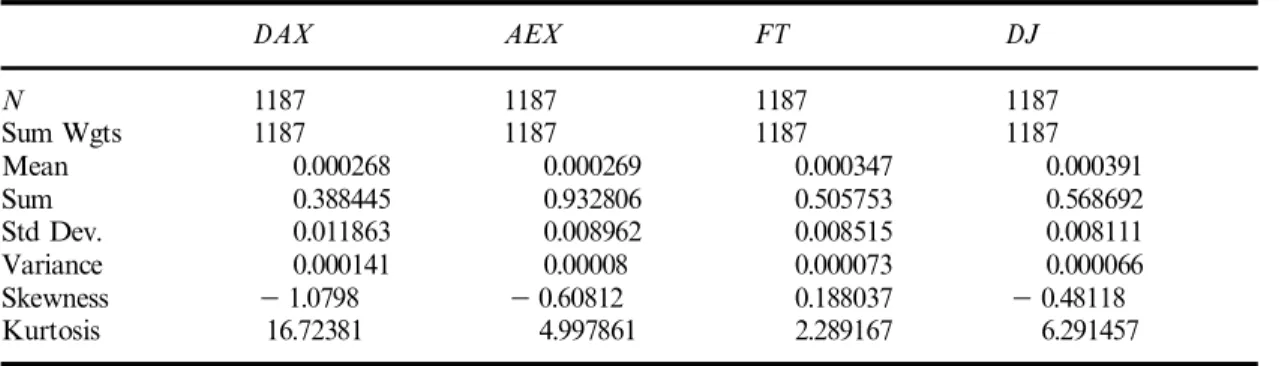
The null hypothesis of a unit root in ® rst di erences of the stock price indices is rejected for all four stock price index series. Comparing these values with the critical values, it is apparent that we can reject the hypothesis of nonstationar-ity for the di erenced ln(X) data (d ln(X) data) at the 10% level. Therefore, we can conclude that the di erenced natu-ral logarithmic transformations of all market indices are stationary indicating that all the national stock index series are individually integrated of order one. The basic statistical properties for all four stationary time series, the di erenced natural logarithmic is transformations, are given in Table 3. The table shows that all of these series are leptokurtic. All series except FT exhibit negative skewness. These results are consistent with the literature that return series in various stock markets exhibit leptokurtosism and negative skewness.
Next we examine whether the national stock market index series are cointegrated. To check the cointegration relation, we again use Phillips± Perron and Dickey± Fuller tests on the residuals of cointegrating regressions. The resid-uals do not exhibit any trend therefore we report the results
4
R.-J. Gerrits and A. Y uÈce
Fig. 2. Daily closing prices of Amsterdam EOE, 01/03/90± 05/10/94
Fig. 3. Daily closing prices of L ondon FT , 01/03/90± 05/10/94
of the following null hypothesis:
Xt
=
a+
bYt+
ut (8)Ho: utis a random walk with no stochastic trend.
The results of the pairwise cointegration tests of stock market indices are presented in Tables 4 and 5.
Several interesting observations emerge when we look at the results in Tables 4 and 5. First, the results from the entire sample show that the stock markets of the Netherlands and Germany, and the US and the UK appear to be cointe-grated. However, the null hypothesis of no cointegration between the other pairs of stock markets cannot be rejected.
At the 5% level, the critical value of the DF statistic is 3.37. These results suggest that the link among stock prices in those pairs of stock exchanges has been very weak over the period.
Phillips± Perron and Dickey± Fuller tests give con¯ icting results in the case of UK and US markets. Therefore coin-tegration relationships among markets need further invest-igation. We use Granger causality tests for this. Next we examine both the cointegration relations and the short-run causality relationships among these markets by estimating
the error correction equations. The term Zt± 1 used in
the error correction regressions was obtained from OLS
Fig. 4. Daily closing prices of Frankfurt DAX, 01/03/90± 05/10/94 Table 2. Summary of Dickey± Fuller and Phillips± Perron tests on
di erenced data
Dickey± Fuller
test statistic Phillips± Perrontest statistic
d Ln(AEX) - 4.9818* - 33.773*
d Ln(DJ) - 5.4618* - 32.680*
d Ln(FT ) - 6.3028* - 33.191*
d Ln(DAX) - 5.2322* - 33.394* The asterisks indicate signi® cance at the 5% level.
estimation of the cointegration equations. The result of the error correction equations are reported in Table 6.
The t-ratio for the coe cient of the error-correction term,
Zt± 1, indicates a long-run relationship when the t-value is
signi® cant. This result implies that the equilibrium error can be used to predict next period’s stock market price changes in either stock exchange. Another interesting aspect of the error correction analysis is that it yields information about the `short-run’ in¯ uence of the change in one market on the performance of another market.
The results (Table 6) indicate that the New York stock exchange a ects the other stock exchanges, but not vice versa. The London stock exchange is in¯ uenced by Amster-dam, New York and Frankfurt stock exchanges. Moreover, Frankfurt is in¯ uenced by the stock markets of Amsterdam, New York and London, while short-term changes in the stock markets in Holland and the US have a substantial impact on the British stock market. However, none of the European markets in¯ uences the stock exchange of New York. Although the short-run in¯ uences from changes in one of the European markets on one of the other European
markets are not as substantial as in the case of the US on the three European markets, they are signi® cant. In the case of the two pairs of national markets, the earlier reported test did not indicate signi® cant cointegration.
Tables 4 and 5 show that the stock markets of the Netherlands and Germany, and the US and the UK are cointegrated. Table 6 also reports that Amsterdam has a signi® cant impact on the German stock market in the long run and therefore the two tests agree on the result. The results in Table 6 report signi® cant impact of the US on the three European markets in the short and long run for the period examined. In all regressions reported in Table 6, the results show that the US market experts, in particular, a substantial in¯ uence in the short run (with F-values of 22.56, 13.84 and 19.44) on Amsterdam, London, and Frank-furt, respectively. However, other tests have reported no signi® cant cointegration between US and European mar-kets. In contrast, European `short- and long-run’ stock market changes do not appear to have any signi® cant im-pact on the US stock market. This result is inconsistent with the view that foreign stock market innovations have exerted substantial in¯ uence on the US market in the post-October 1987 period.
Taylor and Tonks (1989) report a cointegration relation-ship between the UK and West Germany, between the UK and the Netherlands, and no cointegration relationship be-tween the US and the UK in the post-1979 period. Our analysis shows that after 1990 there is a cointegration rela-tionship only between Germany and the Netherlands. Our results also indicate that after 1990 cointegration relation-ships between the UK and other European markets vanish-ed. Short-run causality tests indicate that the in¯ uence of the New York stock exchange on the others has increased
6
R.-J. Gerrits and A. Y uÈce
Table 3. Statistical properties of d ln(X) data DAX AEX FT DJ N 1187 1187 1187 1187 Sum Wgts 1187 1187 1187 1187 Mean 0.000268 0.000269 0.000347 0.000391 Sum 0.388445 0.932806 0.505753 0.568692 Std Dev. 0.011863 0.008962 0.008515 0.008111 Variance 0.000141 0.00008 0.000073 0.000066 Skewness - 1.0798 - 0.60812 0.188037 - 0.48118 Kurtosis 16.72381 4.997861 2.289167 6.291457
Table 4. Cointegration test, Dickey± Fuller: Constant, no trend (10% critical value = - 3.04)
ln AEX ln DJ ln FT ln DAX
ln AEX - 2.2893 - 1.7536 - 2.7463
ln DJ - 2.5833 - 2.5973 - 2.4034
ln FT - 2.1856 - 2.8910 - 2.3049
ln DAX - 3.1790* - 2.6983 - 2.1962
The asterisks indicate signi® cance at the 5% level.
Table 5. Cointegration test, Phillips± Perron: Constant, no trend (10% critical value = - 3.04)
ln AEX ln DJ ln FT ln DAX
ln AEX - 2.4751 - 1.8388 - 2.8534
ln DJ - 2.7767 - 3.2214* - 2.4313
ln FT - 2.1950 - 3.2290* - 2.1718
ln DAX - 3.1473* - 2.4033 - 2.1765
The asterisks indicate signi® cance at the 5% level.
and the in¯ uence of the London stock exchange has de-creased since 1986. There is a feedback relationship between London and Frankfurt stock exchanges.
V. CONCLUSION
The theory of causality and the notion of cointegration are used to examine linkages and dynamic interactions among stock price indices in four stock exchanges (Amsterdam, London, New York and Frankfurt) by means of the error-correction model. The data ussed in this study are daily closing prices of the stock exchanges. The sample consists of 1188 observations and covers the period March 1990 through October 1994.
Tests of stationarity allow us to conclude that the level series are nonstationary, but the di erence series are station-ary. Thus, prices are integrated of order one, I(1) and the use of the vector error correction model is appropriate to test
for long- and short-run interdependencies between the four stock exchanges. The error-correction analysis produced some interesting results with respect to the stock market interactions among the four stock exchanges.
The US market exerts a signi® cant long-term impact on the European markets, but not vice versa. Moreover, the US stock price index variable has a substantial amount of short-term in¯ uence on all other markets. This result is inconsistent with the view that foreign stock market innova-tions have exerted substantial in¯ uence on the US market in the post-October 1987 period.
The three European markets also in¯ uence each other in the short and long run. This result implies that these mar-kets are not independent from each other but move to-gether. This can be explained by the fact that the three countries are members of the European Union. The imple-mentation of some institutional agreements of the European Union concerning equity markets, the exchange rate mecha-nism that is partly coordinated among the countries, and
T ab le 6. E rr or co rr ec tio n re su lts D ep en de nt In de pe nd en t a1 c1 c2 c3 c4 c5 F -s ta tis tic s A m st er da m N ew Y or k 0. 00 98 82 0 0. 34 50 2 -0. 02 91 4 -0. 00 90 46 5 -0. 01 62 42 0. 02 77 79 22 .5 6* (2 .1 37 )* (1 0. 44 )* ( -0. 84 38 ) ( -0. 26 27 ) ( -0. 47 13 ) (0 .8 06 4) A m st er da m L on do n 0. 01 19 36 0. 06 17 02 -0. 04 92 39 -0. 05 39 30 0. 05 52 49 0. 02 32 24 1. 60 (2 .6 23 )* (1 .5 94 ) ( -1. 27 3) ( -1. 39 2) (1 .4 22 ) (0 .6 00 7) A m st er da m F ra nk fu rt -0. 00 61 87 4 -0. 01 23 75 -0. 04 79 40 -0. 03 99 21 0. 00 59 09 2 0. 07 04 94 1. 88 ( -1. 37 6) ( -0. 40 21 ) ( -1. 55 7) ( -1. 29 3) (0 .1 91 5) (2 .3 ) N ew Y or k A m st er da m 0. 00 19 02 8 -0. 02 96 87 0. 02 19 12 -0. 03 11 71 0. 04 38 05 -0. 01 34 66 1. 19 (0 .6 04 8) ( -1. 02 1) (0 .7 53 6) ( -1. 07 3) (1 .5 09 ) ( -0. 48 45 ) N ew Y or k L on do n 0. 00 70 11 3 -0. 02 32 46 0. 01 58 19 -0. 02 68 87 0. 02 57 44 -0. 01 55 73 0. 62 (1 .4 38 ) ( -0. 79 79 ) (0 .5 43 7) ( -0. 92 44 ) (0 .8 83 7) ( -0. 54 80 ) N ew Y or k F ra nk fu rt -0. 00 09 04 5 -0. 02 80 4 -0. 01 30 71 -0. 04 10 89 0. 04 24 24 0. 00 48 39 2 2. 00 ( -0. 38 29 ) ( -1. 30 1) ( -0. 60 62 ) ( -1. 90 8) (1 .9 71 )* (0 .2 32 5) L on do n A m st er da m -0. 00 25 92 0 -0. 13 41 2 0. 01 40 07 0. 03 80 64 0. 09 94 97 -0. 04 07 7 4. 51 * ( -0. 74 55 ) ( -3. 63 0) * (0 .3 77 ) (1 .0 28 ) (2 .6 87 )* ( -1. 09 8) L on do n N ew Y or k 0. 00 99 25 5 0. 26 91 6 -0. 02 67 3 -0. 00 47 26 6 0. 04 64 85 0. 31 11 6 13 .8 4* (1 .7 74 ) (8 .1 53 )* ( -0. 78 78 ) ( -0. 13 98 ) (1 .3 73 ) (0 .9 18 7) L on do n F ra nk fu rt -0. 00 44 22 4 -0. 17 54 6 -0. 01 54 92 -0. 00 07 17 7 0. 06 99 11 0. 03 53 15 2. 22 * ( -1. 65 5) ( -0. 71 73 ) ( -0. 63 43 ) ( -0. 02 9) (2 .8 66 )* (1 .4 6) F ra nk fu rt A m st er da m 0. 01 16 87 0. 16 70 6 0. 13 69 2 0. 04 59 34 0. 02 87 69 -0. 06 22 35 2. 47 * (2 .6 16 )* (3 .1 56 )* (0 .2 57 6) (0 .8 63 9) (0 .5 42 6) ( -1. 17 6) F ra nk fu rt N ew Y or k 0. 00 72 83 6 0. 40 18 4 -0. 09 50 89 0. 05 74 47 5 0. 03 17 50 0. 05 26 71 19 .4 4* (2 .0 85 )* (9 .3 18 )* ( -2. 13 2) * (1 .2 89 ) (0 .7 11 3) (1 .1 80 ) F ra nk fu rt L on do n 0. 00 87 21 8 0. 22 60 9 -0. 07 05 69 -0. 07 66 71 0. 05 30 94 -0. 19 56 5 7. 09 * (2 .5 44 )* (5 .2 71 )* ( -1. 63 3) ( -1. 77 0) (1 .2 23 ) ( -0. 45 06 ) T he t-ra tio s ar e gi ve n in pa re nt he se s. T he as te ri sk s in di ca te s si gn i® ca nc e at th e 5% le ve l. T he jo in t si gn i® ca nc e of th e in di ca te s is de te rm in ed by th e st an da rd F -t es t.
8
R.-J. Gerrits and A. Y uÈce
intensive trade and other cooperation between the national governments have removed many barriers and resulted in a high degree of integration. As a result, the markets have been globalized. Previous studies have made a strong case for international portfolio diversi® cation to reduce the risk of a portfolio while enhancing the performance opportuni-ties. However, the condition that national stock markets lack interdependence is rejected for the examined stock exchanges because of signi® cant reported short- and long-term linkages. Therefore, diversi® cation among these na-tional stock markets will not greatly reduce the portfolio risk without sacri® cing expected return.
In future we shall include other stock market data in our analysis to examine the relationships among di erent Euro-pean markets and also among EuroEuro-pean markets and Asian markets (Japan, Hong Kong...).
REFERENCES
Aggerwal, R. and Park, Y. S. (1994) The relationship between daily US and Japanese equity prices: Evidence from spot versus futures markets, Journal of Banking and Finance, 18, 757± 73. Agmon, T. (1972) The relations between equity markets: A study of share price co-movements in the United States, United King-dom, Germany, and Japan, Journal of Finance, 27, 839± 55. Arshanapalli, B. and Doukas, J. (1993) International stock market
linkages: Evidence from the pre- and post-October 1987 peri-od, Journal of Banking and Finance, 17, 193± 208.
Becker, K. G., Finnerty, J. E. and Gupta, M. (1990) The intertem-poral relation between the US and Japanese stock markets,
Journal of Finance, 45, 1297± 306.
Bertera, E. and Mayer, C. (1990) Structure and performance: Glo-bal interdependence of stock markets around the crash of 1987, European Economic Review, 34, 1155± 80.
Chan, K. C., Gup, B. E. and Pan, M. S. (1992) An empirical analysis of stock prices in major Asian markets and the United States, T he Financial Review, 27, 289± 307.
Chowdhury, A. R. (1994) Stock market interdependencies: Evidence from the Asian NIEs, Journal of Macroeconomics, 16, 629± 51.
Dwyer, G. P. and Hafer, R. W. (1988) Are national stock markets linked?, Federal Reserve Bank of St. L ouis Review, 70, 3± 14.
Engle, R. F. and Granger, C. W. (1987) Co-integration and error correction: representation, estimation, and testing,
Econo-metrica, 55, 251± 76.
Eun, C. S. and Shim, S. (1989) International transmission of stock market movements, Journal of Financial and Quantitative
Analysis, 24, 241± 56.
Hamao, Y., Masulis, R. W. and Ng, V. (1990) Correlations in price changes and volatility across international stock markets, T he
Review of Financial Studies, 3, 281± 307.
Jorion, P. and Schwartz, E. (1986) Integration versus segment-ation in the Candian stock market, Journal of Finance, 41, 603± 16.
Kasa, K. (1992) Common stochastic trends in international stock markets, Journal of Monetary Economics, 29, 95± 124. Kwan, A. C. C., Sim, A. B. and Cotsomitis, J. A. (1995) The causal
relationships between equity indices on world exchanges,
Ap-plied Economics, 27, 33± 7.
Lee, I., Petitt, R. and Swankoski, M. V. (1990) Daily return rela-tionships among Asian stock markets, Journal of Business
Finance and Accounting, 17, 265± 84.
Lessard, D. A. (1976) International diversi® cation, Financial
Ana-lyst Journal, 32, 32± 8.
Malliaris, A. G. and Urrita, J. (1992) The international crash of October 1987; causality tests, Journal of Finance and
Quantit-ative Analysis, 27, 353± 64.
Mathur, I. and Subrahmanyam, V. (1990) Interdependencies among the Nordic and US stock markets, Scandinavian
Jour-nal of Economics, 4, 587± 97.
Rogers, J. H. (1994) Entry barriers and price movements between major and emerging stock markets, Journal of
Macroeco-nomics, 16, 221± 41.
Smith, K. L., Brocato, J. and Rogers, J. E. (1993) Regularities in the data between major equity markets: evidence from Granger causality tests, Applied Financial Economics, 3, 55± 60. Taylor, M. P. and Tonks, I. (1989) The internationalisation
of stock markets and the abolition of the U.K. Ex-change Control, T he Review of Economics and Statistics, 71, 332± 6.
Von Furstenberg, G. M. and Jeon, B. N. (1990) Growing interna-tional comovements in stock price indexes, Quarterly Review
of Economics and Business, 30, 15± 30.