• * ï t · /' ' ■ ' ^ « : á · !Ь, W . · - - - - : >. - X ν · . r«. - ■ '· /-■ .^· ,** ’ г Г·'. V / " - . ' г - "-ίΞί^· · г' rr-·· ■ 1·\.λ’ '· i Ί / ^ · ' ^ ’Г ' . ■ ■ ' • с ^ i- ** · i;
^
. ’ . ■^
■'" / ■ ■ " , г · ,-. ,^'Ν , ί* · ·'“ ,.λ; ѵ гГл'Гіу^,/і/Ст
5 Ψ 0 6 -5
I S SΥ38
IS 3 É
INITIAL AND LONG-TERM PRICE PERE'ORMANCE OF INITIAL PUBLIC OFFERINGS:
TURKISH EXPERIENCE 1990-1993
A THESIS
Submitted to the Faculty of Management and the Graduate School of Business Administration
of Bilkent University
in Partial Fulfillment of the Requirements for the Degree of
Master of Business Administration
By
Z. Nu§in Yavuz September, 1996
MG)
S l o é s
I certify that 1 have read this thesis and in my opinion it is fully adequate, in scope and quality, as a thesis for the degree of Master of Business Administration.
Assist. Prof Ayşe Yüce
1 certify that 1 have read this thesis and in my opinion it is fully adequate, in scope and quality, as a thesis for the degree of Master of Business Administration.
Assoc. Prof Can §imga Mugan
1 certify that 1 have read this thesis and in my opinion it is fully adequate, in scope and quality, as a thesis for the degree of Master of Business Administration.
Assist. Prof. Zeynop Önder
Approved for the Graduate School of Business Administration.
ABSTRACT
INITIAL AND LONG-TERM PRICE PERFORMANCE OF INITIAL PUBLIC OFFERINGS:
TURKISH EXPERIENCE 1990-1993
Z. NUŞİN YAVUZ
M.B.A. Thesis
Supervisor: Assist. Prof. Ayşe Yüce
The purpose of this study is to examine both the initial and medium-long term price performance of initial public offerings in Istanbul Stock Exchange during the continuous
1990-1993 period.
In the light of the findings, initial public offerings are found to be underpriced meaning that investors in initial public offering market can exercise significant short-term returns relative to the market. In addition, in the whole period, the effect of this initial underpricing continues up to the second month. However, when we look at the long-term results, it is seen that IPOs underperformed the market although the results are not significant. As a result, investors in the IPO merket can exercise initial abnormal returns but in the long-run they produce a negative return although not significant.
ÖZET
HALKA AÇILAN ŞİRKETLERİN KISA VE UZUN DÖNEM FİYAT PERFORMANSLARI:
TÜRKİYE ÖRNEĞİ 1990-1993
Z. NUŞİN YAVUZ
M.B.A. Tezi
Tez Yöneticisi: Yardımcı Doç. Dr. Ayşe Yüce
Bu çalışmanın amacı İstanbul Menkul Kıymetler Borsasında 1990-1993 döneminde halka arz edilen hisse senetlerinin kısa ve uzun dönemli fiyat performanslarını incelemektir.
Bulunan verilerin ışığında, halka arz edilen senetlerin düşük fıyatlandırıldığı bulunmuş, ve böylece halka arz edilen senetlere yatırım yapanların kısa dönemde piyasa karşısında belirgin bir getiri sağladıkları saptanmıştır. Bununla birlikte, bütün dönemde düşük fiyatlandırma etkisi ikinci aya kadar sürmektedir. Ancak, uzun dönem sonuçlarına baktığımızda, halka arz edilen hisse senetlerinin piyasanın altında bir getiri yaptığı saptanmış ama bu getiri belirgin olmamıştır. Sonuç olarak, halka arz edilen hisse senetlerine yatırım yapan yatırımcılar, kısa dönemde anormal pozitif getiri sağlarken, uzun vadede kötü bir performansla karşılaşmaktadır.
I want to thank to my family at first, for their continous support during the preparation of this thesis and throughout my life.
I am grateful to Assist. Prof. Ayşe Yüce for her supervision and comments throughout my study. 1 would also like to thank to Assoc. Prof Can Şımga Muğan and Assist. Prof Zeynep Önder for their contribution.
ACKNOWLEDGEMENTS
I am also thankful to my friends, Alper Uzman, Mizyal İzgin and Onur Sonuvar for their help and patience during the preperation of this thesis.
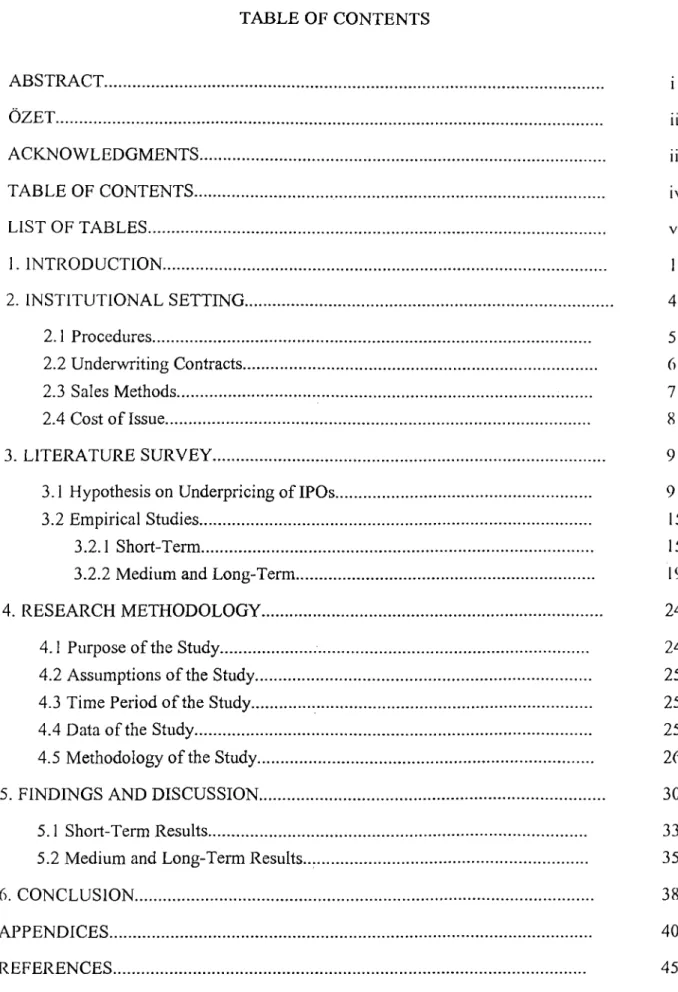
TABLE OF CONTENTS ABSTRACT... ÖZET... ACKNOWLEDGMENTS... TABLE OF CONTENTS... . LIST OF TABLES... 1. INTRODUCTION... 2. INSTITUTIONAL SETTING... 2.1 Procedures... 2.2 Underwriting Contracts... 2.3 Sales Methods... 2.4 Cost of Issue... 3. LITERATURE SURVEY...
3 .1 Hypothesis on Underpricing of IPOs. 3.2 Empirical Studies...
3.2.1 Short-Term... 3.2.2 Medium and Long-Term... 4. RESEARCH METHODOLOGY... 4.1 Purpose of the Study... 4.2 Assumptions of the Study... 4.3 Time Period of the Study... 4.4 Data of the Study... 4.5 Methodology of the Study... 5. FINDINGS AND DISCUSSION... 5.1 Short-Term Results... 5.2 Medium and Long-Term Results... 6. CONCLUSION... APPENDICES... REFERENCES... Ill iv 5 6 7
8
9 15 15 19 24 24 25 25 25 26 30 33 35 38 40 45 IVLIST OF TABLES
Table 1 Common Stock Issues in the Primary Market... Table 2 Studies of Price Performance about IPOs in World Markets. Table 3 Performance of IPOs in 1990-1993... Table 4 Performance of IPOs in 1990... Table 5 Performance of IPOs in 1991... Table 6 Performance of IPOs in 1992... Table 7 Performance of IPOs in 1993...
4 22 30 31 31 32 32
A linking mechanism between the users and the providers of capital are exercised through capital markets. Financial intermediaries bring together the surplus savers who have excess funds, with the deficit units in the economy who are in need of funds; by this way issuers are able to raise capital and investors are able to place their capital, in the most efficient way for both parties. This is provided by the primary market.
Public offerings of debt and equity constitute the primary market. Public offerings are made mainly of two reasons: 1) Providing direct capital to the company as a way of financing, and 2) Acquiring new shareholders and hence, broadening the number of shareholders with the desire to be known widespread. Some of the other reasons are: to allow original owner to convert his equity in the company to cash; to facilitate future funding by means of subsequent equity offerings and tax advantages.
The performance of initial public offerings (IPOs) is the main concern in this study and it is believed that a clear understanding of IPO market is important for investors, firms and also for undei-writers. The performance of IPOs is important for investors, as the major problem of the small investor is said to be the accessibility for the favorable new issues because of the asymmetry in information between informed and uninformed investors. Financial managers should also observe the IPO market for their evaluation of financial alternatives.
1. INTRODUCTION
Similarly, firms planning to go public should be closely interested in the pricing because a downward pricing bias of the new issue introduces a loss of funds for the firm. Pricing is one of the most important and perhaps the most difficult decision in an IPO. The price
should not be too low; the issuer firm will not get the advantage of the offering as the issue will be sold at discount and this would be unnecessarily costly to the issuer. The price also should not be too high; investors will not be willing to purchase the new issue readily and this might cause losses for the underwriters.
Underwriting a new issue is important for the incurred costs and risks of the underwriter. It is widely claimed that underwriters may attempt to 'underprice' new issues of common stock so that the initial public offerings will be fully subscribed and a rise in price subsequent to issue is observed. This may cause a good reputation on behalf of the underwriter. The theory of efficient markets suggests that the price of the newly issued stock will quickly adjust to reflect relevant information. To the extent that underpricing exists, the difference between offering price and subsequent market price constitutes an amount (initial rate of return) that is distributed by the underwriter to initial purchasers of the stock that is significantly positive in this period.
As soon as the IPOs are started trading in the market, a large amount of information about the new issues will be released. Furthermore, as new information becomes available, price of the shares that have already been listed in the market may change. According to the efficient markets theory, market will adjust the prices of new shares to reflect all available information when there are enough discerning traders in the market. As a result, pricing errors will be random and no arbitrage opportunity from certain trading rules can be derived. If however, any inefficiencies in the secondary market exist, investors can find ways to profit from the situation.
There are numerous studies that examine the performance of IPOs in the U.S. and in some other countries. They report the existence of positive average initial returns. Although there is considerable debate on the underlying rationale of such returns, in the
literature, it is mostly concluded that the presence of positive average initial returns constitutes evidence of deliberate underpricing. On the other hand, some evidence on the U.S., the U.K., Germany, Australia, Latin America and others suggest that what appears to be underpricing in short run may be overpricing in the long run, and agree on the point that IPOs' long run after-market performance is negative. These studies make the efficiency of IPO market in doubt.
The purpose of this study is to investigate the price behavior of IPOs issued between 1990-1993 and traded in the ISE, over one year period after they are listed. Both the short-run and long-run price performances will be investigated throughout the study. This will provide information on the efficiency of Turkish IPO market both in the short and the long run and we will find out if opportunities for superior profits exist. The price performance results will not only tell us about the efficiency of the Turkish IPO market but also help for comparison with the initial and the long-run performance studies done throughout the world. As Istanbul Stock Exchange (ISE) is gaining interest in the last few years and there is an increasing tendency for the firms to go public, the study will try to shed light on the present situation of IPO market.
The long-run performance of Initial Public Offerings is important for several reasons. As Ritter (1991) emphasizes: first, from the investor's point of view, the existence of price patterns may present opportunities for active trading strategies to produce superior returns. Second, a non zero aftermarket performance questions the informational efficiency of the IPO market. Third, the volume of IPOs showing large variations over time may indicate that issuers are timing new issues to take advantage of opportunities. Fourth, cost of external equity capital for companies going public depends not only upon the transaction costs incurred in going public but also upon the returns that investors receive in the aftermarket.
An initial public offering is the first effort by firms to raise capital in a public equity market. When companies go public, the intention is particularly to raise new capital for the company. But also there can be such circumstances where all the shares on offer arc being sold by existing shareholders. In fact some of the biggest initial public offerings occur when governments sell off their share-holdings in companies as privatization programs which was the situation in Turkey in 1990 and 1991.
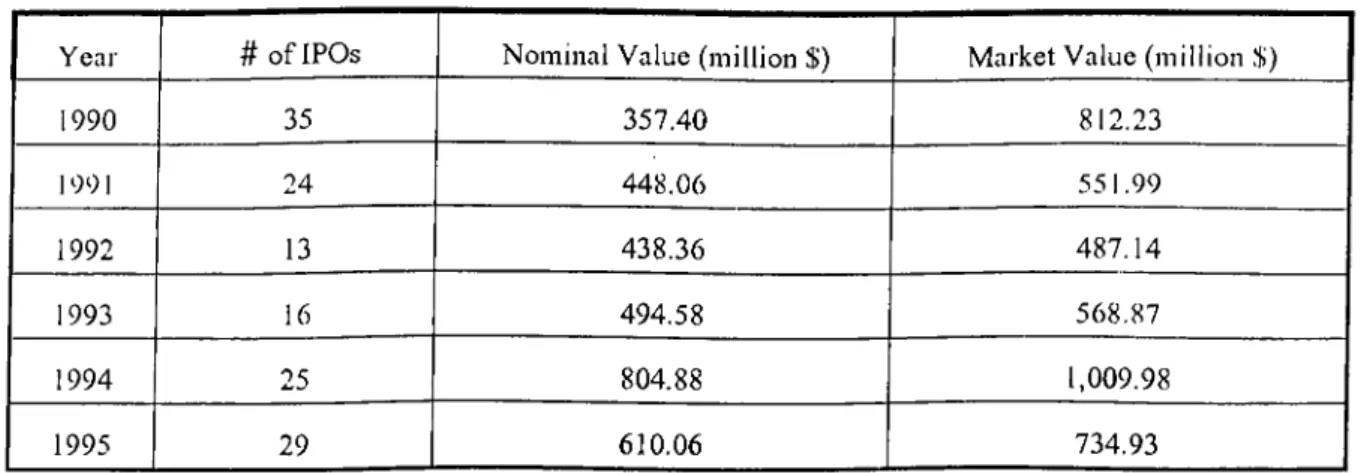
Before the establishment of Istanbul Stock Exchange (ISE), Turkish firms had very few alternatives other than bank loans to provide capital for the firm. After ISE began operations in 1985, equity finance became a bright alternative of raising equity. As the liquidity of ISE increased (Table 1), initial public offerings became a popular way of financing and showed a high performance since 1990. This allowed firms to raise capital in more favorable conditions .
2. INSTITUTIONAL SETTING
Table 1. Common Stock Issues in the Primary Market
Year # of IPOs Nominal Value (million $) Market Value (million .1))
1990 35 357.40 812.23 19 91 24 ; 448.06 551.99 1992 13 438.36 487.14 1993 16 494.58 568.87 1994 25 804.88 1,009.98 1995 29 610.06 734.93
The regulation of the primary and secondaiy markets in Turkey are established by The Capital Markets Law, enacted in 1981, which at the same time indicates the characteristics of financial instruments and the principals which the financial institutions have to practice. All firms that go public are under the supervision of The Capital Market Board (CMB), which supervises and regulates the capital markets.
According to Capital Markets Law, there are procedural requirements for every firm that wants to go public. The firms can either issue new shares as a direct issue or as an indirect issue by making use of an underwriter's service. Usually, underwriters act as financial intermediaries to a new issue. They first provide the company with procedural and financial advice, handle the administrative tasks, then underwrite the issue and finally resell and distribute it to the public. If the issuer and investment banker agree to proceed with a primary issue, experts give their assessments of the situation and investment banking firm arranges a tentative underwriting agreement with the issuer. The agreement specifies all terms of the issue except the price for the new issue.
The originator or lead underwriter, that is the investment banker which first agrees with the issuer, coordinates two groups: underwriting syndicate and the selling group, to handle the underwriting and distribution of the primary issue. Underwriting syndicate consist of some other investment bankers or brokerage firms which share the underwriting risk. The selling group is made up of some banks and brokerage firms that agree to sell the primary offering to investors.
2.1 Procedures
The CMB requires primary issues be accompanied by a registration statement which is a detailed document that presents information about the proposed financing, the firm's
history, existing business, and detailed balance sheet and income statement for three preceding years. After the CMB analyzes the registration and decides that the firm provides all the information required by the capital market law, it gets an approval. The
CMB may delay approval by requesting additional information . After the approval has been taken and p^ce has been set, the prospectus, a portion of the registration
statement, whicj.^ disclose all relevant facts that a potential investor needs to evaluate the new offering, jg reproduced in quantity and delivered to potential investors. The prospectus incl^^^gg information on the issuer's products, history and location, names and
addresses of issuer’s officers and directors and the underwriters, detailed balance sheet and incOj^g statement for three preceding years and the offering price of the issue. Circular is puljjjg]^g^ official gazette to announce that the shares of the firm will be
sold. Through period underwriter and the firm make advertisements to sell the issues that are offen.^^^p^^^ig
2.2 Underwriting Contracts
There are tv.
'O forms of underwriting contracts that are commonly used in IPOs. The first one is the 'f
rm commitment' where underwriter agrees to purchase the whole issue from the firm at
where unde
a specified price for resale to the public. The second one is the 'best efforts' rwriter acts only as a marketing agent of the firm. Underwriter acts only as an intermediai
y to sell the security to the public for a predetermined spread without carrying any risk of ^
Sales of IPOs can be made either at the stock exchange or by book building. The first transaction is made at the offer price and the margin is set at 5% for the first five trading days in sales at the stock exchange. For the next five days the margin stays at 5% and only the intermediary can quote bid order. In book building, offers are collected within the sales period and distribution of shares are made according to a fair scheme (Oztop,1996).
IPOs can be made through three basic methods by book building. Underwriters can make offers for sale at a fixed price, or tender, or a placement. In the fixed price offer, the issuing bank or intermediary fixes the price of the issue before dealings in the issue begin. Once the price is fixed, it can be neither modified in case of a changing demand for the new issues, nor withdrawn. While the applications for a specific number of shares are invited from the public, the issue is sub-underwritten by a group of financial institutions at the same fixed price. If there is excess demand, the issuer has to allocate the shares according to a fair system.
2.3 Sales Methods
In tender offers, a minimum price limit is specified and applicants are expected to state the price (at or above the minimum price) and the number of shares they wish to subscribe. After the applications have been received, a strike price is set below which the applications are rejected. If the strike price is set below the market clearing price then a system of rationing is required.
In a placement, shares are not made publicly available but instead are sold directly to a group of investors who are usually large institutions. The price of the issue is fixed before shares start trading.
2.4 Cost o f Issue
There are two components of the cost of an initial public offering: first one is the direct cost of employing the services of the underwriters, advisors, accountants, and the administrative expenses such as payment of taxes, fees for registering the new securities, printing and mailing costs; the second cost is the hidden cost of underpricing of the new issue. When the offering price is set lower than the true value of the issue, investors who buy the issue get a bargain at the expense of the firm's original stockholders. Whenever any company goes public, it is difficult for the underwriter to judge how much investors will be willing to pay the settled price for the new issue so the underwriter tries to underprice the issue to lower its exposure to risk. A number of researchers have tried to measure the extent of underpricing. The studies done throughout the world about the underpricing phenomenon are discussed in the next section.
3. LITERATURE SURVEY
Many studies examined the price performance of initial public offerings and the rationale behind the underpricing puzzle. They have used different methods of computation and set different hypothesis for the reason of underpricing phenomenon. In general, explanations of underpricing can be examined in two main groups: The first group tries to identify market imperfections. They argue that underpricing should disappear (at least partially) by eliminating or reducing them. The second group considers underpricing as an equilibrium situation and tries to propose theoretically valid explanations for the persistence underpricing. Kunz and Aggarwal (1994), present a brief review of theories that have been suggested to explain underpricing of IPOs.
3.1 Hypotheses on Underpricing o f IPOs
A. Institutional Lag Hypothesis
The underpricing of IPOs could be attributed to rising stock markets between the fixing of the offering price and the price at the first trading day
B. Risk Averse Investment Bankers Hypothesis
Since the investment bank in its function as an underwriter is interested in selling all the stock in order not to lose money, it will prefer a low issue price to keep that risk as low as possible. There is no doubt that investment banks are risk averse, but the argument is not very satisfactory because it does not explain why the issuers do not force investment bank to set a higher issue price. Three different possibilities that may explain this are: monopoly power of investment banks, investment banks' having better information, the issuers' advantage expectations from underpricing.
C. Monopoly-Power Hypothesis
The monopoly power hypothesis assumes that lack of competition among investment banks gives them a strong position to negotiate with the issuer who has to depend on them. One reason might be the fact that for the issuer, going public is a one time process. The investment bank, on the other hand, has more experience and also has important contacts with its clients. Because of its reputation, it can impose relatively unattractive conditions for the issuer. Following Ritter (1984), this monopsonic power would especially harm small, less known companies that tend to be more speculative. According to this argument, investment bankers can directly profit by setting the issue price too low: they can give these ‘gifts’ to their best clients and keep or strengthen the relationship with them. The investment bank would then earn more money on other activities. By definition monopoly power hypothesis is defensible only if there is not enough competition among various investment banks. Otherwise, the issuer could simply select the one that offers the highest net price and the best services. The banks then try to out bid each other in order to get the underwriter commissions.
D. Lack of Experience
Another explanation for underpricing is inexperience of the involved parties in an IPO. The issue price can be set very conservatively in order to sell the entire issue. High initial returns in the secondary market would therefore tend to be built into the offer price.
E. Asymmetric Information Hypothesis
Baron (1982) focuses on the asymmetry of information between the issuing firm and the investment banker. He hypothesizes that the investment banker is better informed about the market demand for the firm's securities than the firm and that underpricing is due to the fact that the investment banker is better informed about capital markets than the
issuer. Further, he argues that the reputation of the investment bank indicates quality of an IPO and can therefore generate more demand for new stocks. Although the issuer can only incompletely monitor the services provided by the investment bank, using the seivices of the investment bank is still better than attempting to bring the issue to the market itself Since the firm must compensate the investment banker for providing advice in setting the offer price for the issue and for marketing securities, the optimal offer price is a decreasing function of the uncertainty about the market demand for the issue, while the value of delegation to the underwriter is an increasing function of uncertainty. In the model, the investment bank can therefore to some extent profit from its information advantage by setting the issue price too low.
Other authors focus on the asymmetry in information between informed and uninformed potential investors. Rock (1986) assumes that markets are efficient in the way that the marginal investment in information yields a normal expected return. Potential investors can be divided mainly into two groups: First group is the investors who are better informed and thus earn abnormal returns. Second is the group of investors who rationally choose not to invest in information. In an offering, there is uncertainty about the market clearing price. If the offer price of the new issue is overpriced, only uninformed investors will submit purchase orders. Consequently, uninformed customers will be subscribed to the issues that trade at a discount in the aftermarket. If an issue is underpriced, informed investors will also submit bids and the issue is rationed. Hence, uninformed investors systematically receive more of overpriced issues and less of underpriced issues. They face a winner's curse: if an uninformed investor is allocated shares in an IPO, there is a greater than usual chance that the offering will start trading at a discount. In order to keep them as customers in the IPO market, average issue price has to be set low enough to compensate their losses caused by overpriced stocks. In equilibrium, the uninformed
investors get a risk adjusted normal return on their capital, while the informed investors get excess returns that just compensate their efforts to obtain an information advantage.
In Rock's model, the degree of underpricing is related to the ex ante uncertainty about the value of the issue. The greater the ex ante uncertainty, the greater is the number of investors who choose to become informed and so the greater is the winner's curse faced by the uninformed. Rock's model implies that riskier firms should have higher average initial returns than firms that are easier to evaluate.
Ritter (1984) supposes that high-risk IPOs are underpriced more than low risk offerings. Uhlir (1989) takes the .standard deviations of the daily stock price returns during the first 20 trading days to measure the uncertainty of an IPO. His regression with underpricing (dependent variable) and standard deviation (independent variable) leads to a highly significant results. Beatty and Ritter (1986), test two prepositions: first preposition is "The greater is the ex ante uncertainty about the value of an issue, the greater is the expected underpricing". This is supported by empirical evidence and they conclude that an issuing firm has an incentive to reduce this uncertainty by voluntarily disclosing information. The second preposition is that "Underwriters whose offerings have average initial returns that are not balanced with their ex ante uncertainty lose subsequent market share". They argue that there is an equilibrium amount of underpricing. If an investment banker underprices the issue too much, given the characteristics of the issue, the investment banker loses future offerings. If the investment banker underprices too little, he loses investors. They examine the average deviation of 49 investment bankers during the period 1977-1981 and compare subsequent performance of the 24 underwriters whose average deviation from their estimated normal underpricing is greatest with that of the remaining 25 underwriters whose average deviation is least. For the 24 with greatest deviation, their market share goes from 46.6 to 24.5 percent and five of the 24 terminate
the operations during 1981-1982. The market share of the 25 with the smallest deviation goes from 27.2 to 21.0 percent and only one of the 25 terminates the operation. These results further suggest that, there may be other factors in the market, since market share of all parties have fallen.
F. Information Cascades Hypothesis
This hypothesis state that potential investors pay attention also to other investors as well as their own information about a new issue. If an investor sees that no one else wants to buy the new issue, he may decide not to buy even when he has favorable information. Ibbotson, Sindelar and Ritter (1994) say that, an issuer may want to underprice an issue to induce the first few potential investors to buy and thereby set off a cascade in which all subsequent investors want to buy irrespective of their private information.
G. Speculative Bubble Hypothesis
When the fixed price offer cannot serve as a successful allocation for the new issues, the 'hot issues' which are characterized by a demand that largely exceeds the disposable supply of securities take place. As a result, investors who could not get enough securities in the primary market will buy them in the secondary market. Even though the offering prices of the issues are consistent with their underlying economic values, the speculation in the aftermarket push the prices above their real worth temporarily. The bubble would burst some time later and initial positive excess retmns of the IPO should be followed by negative excess returns in a short period of time.
Uhlir (1989) examines the performance of German IPOs for one year after the offer and finds a continuos underperformance between 10th and 12th months, but could not observe a sharp price drop. Ritter (1991) also detects a continuos underperfomance of
IPOs in the US for a period up to three years and the returns come out to be even negative although he includes the large initial returns of the first trading day.
H. Protection Against Legal Pursuit
Ibbotson (1975) and Tinic (1988) suggest that the issuing firms may underprice their IPOs to reduce their vulnerability to lawsuits. As there is a large uncertainty in the IPO market about the relevant information, wrong or incomplete information can lead to large loses.
To test this hypothesis, Tinic (1988) compares IPOs before and after introduction of the Securities Act in 1933. His sample of IPOs between 1923 and 1930 shows lower underpricing than those between 1966 and 1971, confirming the hypothesis. The shortcoming of the study was the lag between the time periods compared because not only the legal situation but probably many other factors might have been changed, that is why the findings has to be interpreted with caution.
Ibbotson (1975) finds a possible explanation for the underpricing that the issuer and the investment bank agree on protecting themselves against legal pursuits by setting the issue price low enough to avoid losses to investors. The underpricing could then be interpreted as an insurance premium. But there is no empirical evidence in his study.
I. Advantages for the Issuer
According to Ibbotson (1975), underpriced new issues ‘leave good taste in investors’ mouths’ so that the future underwritings from the same issuer could be sold at attractive prices although this is in contradiction to an efficient market. It is pointed out that there is no reason why investors who got a good ‘gift’ in the past, are ready to accept a price above the market price for a future security offering of the same issuer.
Another argument is that the issuers could invest in their reputation by intentionally underpricing their IPO. Keeley (1986) proposes that ‘an oversubscribed issue may carry a certain aura of success, and may even be regarded as a good marketing exercise’. In theory, this hypothesis can explain underpricing to the extent that the same amount of money would have been spent for public relations or advertising to reach a certain aim of the issuer. Kunz and Aggarwal (1994) state that it would be wrong to deny the influence of the reputation hypothesis on underpricing adding that it is however hardly possible to quantify it.
Most of these hypothesis depend on some empirical findings that investigate the performance of IPO market both in short and long-terms. In this study, short-term and long-term results of international evidence will be discussed in separate headings in order to progress in a systematic way.
3.2 Empirical Studies
3.2.1 Short-Term
Many studies suggest that initial public offerings of common stocks are priced at a discount to their subsequent trading price. Earlier studies on IPOs were done by researchers such as McDonald and Fisher (1972), Ibbotson (1975), Reilly (1977), Logiie (1973), Neuberger and Hammond (1974), and Block and Stanley (1980). Strong evidence in these studies presented the occurrence of a premium associated with the initial offering of new common stock, followed by normal market performance.
McDonald and Fisher (1972) reported significantly large returns in the first week following the offering with data on 142 new issues in the first quarter of 1969. Logue
(1973), found a 41.7% performance over one month period for the sample of 250 IPOs issued between 1965 and 1969. Neuberger and Hammond (1974), in their sample of 816 issues between 1965 and 1969 found 17.1% return in one week from the offer date. McDonald and Jacquillat (1974), studied 31 French new issues for 1968-1971. Mean offering price came out to be only slightly below mean market price in early trading, resulting in a mean market adjusted return of 3% in the first trading day. They concluded that initial price adjustment was rapid in terms of available information and that their results were consistent with the efficient market hypothesis. Ibbotson (1975), reported average underpricing of 11.4% in the first month with a t-statistic of 3.48 for the newly issued common stocks which were offered to public during the period 1960 through 1969. Block and Stanley (1980), in their study of 102 IPOs between 1974 and 1978, found an average underpricing of 5.96% which is significant at 0.01 level of significance. Neuberger and La Chapelle (1983), examined the price performance of 118 new issues between 1975 and 1980 and found an underpricing of 27.7% one week after the offering.
Ritter (1984) analyzed the 'hot issue' market of 1980, the 15 month period from .lanuary 1980 to March 1981, during which the average initial return on unseasoned new issues of common stock was 48.4%. This was in contrast to an average return of 16.3% during the 'cold issue' market comprising the rest of the 1977-1982 period. An equilibrium explanation for this difference is investigated by Ritter, but is found to be insufficient. Instead, this 'hot issue' market is found to be associated almost exclusively with natural resource issues. For firms in other industries, a 'hot issue' market was hardly apparent. Lately, Ritter in 1991, measured an average first day initial return of 14.32% for a sample o f 1526 IPOs during the period 1975-1984. Also, Ibbotson, Sindelar and Ritter (1988) observed an average underpricing of 16.4% in the period 1960-1987. Miller and Reilly (1987), examined the mispricing o f 510 IPOs with respect to daily returns, daily volume and bid-ask spreads, from the offering date to the fifth and twenty-first trading
days following the offering. The average net return of 9.87% was found to be significant at the 0.01 level. The results indicated that the market adjusts to any mispricing during the first day of public trading, and the excess returns are not available to investors in the aftermarket. Similarly, the results of Aggarwal and Rivoli (1990), indicate that if an investor had purchased each IPO at the offering date and price and held the investments for 1 day, the rate of return earned would be 10.67% higher than the return of NASDAQ index in the same time. According to Aggarwal and Rivoli, there are two possible explanations for the abnormal returns in the IPO market: 1) IPOs are underpriced at the initial offering, or 2) IPOs are temporarily overvalued by investors in early trading. They state that abnormal returns can be interpreted as evidence of underpricing only if it is shown or assumed that aftermarket for IPOs is efficient. Consequently, they claim that IPOs are underpriced more than their intrinsic values in early aftermarket trading due to overvaluations and fads, given their finding of abnormal initial returns and negative market adjusted long-term returns.
Underpricing of IPOs are also very significant in several markets other than U.S. .Tapanese market showed an initial underpricing of 51.9% for 106 IPOs during the period 1979-1984 documented by Dawson and Pliraki (1985). In Canada, Jog and Riding (1987), found the average underpricing as 11% in the first day of trading from the issuance. Moreover, it is stated that the underpricing is related to 3 variables, trading volume, business sector of the firm and the use to which funds from the offerings were put. Finn and Higham (1988), studied the joint process of initial-issue-cum-listing for 93 Australian issues on the Sydney Stock Exchange during the period 1966-1978. The average initial market-adjusted return was 29.2% with a t-statistic of 7.80. In Germany, the level of underpricing reported by Uhlir (1989) was 21.5% whereas it was only 5.1% in the Netherlands as reported by Wessels (1989). Jenkinson and Mayer (1988), further examined the extent of underpricing for 11 French issues during 1986-1987 and 20 U.K.
issues involved in privatization programs during 1979-1987. The average discount on the first day's closing market price relative to the offer price was 25.05% for French tender offers, 32.79% for 14 U.K. fixed price offers, and only 2.5% for 6 U.K. tender offers producing an average discount of 22.2% for all U.K. privatizations. In another study of U.K. market, Levis (1993), reported average first day returns of 14.3% for 712 IPOs between 1980 and 1988. In Switzerland, Kunz and Aggarwal (1994) documented that for a sample of 42 stocks that were issued in the market between 1983 and 1989, a 35.8% average initial first day return is found.
Similar short-run performances were documented for the developing markets. Dawson (1987), examined the IPOs in Malaysia, Hong Kong and Singapore. Malaysia showed the most severe underpricing about 167% for a sample of 21 IPOs in the years 1978-1983. The average underpricing in Hong Kong was 13.8% for 21 IPOs and 39.4% for 39 IPOs in Singapore. Dawson states that new issues in Malaysia, Hong Kong and Singapore are small in number, heavily oversubscribed, and characterized by extensive information becoming available about the issuer. Aggarwal, Leal and Hernandez (1993), examined three Latin American markets and documented the existence of positive average initial returns of 78.5%, 16.3%, 2.8% for Brazilian, Chilean and Mexican IPOs respectively. It is obviously documented that there exist positive average initial returns in the U.S. and other countries. However, recent evidence suggests that in the U.S. what appears to be underpricing in short-run may be overpricing when one considers long-run performances of IPOs.
There is not many studies on Istanbul Stock Exchange which examine the price performance of Turkish IPOs. However, Oztop (1996), examines the short and medium- term performances during 1994 and 1995. The average market adjusted retuin of 45 IPOs in 1994 and 1995 on the first day after the issue is reported as 5.37% with a standard
deviation of 12.58%. The average market adjusted return in medium-term of three month is found as -3.20% and standard deviation of 34.81%. He concludes that the existence of significant abnormal positive returns of new issues on the first and fifth trading days is the proof of underpricing. On the contrary, on the first and third month after the initial trading, the IPOs are overpriced since there exist significant abnormal negative returns. As a result, IPOs are considered as profitable investments in the short term, but perform quite poorly after the first month following the initial trading.
3.2.2 Medium and Long-Term
It is also important to study the performance of IPOs in the long-run for a number of reasons. Aggarwal and Rivoli (1990), note that in the short-run there are imperfections in the IPO market, such as restrictions on short selling and active price support being provided to new issues by the associated investment bankers. Ritter (1991), mentions that systematic price patterns in the long-run would raise questions concerning aftermarket efficiency. From the investors point of view the ability to develop trading strategies is of interest, and from the issuer's point of view it is the costs of going public (Aggarwal and Rivoli, 1991). The empirical evidence in the U.S. suggests that IPOs underperform in the long-run. Ibbotson (1975), reported that IPOs underperform by an average of approximately 1% per month in the second through fourth years. In like manner, Reilly (1977), found that IPOs purchased in early aftermarket trading and held for one year underperform market averages by 11.6% for his sample of 486 IPOs between 1972 and 1975. However, because his analysis period is dominated by the falling 1973-1974 market, Reilly concludes that the underperformance is due to the higher systematic risk of new issues. Ritter (1984), examined the aftermarket behavior of natural resource sector stocks. During the observation period there was a 'hot market' in this sector. He examined the aftermarket returns for natural resource stocks going public between 1977- 1982. The aftermarket returns for IPOs underperformed an index of seasoned natural
resource stocks by 15%. In addition, in his study done in 1991, Ritter found that the average three year holding period returns to be 34.47% after going public compared to 61.86% for a sample of matched firms and suggests that the IPO market may be subject to fads. Similarly, Aggarwal and Rivoli (1990), reported market adjusted returns of - 13.73% after 250 trading days for a sample of 1598 IPOs during the period 1977-1987. Underperformance was also evident in aggregate in various cross-sectional groupings based on size of issue, offering price, year of issue, and underwriter class. In Australia, Finn and Higham (1988), computed the mean compound return equivalent to a buy and hold strategy of buying new issues at the closing price of the listing month and holding through to the end of month 12. This strategy showed a mean return of -6.52% with a t- statistic of -1.87 which was not found significant. Levis (1993), in his examination of British IPOs, found a long-run performance of -30.6% in three years following the first day of trading. He then came out with a number of conclusions. First, poor aftermarket performance is said to be a persistent feature of IPOs in U.K. Second, results suggest that the long-run underperformance extends beyond 36 months. Third, there is an apparent tendency for the firms with the highest initial returns to have worst aftermarket performance. He concludes that the emerging evidence is more consistent with the proposition that while a certain level of first day returns is the result of deliberate underpricing, marked deviations from this baseline level present some form of market overreaction. In Switzerland, the study of Kunz and Aggarwal (1994), found no underperformance in long-run when initial returns are considered, tiowever, if initial returns are excluded, then the three year returns are found as negative.
The long-run results of Asian markets showed mixed results. The percentage change in the average market-adjusted price from the closing price on first day to 12 months later was -9.3% for Hong Kong, -2.7% for Singapore, +18.2% for Malaysia. Since none of
these results are significantly different from zero, Dawson (1987) concluded that the aftermarket was quite efficient.
The aftermarket performance in the Latin American countries of Brazil and Mexico showed significant long-run under performance. Investors who purchased the issues at the closing price of first trading day and held for three years received mean return of - 47.0%, -23.7% in Brazil and Chile respectively. After a holding period of one year, Mexican IPOs displayed a significant underperformance by -19.6%.
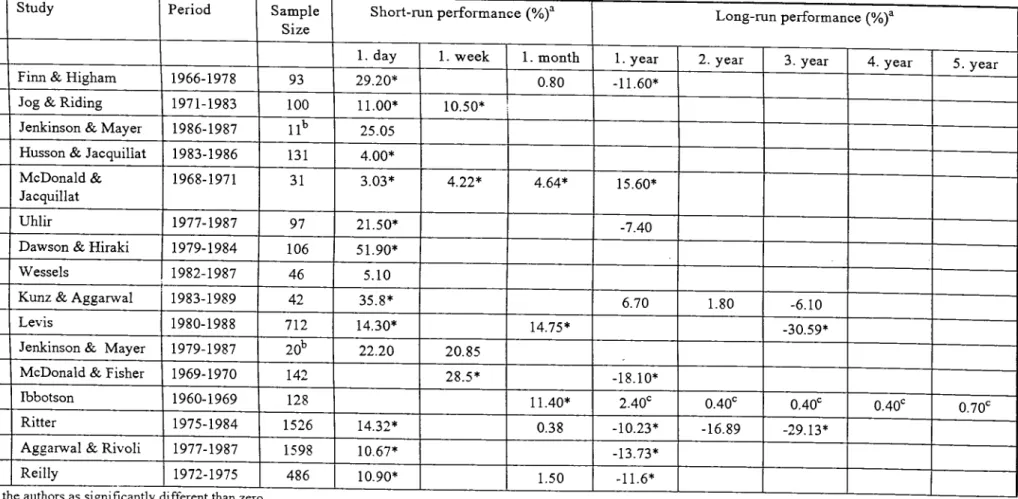
To summarize, so far the international evidence consistently finds short-term excess returns, while the long-run performances in many countries showing negative excess returns. Table 2 summarizes the results of the previous studies on IPOs throughout the world.
Table 2. Studies o f Price Performance about IPOs in World Markets A. Developed Markets
Country Study Period Sample Size
Short-run performance (%)^ Long-run performance (%)^
1. day 1. week 1. month 1. year 2. year 3. year 4. year 5. year Australia Finn & Higham 1966-1978 93 29.20* 0.80 -11.60*
Canada Jog & Riding 1971-1983 100 11.00* 10.50* France Jenkinson & Mayer 1986-1987 l l ' > 25.05
France Husson & Jacquiliat 1983-1986 131 4.00* France McDonald &
Jacquiliat
1968-1971 31 3.03* 4.22* 4.64* 15.60*
Germany Uhlir 1977-1987 97 21.50* -7.40
Japan Dawson & Hiraki 1979-1984 106 51.90* Netherlands Wessels 1982-1987 46 5.10
Switzerland Kunz & Aggarwal 1983-1989 42 35.8* 6.70 1.80 -6.10
UK Levis 1980-1988 712 14.30* 14.75*
-30.59* UK Jenkinson & Mayer 1979-1987 20’’ 22.20 20.85
USA McDonald & Fisher 1969-1970 142 28.5* -18.10*
USA Ibbotson 1960-1969 128 11.40* 2.40' 0.40' 0.40' 0.40' 0.70' USA Ritter 1975-1984 1526 14.32* 0.38 -10.23* -16.89 -29.13*
USA Aggarwal & Rivoli 1977-1987 1598 10.67* -13.73* USA
^ T r i t i u m f l
Reilly
0 n f ‘r i r \ 7 “0 oc · CM r m 1 r i /->o T r >
1972-1975 486 10.90* 1.50 -11.6*
a All results other than initial returns are exclusive o f initial returns, and are adjusted for market movements. b These results are only for firms involved in privatisation programs,
c The returns include the initial returns.
B. Newly Industrialized and Developing Countries
Country Study Period Sample Size
Short-run performance (%)^ Long-run performance (%)^
1. day l.week 1. month l.year 2.year 3.year 4. year 5.year Hong Kong Dawson 1978-1983 21 13.80 -1.90 -1.00 -9.3
Korea Kim & Lee 1984-1986 41 37.00 Korea Krinsky', Kim & Lee 1985-1990 275 79.00*
Malaysia Dawson 1978-1983 21 166.70* 3.90 6.20* 18.2 Singapore Dawson 1978-1983 39 39.40 0.00 0.60 -2.7 Singapore Koh & Walter 1973-1987 66 27.20*
Finland Keloharju 1984-1989 80 8.70 -9.80 -22.90* -26.40* Brazil Aggarwal, Leal &
Hernandez
1980-1990 62 78.5* 2.30 -9.00 -34.90* -47.00*
Chile Aggarwal, Leal & Hernandez
1982-1990 19 16.30 5.60 1.10 -2.00 -23.70
Mexico ♦ U.r
Aggarwal, Leal & Hernandez
1987-1990 44 2.80 21.60 -19.60
â All results otHer thun initial returns are exclusive o f initial returns, and are adjusted for market movements, b These results are only for firms involved in privatisation programs.
4. RESEARCH METHODOLOGY
4.1 Purpose o f the Study
The purpose of this study is to examine both the initial and aftermarket performance of IPOs to test for departures from market efficiency in Turkish Stock Market. If any inefficiencies are uncovered in the aftermarket, investors can make arbitrage profits.
The sample of new issues are selected from underwritten offerings that are initially offered to public which are registered to the Capital Market Board during the period .Tanuary 1990-October 1993. The sample of IPOs are taken from the ISE sources. The sample consists of 64 IPOs out of the 87 IPOs issued in this period. The rest were not considered because of two reasons: either the stock was in the regional market or the data on the stocks were insufficient or incorrect.
There are mainly two objectives of the study:
i. to measure the short-run performance which consists of the initial return (l.day), second, third, fourth, fifth trading day return (1. week), second week return, third week return, first month return, second month return, and third month return.
ii. to measure the aftermarket performance subsequent to listing, where six month return and one year return are observed.
The returns are calculated from daily data which is adjusted for capital increases and dividends. Istanbul Stock Market Index (ISEI) is chosen to be the benchmark of the study. The returns are defined as the natural logarithm of the ratio o f the closing price of day t to the closing price of the previous day t-1, less the equivalent change in the
appropriate benchmark (ISEI). The first day adjusted return is defined as the logarithm of the percentage change in price from the offering date to the close at the first day of trading less the equivalent change in the appropriate benchmark which is the Istanbul Stock Exchange Index (ISEI).
4.2 Assumptions o f the Study
We assume that daily returns of selected IPOs follow a normal distribution in the whole population. In addition, the volume of the offering is not taken into consideration. As a result, volume effect on the performance is neglected.
4.3 Time Period o f the Study
The sample of 64 IPOs out of 87 IPOs issued in the continuous .lanuary 1990- December 1993 are taken for the analysis. IPOs for which continues price data are not available are excluded from the sample. 22 out of 35 IPOs in 1990, 20 out of 23 IPOs in 1991, 10 out of 13 IPOs in 1992 and 12 out of 16 IPOs in 1993 are used for the study. Short-run performances are analyzed considering the first, second, third, fourth, fifth trading days; second, third, fourth weeks and second, third months after the firms are listed in the Istanbul Stock Exchange. Medium and long-term performances are examined in six months and one year following the listing.
4-4 Data o f the Study
This study investigates the aftermarket performance of 64 firms in total. Stocks issued between 1990-93 can be grouped into 17 groups when the operating industries are taken into consideration. 9 of the companies are in the industry of glass, cement and ceramic. There are 7 companies in each of the following industries: 1) chemical, petroleum, rubber and plastic products production, 2) textile and leather, 3) metal
work, machine and equipment fabrication, 4) banking. In addition, 5 firms are functioning in each of the industry of paper, paper products, printing and publication; and financial institutions like holdings and investment firms. There are 4 firms in leasing and factoring firms category as well. Furthermore, in each of the four categories: primary metal industry; sector of electric, gas and water; restaurants and hotels; and insurance firms, 2 IPOs from the sample are covered. Moreover, only one firm from the groups: food industry, wood work industry, retail trading, wholesale trading are included in the sample.
IPOs in the sample were either sold as offers for sale at a fixed price or tender. The volume of the offerings in the sample for 1990-93 period adds up to 5,282,281,560,000 TL (Appendix 1.). In 1990, total number of shares issued for the 22 IPOs were 433, 899,014 producing 2,476,863,265,000 TL. In 1991, a visible decline in both the number of shares issued and the total proceed is seen as 99,979,790 shares and 844,512,220,000 TL. respectively. Subsequently in 1992, 90,930,975 shares supplied proceeds of 508,906,075,000 TL. Lastly in 1993, proceeds were 1,452,000,000,000 TL with 183,450,000 shares.
4.5 Methodology o f the Study
Numerous studies were done throughout the world that examined the initial and aftermarket performance of IPOs and tried to solve the underpricing puzzle. The market model used by: McDonald-Fisher (1972), Ritter (1991), Levis (1993), Aggarwal-Leal-Hemandez (1993), Peavy (1990) is chosen to be applied for the computation of short- and long-mn price performances.
Adjusting the security prices for market wide movements on individual stock returns is said to be a general problem that take considerable attention. Estimating the parameters of Sharpe-Linter-Mossin capital asset pricing model for each security and
interpreting the residual in each period, arjt, as an abnormal return of stock j, is a useful procedure.
"" ccj + Pj Rmt + arjt (1)
In this study, the transformation of stock returns to excess returns in equation (2) serves to adjust roughly for market effects on IPO returns to investors.
arjt “ Kjt - Rmt (2)
where, Rjt is the return on stock j in day t, and Rmt is the return on the benchmark in the same period.
Rjt= In (Pj,t/Pj,t-1) (3)
where, Pj,t is adjusted closing price of stock j on day t Pj,t-l is adjusted closing price of stock j on day t-1
The return on the benchmark Rm,t is defined in a similar fashion as the natural logarithm of the percentage change in ISE composite index .
Rmt = In (Pm,t / Pm,t-l) (4)
where, Pm,t is the closing price of ISEI on day t Pm,t-1 is the closing price of ISEI on day t-1
Then, the average benchmark adjusted return on a portfolio of n stocks for event day t is the equally-weighted arithmetic average of the benchmark adjusted retiu'ns:
ARt = arji) / n
j=l
(5)
The cumulative benchmark adjusted aftermarket performance from the beginning of the first day of trading to day s is the summation of the average benchmark adjusted returns from the first day of trading to day s:
CARi,s = ^ A R t (6)
t=l
Hypothesis Testing
The hypothesis that, "Investors obtain initial positive abnormal returns relative to the market because of underpricing issue. In long-term, however, they encounter underperformance with respect to the market." will be tested by the examination of price changes with respect to the return of the ISEI.
Short term; Ho: no positive abnormal returns exist in short term relative to the market
Ha: there exist positive abnormal returns in short term relative to the market
Long term: Ho: no underperformance of IPOs exist in long term
Ha; IPOs underperform in long term
The significance of the results will be tested by using t-test. Aftermarket performances of the sample IPOs are being observed for 1 year (255 trading days) m order to compare results with the international studies.
Hypothesis is tested by the natural logarithm of percentage price changes of sample IPOs which were adjusted for capital increases (to have a reliable set of returns for the studied period).
For the null hypothesis to be tested that the mean day t abnormal return is smaller or equal to zero, we compute t-statistic as:
t = ARi / a (ARt) (7)
where
a
(ARt) is the standard deviation of the sample mean on day t.To test whether the cumulative abnormal return from day tl until day t2 is significantly positive, we compute the statistical significance of CAR by t-test:
t = CAR /ct(CAR)
CT (CAR) = a (ARt)*(t2-tl+l)l^2
(8)
(8.1)
5. FINDINGS AND DISCUSSION
We will examine return performances in two sections: short-term and medium-long- term. The returns of first, second, third, fourth and fifth (1 week) trading days followed by second, third and fourth weeks and second and third months are reported in the short-term price performance section. The medium- and long-term include the sixth month and one year returns from the offering date. The data is composed of 22 IPOs out of 35 in 1990, 20 IPOs out of 23 in 1991,10 IPOs out of 13 in 1992 and 12 IPOs out of 16 in 1993. The rest of the IPOs was not analyzed because of the data unavailability. The average returns, the cumulative average returns and the corresponding t-statistics of this study for the years 1990-1993 are given in tabular form. The following tables contain the results both for the short-term and for the medium- and long-term price performances.
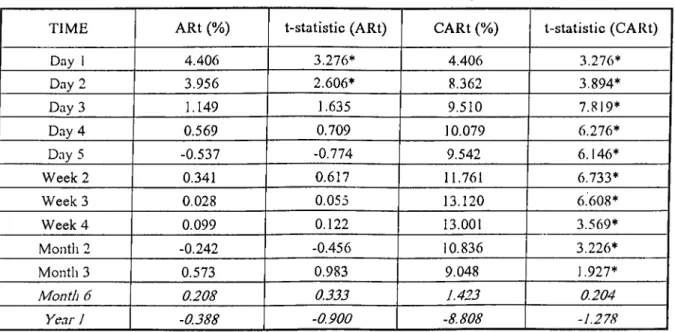
Table 3. Performance o f IPOs in 1990-1993 (N=64)
TIME ARt (%) t-statistic (ARt) CARt (%) t-statistic (CARt)
Day 1 4.406 3.276* 4.406 3.276^ Day 2 3.956 2.606* 8.362 3.894* Day 3 1.149 1.635 9.510 7.819* Day 4 0.569 0.709 10.079 6.276* Day 5 -0.537 -0.774 9.542 6.146* Week 2 0.341 0.617 11.761 6.733* W eeks 0.028 0.055 13.120 6.608* Week 4 0.099 0.122 13.001 3.569* Moiitli 2 -0.242 -0.456 10.836 3.226* Month 3 0.573 0.983 9.048 1.927* Month 6 0.208 0.333 1.423 0.204 Year 1 -0.388 -0.900 -8.808 -1.278
Significant at 0.05 significance level and 63 degiees o f freedom (t critical = 1.645)
Table 4. Performance o f IPOs in 1990 (N=22)
TIME ARt (%) t-statistic (ARt) CARt (%) t-statistic (CARt)
Day 1 1.953 1.194 1.953 1.194 Day 2 1.956 2.219* 3.909 3.135* Day 3 0.820 1.034 4.729 3.444* Day 4 -0.046 -0.033 4.683 1.657 Day 5 0.102 0.099 4.783 2.068* Week 2 0.479 0.516 3.010 1.026 W eeks 0.555 0.702 2.513 0.820 Week 4 0.915 0.464 A.125 0.536 Month 2 -1.508 -2.197 4.031 0.929 Month 3 0.512 0.643 1.102 0.172 Month 6 0.875 0.877 6.217 0.557 Year I -0.432 -0.462 -6.42! -0.41!
^ Significant at 0.05 significance level and 21 degrees o f freedom (t critical -- 1.721)
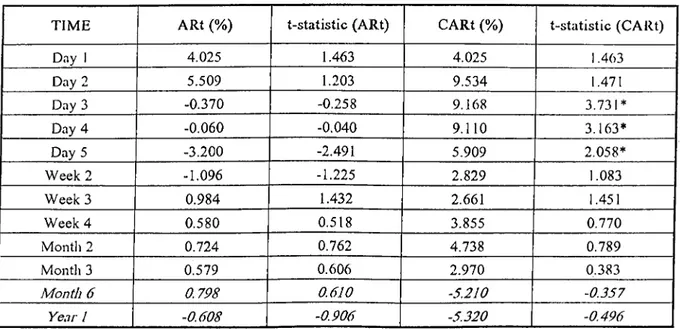
Table 5. Performance o f IPOs in 1991 (N=20)
TIME ARt (%) t-statistic (ARt) CARt (%) t-statistic (CARt)
Day I 4.025 1.463 4.025 1.463 Day 2 5.509 1.203 9.534 1.471 Day 3 -0.370 -0.258 9.168 3.731* Day 4 -0.060 -0.040 9.110 3.163* Day 5 -3.200 -2.491 5.909 2.058* Week 2 -1.096 -1.225 2.829 1.083 W eeks 0.984 1.432 2.661 1.451 Week 4 0.580 0.518 3.855 0.770 Month 2 0.724 0.762 4.738 0.789 Month 3 0.579 0.606 2.970 0,383 M onth 6 0.798 0.610 -5.210 -0.357 Year I -0.608 -0.906 -5.320 -0.496
* Significant at 0.05 significance level and 19 degrees o f freedom (t critical = 1.729)
Table 6. Performance o f IPOs in 1992 (N=10)
TIME ARt (%) t-statistic (ARt) CARt (%) t-statistic (CARt)
Day 1 5.343 2.897* 5.343 2.897* Day 2 0.242 0.149 5.586 2.434* Day 3 -0.401 -0.213 5.184 1.590 Day 4 -1.305 -0.789 3.879 1.185 Day 5 0.168 0.790 4.647 2.138* Week 2 -0.220 -0.100 4.443 0.715 Week 3 0.141 0.073 1.(511 1.017 Week 4 -0.458 -0.526 5.471 1.407 Month 2 0.661 0.439 -1.110 -0.119 Month 3 -1.895 -1.866 -4.081 -0.489 Month 6 -1.645 -1.367 -11.470 -0.860 Year 1 -2.783 -1.907* ■ -32.262 -L 3 9 0
‘ Significant at 0.05 significance level and 9 degrees o f freedom (t erilieal = 1.833)
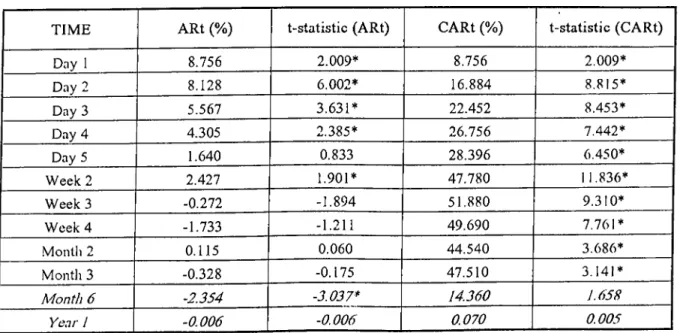
Table 7. Performance o f IPOs in 1993 (N=12)
TIME ARt (%) t-statistic (ARt) CARt (%) t-statistic (CARt)
Day 1 8.756 2.009* 8.756 2.009* Day 2 8.128 6.002* 16.884 8.815* Day 3 5.567 3.631* 22.452 8.453* Day 4 4.305 2.385* 26.156 7.442* Day 5 1.640 0.833 28.396 6.450* Week 2 2.427 1.901* 47.780 11.836* Week3 -0.272 -1.894 51.880 9.310* Week 4 -1.733 -1.211 49.690 7.761* Month 2 0.115 0.060 44.540 3.686* Month 3 -0.328 -0.175 47.510 3.141* Month 6 -2.354 -3.037* 14.360 1.658 Year I -0.006 -0.006 0.070 0.005
* Sigiiificaiil at 0.05 significance level and 11 degrees o f ficedom (t critical - 1.796)
5.1 Short-Term Results
As the whole 1990-1993 period is considered, it is seen that 49 out of 64 IPOs produced positive returns in the first day of trading whereas 15 showed negative performances when compared with the return of market index. In this whole period, Facto Finans Factoring had the highest return of 44.37% and Esbank had the lowest return o f -21.79%. The average market adjusted return on the first trading day was 4.406% with a t-ratio of 3.276 which is found to be significant at 0.05 significance level. The critical t-ratio for one sided test at 0,05 significance level and 63 degrees of freedom is 1.645. Second day after the trading also showed high significant returns with an average adjusted return (AR2) of 3.956% and a t-statistic of 2.606. Third day's ARj was 1.149% and the corresponding t-ratio was 1.635. After the third day, the ARt decreased under 1% level being 0.569%, -0.537% for the fourth and fifth trading days, but the cumulative average return (CARt) were 10.079% and 9.542% with t- statistics of 6.276 and 6.146 respectively. At the end of second week, CAR found to be 11.761% with a t-ratio of 6.733. In the third week the CAR was 13.120, having a t-ratio of 6.608. CAR appears to be 13.001% in the fourth week obtaining a t-statistic of 3.569. Second month, CAR was 10.836% and the corresponding t-ratio being 3.266. Positive CAR still continue in the third month with 9.048% and still significant. To summarize, in the first two days of trading IPO market exercise high and significant positive average returns. Although the average returns drop down to insignificant levels afterwards, the significance of cumulative average returns continue up to the end of month 3.
If we investigate the results year by year; in 1990, it is found that 18 IPOs out of 22 showed positive excess returns in the first day of trading and only 4 IPOs indicated negative returns. The average adjusted first day return come out to be 1.953% with a t-ratio of 1.194 which is not significant at 0.05 significance level, critical t-value being 1.721 for 21 degrees of freedom and 0.05 level. Second day performance
showed nearly similar AR with 1.956% which was now significant. Average adjusted return in the third day was 0.820% followed by a negative return in the fourth day with -0.046%. The CARs for weeks one, two, three and four were 4.785%, 3.010%, 2.513%, 4.725% respectively which were all insignificant. The second and third month results showed a decreasing trend with CAR of 4.031% and 1.102% which were not significant at 0.05 level either.
For the analysis of 20 IPOs issued in 1991, 14 of them exercised positive returns in the first day of trading and the average adjusted first day return appeared to be 4.025% with an associated t statistic of 1.463. The first day return was not significant because the critical t-value for 19 degrees of freedom and 0.05 significance level was 1.729. Second, third, fourth and fifth day average returns are in a decreasing trend being 5.509%, -0.37%, -0.06%, -3.2% respectively. Second week after the first trading, CAR was found to be 2.829% which is not significant. Third and fourth week cumulative average returns were 2.661% and 3.855%. After the second month with a CAR of 4.738%, returns display a decreasing trend, being 2.970% in month 3 and negative values in medium- and long-term.
In 1992, 9 out of 10 IPOs led positive excess returns in the first day of trading. The average first day return was 5.343% that is significant with a t-ratio of 2.897. The critical t-value is 1.833 for 9 degrees of freedom and 0.05 level of significance. The aftermarket adjusts rapidly having a second day average return of 0.242% with a t- ratio of 0.149. The cumulative average returns for third, fourth, fifth days are, 5.184%, 3.879%, 4.647% respectively. Similarly, CARs for weeks two, three and four are calculated as, 4.443%, 7.027%, and 5.471% in the order. Later, in the second and third months, the CAR falls to negative values o f -1.11% and -4.081% although they are insignificant.