FACTORS IMPACTING BANK NET INTEREST MARGIN AND THE ROLE OF MONETARY POLICY: EVIDENCE FROM TURKEY
A Master’s Thesis
by
MUHAMMED HASAN YILMAZ
Department of Management
İhsan Doğramacı Bilkent University Ankara January 2017 MUH AMMED HA S AN YI LMAZ F ACTO R S I MP ACTI NG B AN K N ET B il ke nt Univer sit y 2017
FACTORS IMPACTING BANK NET INTEREST MARGIN AND THE
ROLE OF MONETARY POLICY: EVIDENCE FROM TURKEY
The Graduate School of Economics and Social Sciences
of
Bilkent University
by
MUHAMMED HASAN YILMAZ
In Partial Fulfillment of the Requirements for the Degree of
MASTER OF SCIENCE
THE DEPARTMENT OF
MANAGEMENT
BILKENT UNIVERSITY
ANKARA
January 2017
v
ABSTRACT
FACTORS IMPACTING BANK NET INTEREST MARGIN AND THE
ROLE OF MONETARY POLICY: EVIDENCE FROM TURKEY
Yılmaz, Muhammed Hasan M.S., Department of Management
Supervisor: Assoc. Prof. Dr. Süheyla Özyıldırım
January 2017
In this thesis, we study factors affecting net interest margin (NIM) of commercial banks
in Turkey. Especially, our results highlight the relation between unconventional monetary
policy shocks and bank margins. To this end, first, we conduct an identification analysis
about which parameters of asymmetric interest corridor framework are important in
explaining variations in NIM. Using industry-level data, we show that there exists a pass
through from BIST interbank overnight repo/reverse repo market rate and weighted
average cost of funding (WACF) to bank loan and deposit rates. As a result of
reduced-form Vector Autoregression (VAR) analysis we find the existence of a transmission
mechanism from BIST rate and WACF to commercial loan rate, consumer loan rate and
deposit rate. Same pass through to loan and deposit rates is also shown in individual bank
level with the Panel Vector Autoregression (Panel VAR) analysis in the case of 16
commercial banks in Turkey during the period 2011Q1-2016Q1. After the identification
analysis, we examine the relationship between NIM and policy rates through System
vi
related and macroeconomic factors. We find that a change in the monetary policy rate has
significant and positive impact on NIM. Among bank-specific factors, equity ratio and
operating expenses are found to be significantly affecting NIM during the sample period.
Our empirical findings also stress the significance of lag values of NIM. Estimations
conducted with standardized variables indicate that economic significance of lag values
and bank specific variables are larger than that of policy.
Keywords: Monetary Policy, Net Interest Margin, Panel Data Analysis, Pass-Through,
vii
ÖZET
BANKA NET FAİZ MARJLARINI ETKİLEYEN FAKTÖRLER VE
PARA POLİTİKASININ ROLÜ: TÜRKİYE HAKKINDA BULGULAR
Yılmaz, Muhammed Hasan Yüksek Lisans, İşletme Bölümü Tez Yöneticisi: Doç. Dr. Süheyla Özyıldırım
Ocak 2017
Bu tezde Türkiye bankacılık sektörünün net faiz marjı (NFM) üzerinde etkili olan
faktörler incelenmektedir. Özellikle, geleneksel olmayan para politikası şokları ile banka faiz marjları arasındaki ilişki çalışılmıştır. Bu amaçla öncelikle asimetrik faiz koridoru çerçevesinin hangi parametrelerinin banka NFM’lerindeki değişimleri açıklamada önemli olduğunu belirlemek için bir tanımlama analizi yapılmıştır. Toplu sektör verisiyle yapılan analizde, BIST bankalararası gecelik repo/ters repo piyasası faiz oranından ve ağırlıklı ortalama fonlama faizinden; banka kredi ve mevduat faizlerine geçişkenlik olduğu gösterilmiştir. İndirgenmiş form Vektör Özbağlanım Analizi sonuçlarına göre; BIST faizinden ve ağırlık ortalama fonlama faizinden; ticari kredi, tüketici kredisi ve mevduat faizlerine doğru bir aktarım mekanizması bulunmaktadır. Aynı geçişkenlik, 16 mevduat bankasının verileriyle 2011Q1-2016Q1 dönemi için yapılan Panel Vektör Özbağlanım analiziyle de kanıtlanmıştır. Tanımlama analizinden sonra; NFM ve politika faizleri arasındaki ilişki bankaya özgü, sektörle ilgili ve makroekonomik nitelikteki faktörler kontrol edilerek, Sistem Momentler Metodu teknikleri kullanılarak incelenmiştir. Para
viii
politikası faizlerindeki değişimin NFM’yi anlamlı ve pozitif yönde etkilediği bulunmuştur. Bankaya özgü faktörler arasında, sermaye oranı ve operasyonel
maliyetlerin örneklem döneminde marjları anlamlı bir şekilde etkilediği bulunmuştur. Ampirik sonuçlar, NIM’in gecikmeli değerlerinin anlamlı olduğunu göstermektedir. Standardize edilmiş değişkenlerle yapılan tahminler, gecikmeli değerlerin ve bankaya özgü faktörlerin iktisadi anlamlılık düzeylerinin politika faizlerinkinden yüksek olduğunu göstermektedir.
Anahtar kelime: Faiz Geçişkenliği, Net Faiz Marjı, Para Politikası, Panel Veri Analizi,
ix
ACKNOWLEDGEMENTS
First of all, I would like to express my deepest gratitude to my supervisor Assoc. Prof. Süheyla Özyıldırım for her continuous guidance and encouragement during my graduate study. Her contributions and critiques helped me extensively, especially when I face
obstacles in the analysis and writing phases. It has been a great honor for me to study
under her supervision and I feel privileged to be among her students.
I am also grateful to Prof. Dr. Nadir Öcal and Assist. Prof. Tanseli Savaşer for accepting to read my thesis and participating in my thesis committee. Their invaluable suggestions
strengthen the content and results of this thesis.
I would like to thank my family and my parents. Their unconditional love and support are
my biggest assets.
I wish to express my gratitude to İbrahim Ethem Güney for his support and vision. He
has been a mentor to me rather than a manager. I am indebted to my colleagues Yavuz Selim Hacıhasanoğlu, Doruk Küçüksaraç and Oğuzhan Çepni not only for their friendship but also for their contributions to the data and methodology of this study.
Special thanks are presented to Hakan Atasoy for sharing his knowledge and experience
with me, especially during the research idea formulation process.
I would like to thank TÜBİTAK for the financial support that they provided for my graduate study.
x TABLE OF CONTENTS ABSTRACT………...………v ÖZET……….vii ACKNOWLEDGMENTS………..ix TABLE OF CONTENTS………x LIST OF TABLES……….xi LIST OF FIGURES………...xii CHAPTER I: INTRODUCTION……….1
CHAPTER II: LITERATURE REVIEW………8
2.1 Theoretical Literature……….……..10
2.2 Empirical Literature………….………14
2.3 Empirical Literature for Turkey………...17
2.4 Bank Interest Rate Channel and the Role of Interest Rates for NIM………..18
CHAPTER III: BANK PROFITABILITY RATIOS AND FINANCIAL STABILITY...22
CHAPTER IV: POLICY RATE AND LOAN/DEPOSIT RATES………...34
4.1 Interest Rate Corridor System in Turkey……….35
4.1.1 Motivation……….35
4.1.2 New Framework………39
4.1.3 The Mechanism……….40
4.1.4 Empirical Evidence………...47
4.2 Transmission Mechanism of Policy Rates on Industry Level……….48
xi
CHAPTER V: DATA, EMPIRICAL MODEL AND METHODOLOGY………65
5.1 Data and Model………65
5.2 Methodology………70
CHAPTER VI: EMPIRICAL RESULTS………..74
CHAPTER VII: CONCLUSION………...82
REFERENCES………..85
APPENDIX A: Cross Country Comparison of Ratios Related to Bank Equity and Financial Deepening………..91
APPENDIX B: Determination of BIST Overnight Rate through Fund Demand and Supply Interaction………..92
APPENDIX C: KPSS Test Results………93
APPENDIX D: Diagnostics and Lag Length Criteria for VAR Estimations…………...94
APPENDIX E: Impulse Response Functions………96
APPENDIX F: Correlation Matrix………...98
APPENDIX G: Details of Other Operating Expenses………..99
xii
LIST OF TABLES
1. Summary Statistics and Sources for Variables Used in VAR Estimation……….49
2. ADF Test Results………...50
3. Multiple Breakpoint Test Results and Number of Estimated Breaks………52
4. Information About Banks in the Sample of Panel VAR Analysis ………58
5. Summary Statistics and Sources for Variables Used in Panel VAR Estimation……...59
6. Panel Unit Root Test Results……….61
7. Definition and Sources of Data Series Used in Panel Data Analysis………69
8. Summary Statistics of Variables in Panel Regressions……….70
9. System GMM Results………75
10. System GMM Results………..79
xiii
LIST OF FIGURES
1. Spread Between Average Lending and Deposit Rate………4
2. Return on Assets………4
3. Volatility Index and Its Standard Deviation……….24
4. Growth Rate of Commercial Bank Deposits………24
5. Credit Default Swap Spreads………25
6. Volatility of Stock Indices of Selected Developed Countries………...25
7. Net Income………29
8. Components of Net Income………..29
9. Components of Non-Interest Items and Branch Network……….30
10. Number of Employees in the Banking Sector……….30
11. NPL Provisions and Profit/Loss from Capital Markets Operations………31
12. ROA and ROE……….31
13. FED Balance Sheet Size………..36
14. Total Loan Growth………..37
15. CPI Adjusted Real Effective Exchange Rate………..37
16. Current Account Deficit to GDP……….37
17. Policy Tools and Goals of CBRT in New Framework………39
18. Official Interest Corridor Parameters………..41
19. Funding Composition of CBRT………..44
20. Total Payables to CBRT………..44
21. CBRT Weighted Average Cost of Funding and BIST Interbank Overnight Rate…..46
22. Accumulated Response of Commercial Loan Rate to One Unit Cholesky Standard Deviation Impulse in BIST Rate………54
23. Accumulated Response of Consumer Loan Rate to One Unit Cholesky Standard Deviation Impulse in BIST Rate………54
xiv
24. Accumulated Response of Deposit Rate to One Unit Cholesky Standard Deviation Impulse in BIST Rate……….55 25. Accumulated Response of Commercial Loan Rate to One Unit Cholesky Standard Deviation Impulse in WACF……….56 26. Accumulated Response of Consumer Loan Rate to One Unit Cholesky Standard Deviation Impulse in WACF……….56 27. Accumulated Response of Deposit Rate to One Unit Cholesky Standard Deviation Impulse in WACF………..56 28. Response of Loan Rate to One Unit Standard Deviation Impulse in BIST Rate……63 29. Response of Deposit Rate to One Unit Standard Deviation Impulse in BIST Rate…63 30. Response of Loan Rate to One Unit Standard Deviation Impulse in CBRT
WACF………64 31. Response of Deposit Rate to One Unit Standard Deviation Impulse in CBRT
1
CHAPTER I
INTRODUCTION
Financial institutions have been performing a valuable role in the functioning of modern
economies. As a core component of financial system, banks provide an intermediation
between savers like households and fund users like firms and government. By collecting
deposits and extending loans, savings in an economy can be more efficiently allocated to
real investment through which economic growth can be achieved.
Several values created by banking services are the reasons behind the efficiency of the
financial intermediation process. One value is about the information asymmetry.
Financial transactions between lenders and borrowers can be subject to certain costs
caused by informational asymmetry. Especially when informational asymmetry exists in
the pre-contract period, then adverse selection problem could happen. In this context,
financial institutions can sort out the differences between credit-worthiness of borrowers.
If informational asymmetry occurs in post-contract period, then moral hazard costs will
2
Hence, when savers provide funds to users, some action should be taken about the proper
use of funds given the fact that several risky projects are available with differing risk and
return prospects. Since individual lenders are constrained by information asymmetry,
they tend to avoid bearing monitoring cost. This tendency of being a free-rider in lending
market would result in no monitoring action (Allen & Carletti, 2008). Financial
institutions can undertake this function as they have the benefit of size.
Second value is about reducing liquidity concerns and price risk about financial assets.
Banks are traditionally used as a platform for making transactions on debt and equity
instruments. When a financial asset is less liquid, meaning that it is not easily convertible
into cash; then there could be price risk. In other words, illiquid assets would have a sale
price which will be lower than the purchase price of the same assets. Banks can decrease
price risk as they diversify away some part of their portfolio risk by holding a vast
number of financial securities in their portfolio. Financial institutions are also known to
have other functions such as maturity intermediation, transmission of monetary policy
and payment services.
Considering the fact that financial institutions have valuable contributions to the
functioning of the financial system, tracking the efficiency of financial intermediation
holds an importance. Bank profitability is an informative aspect of this efficiency. In the
literature, bank profitability measured by net interest margin (NIM) is taken as an
indicator of efficiency. However, wider interest margins are regarded as having negative
implications on the intermediary role of collecting deposits and allocating loans. In the
case of higher margins, savers would be less encouraged to deposit funds due to lower
3
Such a situation would harm the financial deepening and development through financial exclusion. For instance, Demirgüç-Kunt and Huizinga (2000) find that banks tend to have higher margins in underdeveloped financial systems, while no such relation is observed
in developed countries. Higher margins would also restrain the level of real savings and
investments (Brock & Suarez, 2000; Barajas, Steiner, & Salazar, 1999). On the other
hand, bank profitability may have positive impacts on capital adequacy ratios by
increasing capital accumulation. Hence, banking system of a country can be strengthened
in the form of higher capital buffers against external shocks (Brock & Suarez, 2000; Barajas et al., 1999). These side effects of the trend in profitability of banking sector
emphasize the importance of the investigation of possible determinants of NIM,
especially for the policy implication.
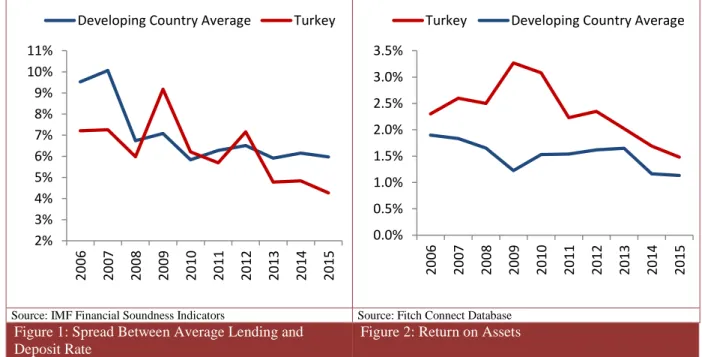
When the cross-country data for the Turkey and emerging markets is examined, in terms
of the changes in bank spread1 (ex-ante definition of NIM) and return to asset ratio2 (as
an indicator of bottom-line profitability), we observe that bank margins and profitability
in Turkey has a unique feature. As it can be seen in Figures 1 and 2, interest margins have
been decreasing both for Turkey and developing countries. However, the speed at which
bank margin is contracting is different. Spread is being narrowed at a faster pace in
Turkey than other developing countries. As a different measure of bank profitability,
return on asset ratio is also decreasing for Turkey and other emerging markets. However,
when we examine the last decade, we see that the decrease in bank profitability is higher
1 In Figure 1, developing countries’ average spread gives the mean value for 11 developing countries which
are Argentina, Brazil, Indonesia, Latvia, Mexico, Poland, Romania, Russia, Slovak Republic, South Africa and Uruguay.
2 In Figure 2, developing countries’ average ROA gives the mean value for 19 developing countries which
are Argentina, Brazil, Chech Republic, China, Indonesia, Morocco, Philippines, South Africa, Colombia, Hungary, Malaysia, Mexico, Peru, Poland, Romania, Russia, Chile, Thailand and Ukraine.
4
for Turkey than other countries. This divergence of Turkey from peer countries is
especially evident after 2011.
Source: IMF Financial Soundness Indicators Source: Fitch Connect Database
Figure 1: Spread Between Average Lending and Deposit Rate
Figure 2: Return on Assets
Simultaneously, Turkey is following a different trend than other emerging markets in
terms of financial development and access to bank financing which might be considered
as side effects of profitability of banking sector. Appendix A illustrates bank credits
extended to private sector (as a percentage of GDP) and the banking sector assets (as a
percentage to GDP) for Turkey and selected emerging countries. It also presents equity to
assets ratio for the banking systems as well as the capital adequacy ratio calculated by
dividing the equity to risk weighted assets. From these figures, it can be inferred that not
only in terms of profitability but also with respect to the financial deepening and bank
capitalization, Turkish banking system is displaying a divergence.
After the end of 2010, Turkey has been exercising an asymmetric interest corridor system
with active liquidity management in which there is more than one short term rate which
2% 3% 4% 5% 6% 7% 8% 9% 10% 11% 20 06 20 07 20 08 20 09 20 10 20 11 20 12 20 13 20 14 20 15
Developing Country Average Turkey
0.0% 0.5% 1.0% 1.5% 2.0% 2.5% 3.0% 3.5% 20 06 20 07 20 08 20 09 20 10 20 11 20 12 20 13 20 14 20 15
5
may be qualified as policy rate including BIST overnight repo/reverse repo interest rate
and CBRT weighted average cost of funding (WACF). Through active liquidity policy of
Central Bank of Turkey (CBRT), the monetary policy stance can be altered at a daily
frequency manifested in several rates. Thus, parameters of corridor system of CBRT do
seem relevant in the process of monetary policy transmission. By means of the pass
through towards loan and deposit rates, monetary policy rates are expected to influence
bank profitability. Thus, in this thesis, we aim to explore statistical and economic
significance of this recent unconventional monetary policy on net interest margins
(NIMs) of commercial banks in Turkey for the period 2011Q1-2016Q1. First, we identify
which policy rates might be used in our empirical model to examine NIM. Hence, an
important part of this thesis is devoted to examine which short term rates have
explanatory power for NIM. Within this context, the level of pass through from identified
policy rates to bank loan and deposits rates is investigated to test whether policy rate has
significance in the pricing of loans and deposits, i.e., the calculation of bank NIM.
We may summarize our main research questions as follows:
Which parameters of the asymmetric interest corridor system are important in explaining bank NIM?
What are the other determinants of bank NIM in Turkish banking sector for the period between 2011Q1 and 2016Q1.
According to our empirical analysis, BIST overnight rate and WACF are found as key
policy rates in explaining NIM. When we examine the deposit and loan rates of
6
statements, we observe that any shock to BIST rate and WACF are transmitted
significantly to loan and deposit rates during the period 2011Q1-2016Q1. Thus, for the
period when asymmetric interest corridor is exercised, BIST overnight rate and WACF
are considered as relevant parameters for examining the effect of unconventional
monetary policy on net interest margins of commercial banks in Turkey.
Dynamic panel estimations for net interest margin show that BIST overnight repo/reverse
repo interest rate and CBRT WACF are found to be positively and significantly affecting
NIM of commercial banks during the time period of 2011Q1-2016Q1. Moreover,
well-capitalized banks have significantly higher profitability during the sample period.
Interestingly, banks which are incurring more operational expenses such as branching,
employee, overheads and amortization (which are extensively related to loan extension
and deposit collection activities) are found to have higher profitability as they involve in
more retail banking activities. These findings can be considered as unexpected since
increasing operating expenses may suggest operational inefficiency of banks. However,
during the examined period, banks are increasing their branch networks and banking
personnel to achieve higher profitability from interest earning activities3. Finally, we find
no significant result for the liquidity position and funding riskiness of banks, and
financial sector concentration.
The remaining parts of this thesis are structured as follows. Chapter II includes a review
of theoretical and empirical literature. Chapter III conducts a financial ratio analysis for
bank profitability in Turkey for last decade. In Chapter IV, descriptive and econometric
3 The impact of operating expenses on bottom-line profitability measure, i.e. return on assets or equity is
7
analyses are conducted to assess policy rate variables. Furthermore, the rationale and
dynamics of asymmetric interest corridor as well as the transmission of monetary policy
stance to loan and deposit rates are also stressed with aggregate sector and individual
bank-level data. Chapter V provides information about data and methodology of dynamic
panel regressions, whereas Chapter VI summarizes results of panel data estimations. Last
8
CHAPTER II
LITERATURE REVIEW
In this part of the thesis, theoretical and empirical literature for interest margins of the
banks are explored. As it is stated in the Introduction part, the chosen variable of interest
is net interest margin (NIM) since it is not only an indicator of profitability of banks as
business entities, but it is also an informative proxy for cost of financial intermediation.
From a purely financial analysis standpoint, researchers often utilize different measures of banks’ ability to produce earnings like net income (NI), return on assets (ROA), return on equity (ROE) etc. However, in this study, we are more focused on the factors driving
NIM4. In particular, our interest lies on finding the nature of the relation between central
bank policy rate and bank NIM given the fact that Turkey has adopted a
multi-dimensional interest rate framework since the end of 2010.
The works in the literature which consider NIM as dependent variable mainly use two
different calculation methods for it: ex-post and ex-ante. Demirgüç- Kunt and Huizinga
4
9
(1999) describes ex-post measure as the ratio of “the difference between realized interest income and interest expense” to the total assets of the bank5
. On the other hand, ex-ante
measure is described as the difference between rates charged on loans and rates charged
on deposits. Equation 1 and 2 show these definitions.
NIM(ex-post)=(Interest Income-Interest Expense)/(Total Assets) (1)
NIM (ex-ante)=Loan Rate-Deposit Rate (2)
One important caveat is that commercial banks are extending different types of loans
(and are offering different types of deposits) with varied maturity and interest rate
structure (fixed or floating). Ex-ante spreads also do not take possible loan losses into
account. Since loan defaults are not incorporated in ex-ante definitions and interest
income and loan losses associated with a particular lending activity tend to materialize in
different times, the definition for NIM used in this study is ex-post one.
The balance sheet items from which the definition of ex-post margin extracted can be
summarized as follows.
Interest earning activities such as extending credits, holding bonds, engaging in interbank loans given to other institutions and,
Interest expense activities such as deposits and interbank loans obtained from other institutions.
5 In a group of works, total equity is used as a normalizing factor in the denominator, but results are mostly
10
2.1 Theoretical Literature
Theoretical attempts to make sense of NIM started with the pioneer work of Ho and
Saunders (1981). Their model regards the bank as a risk-averse dealer operating in
financial markets. In their work, key role of banking is given as providing service to both
depositors and borrowers. There are some restrictive assumptions embedded in this
model. For instance, a financial institution is assumed to have a homogenous product
portfolio. A typical bank is assumed to operate in a single period and it decides on
deposit and loan rates at the start of the period to maximize the wealth at the end of the
period. However, since loan demand and deposit supply are random during that period,
any surplus or deficit of funds are invested or funded by engaging transactions in money
market (any surplus is reinvested and any deficit is refinanced at the risk free rate). Thus,
financial institution has a burden of reinvestment and refinancing risk. To account for that
risk, it is a rational behavior for risk averse expected utility maximizer entity to charge a
positive margin. Optimal spread in Ho and Saunders (1981) model is found as:
Loan Rate=Risk Free Rate+a (3)
Deposit Rate=Risk Free Rate-b (4)
Optimal Spread=a+b=(α/β)+(1/2)*(Rσ2
Q) (5)
Here, α/β is the margin required by risk-neutral bank taken competitive conditions into consideration. It is also the representation of the monopoly power of the banks. In this
context, α and β are the intercept and slope terms of the symmetric loan/deposit arrival
11
average size of transactions undertaken by the bank and lastly, σ2
represents the
dispersion of loan and deposit rates. Here, a and b represent the margin added on risk-free
rate to calculate loan rate and the margin deducted from risk-free rate to calculate deposit
rate respectively.
Two-step estimation approach to this model is widely used in the literature to apply the
model setup to the data so as to draw inferences (see Doliente, 2005). In the first step,
NIM is regressed for a cross-section of bank level data on bank specific variables such as
the ratio of total assets to equity and the ratio of non-performing loans to total loans.
Constant term from these regressions represents a measure of the portion of spread that is
not attributable to bank-level characteristics. In the second step, constant terms are
regressed on macroeconomic variables such as the volatility of interest rates. New
constant term arising from second step regressions represent the portion of the spread
which is neither explained by bank specific factors nor by volatility of rates. That is why; it is named as “pure spread” and it captures the impact of market structure6
. This pure
spread is regarded as a compensation of the inventory risk that are arising from the
randomness of the loan/deposit transaction requests from customers.
Risk-averse dealer model is extended further with later works. For instance, McShane
and Sharpe (1985) apply a differentiated version of this model to Australian commercial
banks. In their framework, the uncertainty is not rooted in dispersion of money market
rates, instead it is related to the dispersion of loan and deposit rates. One other variation
they make in the model is related to the product portfolio. They include cash and short
6 Two step procedure is also employed in other studies (Brock & Suarez, 2000; Saunders & Schumacher,
12
term money market assets as well as the shareholders’ funds into the balance sheet composition of the typical bank in the model. The specification composed in this study
theoretically argues that spread between loan and deposit rates is related to the power of
the banks in loan and deposit markets. Similar to the original model, risk aversion,
volatility of interest rates and average transaction size are considered. In addition to the
development of a model to explain bank margins, McShane and Sharpe (1985) study eight Australian trading banks. They find that bank’s risk aversion, interest rate volatility and average transaction size are affecting NIM positively.
Allen (1988) later modified theoretical model by arguing that the products of banks are
not homogenous and by incorporating the cross-elasticity of demand for products into the
framework. Assuming that a bank is providing multiple types of loans, then any
adjustment for the rate charged on a particular loan (for instance, an increase in the
discount of one particular type of loan) is argued to affect the demand for the other loan
category. The finding from this work points out that pure spreads can be diminished
thanks to the portfolio diversification effect.
Bank dealership framework is also adjusted to account for the credit risk by Angbazo
(1997). The interaction between interest rate risk and the credit risk is also incorporated
in their specification. One additional purpose of their work is to assess the impact of
credit cycles on NIM. To shed more light on these issues, they also conduct an empirical
investigation with US commercial banks for the period 1989-1993. Their analysis yields
the conclusion that banks adjust NIM to reflect the changes in default risk premium and
13
that if the trough phase in the credit cycle is accompanied with increasing overall risk
perception then NIM inflates.
As a later addition to the theoretical efforts in modeling NIM, Maudos and Guevera
(2004) consider average operating costs as an explanatory factor for NIM. By referring to
the productive nature of banks in terms of facilitating the process of intermediation
between deposits and loans, operating costs are assumed to be a function of loans
extended and deposits collected. The equation for optimal interest margin is established
to be a positive function of average operating costs. Maudos and Guevera (2004) argue
that financial institutions which are operating with high level of unit costs would
facilitate intermediation process through higher margins taking market power and other
risks into consideration. Apart from theoretical consideration, their study undertakes a
test with the banking data of five developed European countries and found that operating
expenses in addition to the other bank-based and market structure variables from the
original model are significant in determining NIM. Specifically, higher concentration in
banking industries of these countries (resulted from a wave of mergers and company
acquisitions) assessed by a direct measure of competition that is Lerner Index contributed
positively to the margins; while downward trend in credit risk, cost structure and
volatility of interest rates put downward pressure on the spreads. Their justification for
the addition of operating costs to the theoretical model is also based on the significant
result from the empirical quest.
Similar to the Allen (1988), Valverde and Rodriguez (2007) adjust the composition of the
bank products in the original model. In this way, they include interest earning assets other
14
framework. Their extension to the model involves a proposition that utilization of
non-traditional activities is expected to reduce the NIM. The empirical analysis presented in this study is focusing on the seven developed European countries’ banking sector by using multiple definitions of NIM such as loan to deposit spread, gross income to total
assets ratio (this definition particularly includes non-traditional activities) and the spread
between bank loan rates and interbank money market rate. According to the estimation
results, it is found that non-traditional banking activities which are sources of fees and
commissions income decrease the interest margins. One other important conclusion of
this work is that non-traditional activities are important for strengthening the market
power of banks.
2.2 Empirical Literature
In this part, some examples of the empirical works regarding to the determinants of NIM
are presented. Mostly, empirical works are designed with single step regression technique
by incorporating the bank specific variables derived from theoretical models as well as
the industry related and macroeconomic forces. Especially, we mention the cross-country
studies in addition to the works done with Turkish banking data.
Among empirical works which are using cross-country banking data, Demirgüç-Kunt and
Huizinga (1999) has a framework which is based on a behavioral model of the financial
institutions in which several potential motives of the bank profitability are explored
(Brock & Suarez, 2000). That framework classifies factors impacting the margin into
three groups: bank-specific, industry-related and macroeconomic. In their setting,
15
analysis where the econometric method utilized is weighted least squares (WLS). Their
portfolio of explanatory variables is extensive and is ranged from financial ratios to
industry indicators, from competition-related elements to macroeconomic forces. They
show that margins of the banks are being affected by bank specific variables,
macroeconomic forces, taxing practices and reserve requirements.
Claessens, Demirgüç-Kunt and Huizinga (2000) focus on the role of bank ownership status and financial sector structure. The data belonging to 80 developing and developed
countries is analyzed and it is found that the role of bank ownership on bank profits
depends on the status of country itself. Results are in line with the fact that foreign banks
appear to operate with wider margins than domestic banks in emerging markets, while
opposite is true for developed countries. Furthermore, operating cost structure proxied by
the ratio of overhead expenses to total assets, GDP growth, inflation and interest rates are
found to be positively associated with bank margins. Demirgüç-Kunt, Laeven and Lavine
(2003) start from the data of 72 countries and aim to assess the role financial sector
concentration on bank profitability while bank specific factors such as bank size,
liquidity, equity ratio and overhead expenses are added to the model and while
macroeconomic factors and institutional quality of countries are controlled. They
ascertain that the degree of concentration in the industry is increasing NIM.
Brock and Suarez (2000) examine the trend of NIM in Latin American countries and try
to understand the factors behind the persistently high margins during that time despite the
financial liberalization, abolishment of credit controls and revoke of interest rate ceilings.
They use abovementioned two step approach and reveal that the ratio of non-performing
16
liquidity ratio, interest rate volatility and inflation rate are positively associated with bank
spreads. As a work interested in the behavior of bank NIM within a country group, Kasman, Vardar, Tunç and Okan (2010) examine 29 member countries of European Union (EU) to assess the determinants of commercial bank NIM. The methodology they
follow comprises the division of sample period into two, specifically two sub-periods of
1995-2000 and 2001-2006. Such a division is deemed necessary to assess the impact of
banking sector consolidation in EU on NIM. Moreover, countries in the sample are
categorized into two groups which are old and new members of EU. According to the
results of pooled OLS regressions, in both sub-periods, bank controls such as operating
cost and credit risk are found to contribute positively to bank margins. While again in
both sub-periods, bank size and managerial efficiency are detected to be contributing
bank margins negatively. In terms of the old and new member country comparison in EU
banking system, especially the impact of macroeconomic variables are not robust
suggesting that there exists no economic and financial convergence among members of
the EU.
As a study for OECD countries, Hawtrey and Liang (2008) conduct an analysis with
banking sector data of 19 countries. By applying static linear panel estimation methods,
they diagnose that widely referred bank specific variables controlling bank size, operating
expenses and credit risk are related to bank NIM positively. One other example of studies
which are working with very large cross-country banking data is that of Chen and Liao
(2011). Their analysis with banking data of commercial banks, savings banks and bank
holding companies in 70 countries for the period between 1992 and 2006 has an aim to
17
related to NIM, it is observed that bank specific variables such as operation costs, bank
size, credit risk, liquidity risk and capital strength are found as significant empirical
determinants of NIM. Moreover, foreign banks are found to be more profitable than their
domestic counterparties. In terms of the macro-level variables, GDP growth, inflation
rate, regulatory quality and government effectiveness have a negative influence on bank
profitability.
2.3 Empirical Literature for Turkey
Although there is vast amount of single country studies, there are very few regarding to
the margins of Turkish banking system. Apart from cross-country studies, we cover some
of the works aiming to find determinants of NIM in the context of Turkey. For instance,
Kaya (2002) investigate the determinants of bank profitability measures for the period
1997-2000 with the quarterly data set of 44 Turkish banks. Two step method applied in
Ho and Saunders (1981) and Brock and Suarez (2000) are also used in this study. Their
findings from the first step regressions show that NIM is positively related to capital
adequacy, liquidity ratio and the market share of individual banks in whole banking
sector. The positive association between pure margin and inflation as well as the public
sector debt is supported with the results of second step regressions.
As a work covering more recent time period, Aysan, Dalgıç and Demirci (2010) analyze the determinants of commercial bank NIM for the period after 2001 crisis in Turkey.
Single step approach with fixed effects panel regressions yields the conclusion that risk
aversion which is proxied by equity ratio and implicit interest payments are important
18
Hirschman Index (HHI) is found to be positively affecting bank margins. Inflation, real
GDP growth rate and interbank interest rates appear to be significant macro controls in
that study. As a side aim, this work also incorporates a dummy variable in its
specification to find the behavior of NIM during global financial crisis time. It is
observed that during crisis time, bank NIM in Turkey is increased. Kansoy (2012) also
examine the bank margins in Turkish commercial banks. By employing static and
dynamic linear panel estimations, they find that bank NIM in Turkey is related to
overhead expenses, size of the bank operations, asset quality, risk aversion, inflation and
GDP growth. One important finding in this context is that lag of the NIM turns out to be
significant explanatory variable in the dynamic setting.
Ganioğlu and Us (2014) look at the banking structure of Turkey from different
perspectives including asset quality, capital adequacy, funding risk, liquidity and more
importantly profitability. They run static panel regressions for the periods both before and
after the global crisis. They find that, before the crisis, the ratio of other operating
expenses to total assets (as a representation of cost structure), inflation and reserves of
banks denominated in TL as significant variables, while credit risk, other operating
expenses and policy rate are significant determinants after the crisis. Similarly, Us (2015)
detect credit risk, inflation and other operating expenses as determinants of NIM by using
dynamic panel methods.
2.4 Bank Interest Rate Channel and the Role of Interest Rates for NIM
As it is stated in the Introduction part, focal point of this thesis is to assess the impact of
19
created in NIM through changes in policy rate depends on the pass through from policy
rate to bank loan and deposit rates which directly designates the level of interest income
earned and the level of interest expenses incurred. Since the ex-post definition of NIM
specified in this quest involves with the interest income and expense, pass through of
policy rate plays a vital role. Thus, as a side analysis, the level of pass through from
policy rate to bank loan and deposit rates are examined in Chapter IV in detail.
The relation between policy rate and market rates is widely examined theoretically under
the concept of interest rate channel of monetary transmission mechanism. As Mishkin
(1996) state monetary policy stance has influence on real phenomena like total demand
and inflation as well as the financial dynamics through several channels. Apart from
credit channel (which is composed of bank lending channel and balance sheet channel),
equity price channel and exchange rate channel; interest rate channel is effective in
transmitting the monetary policy alterations to the rest of the economy. Under interest
rate channel, monetary policy stance is first transmitted to the short term nominal market
rates as well as the bank lending and deposit rates. In the second step, changes in the
short term nominal interest rates are transmitted to the long term real interest rates
depending on the inflation expectations. In turn, any change in long term real rates is
reflected in the real aggregates such as investment and output. Our focus in this thesis is
mainly concentrated on the earlier stages of interest rate channel which emphasizes the
pass through between monetary policy rate and banking rates.
There are some empirical works related to the abovementioned concept of pass through.
De Bondt (2002) uses error correction model and Vector Autoregressive (VAR) model
20
They find that both in short and long term, there exists a pass through from market
interest rates representing the monetary policy stance to bank loan and deposit rates.
Additionally, this study includes a co-integration analysis between retail bank and
comparable market based interest rates. Kwapil and Scharler (2006) empirically compare
the interest rate pass through in US and Europe with Autoregressive Distributed Lag
(ARDL) model. They use monthly data for the period January 1995-September 2003.
They find that average pass through from market rates to lending and deposit rates in the long run is lower in Europe than US. Hristov, Hülsewig and Wollmershauser (2014) use panel VAR approach to the data of 11 European countries for the period between 2003
and 2012. Their main finding is that there exists a pass through from market based policy
rate to retail bank interest rates. However, due to financial crisis, pass through started to
be less complete after the crisis. Especially, widening interest margins are found to be
due to structural shocks and extra unidentified shocks.
Turning to the empirical literature for NIM, Demirgüç-Kunt and Huizinga (1999) was
among the first to establish an association between bank profits and real interest rates. After this study, by including some proxies like “1-year Treasury bill discount rate” or “standard deviation of 90-day bill rate”, some other works of the literature have also tried to reveal the relationship between policy rate and volatility of interest rates on bank
margins. However using indirect proxies to mimic the behavior of policy rate does not
capture all the characteristics of the impact of monetary policy on spreads. Especially, in
a country like Turkey where unconventional monetary policies like asymmetric interest
rate corridor and active liquidity management are used, using indirect proxies would be
21
this reason and the unique application of monetary policies in Turkey, one chapter of this
thesis is devoted to an empirical identification strategy to detect policy rate variables by
using time-series analysis techniques.
There are some works which try to differentiate policy rate variable over time by
considering the application of interest rate corridor. Ganioğlu and Us (2014), for instance, use BIST rate for the period of 2002-2010; one week repo rate for the period of
2010Q2-2011Q4 and weighted average funding rate from 2012Q1 and onwards. Their results
show a positive relation between policy rates and NIM which points out the fact that
banks are pricing loans and deposits asymmetrically in the case of a policy tightening
characterized by rising interest rates. For cross-country setup, in the study of Borio,
Gambacorta and Hofmann (2015), the impact of short term interest rates and the term
structure captured by the shape of yield curve on different bank profitability measures
(such as NIM, non-interest income to total assets ratio and ROA) are investigated. They
used dynamic GMM methods to explore abovementioned relations by utilizing the annual
data of a sample of 109 large banks of 14 major advanced countries for the period
1995-2012. These banks belong to countries which are Belgium, Canada, France, Germany,
Italy, Japan, the Netherlands, Sweden, Switzerland, UK, US, Austria, Australia and
Spain. They find a robust positive relation between short term rates and NIM as well as a
22
CHAPTER III
BANK PROFITABILITY RATIOS AND FINANCIAL STABILITY
In this part of the thesis, profitability of banks is examined through ratio analysis in
connection with financial stability. The concept of financial stability and how monetary
authorities respond to it are firstly examined. Then, the trend and dispersion of
profitability ratios, which are among indicators monitored for financial stability, are
provided in the context of Turkey on the aggregate industry level.
The term “financial stability” is somewhat new concept on which there is no exact consensus about its definition among monetary and regulatory authorities around the
world. Key objective of all central banks around the world that is price stability, for
instance, has more or less uniform definition. That is, taking necessary measures by
formulating a sound monetary policy to prevent highly inflationary environment. The
success of a central bank to sustain price stability is measured by the rate of change in a
23
some other form of calculating inflation7. On the other hand, defining which
characteristics of an economy determine the degree of financial instability is vague.
There are some attempts to diagnose the financial stability based on some financial and
economic phenomenon. Allen and Wood (2006) define financially instable structure as
the one where means of payments are unavailable8 to facilitate money transfer among
households, firms and other economic entities. Additionally, the definition of Allen and
Wood (2006) implies that the financial instability coming from an unexpected shock
prevents efficient allocation of savings to investment opportunities. Financial asset prices
become more volatile and unpredictable in such instances. One definition of financial
instability is that of European Central Bank (ECB). ECB describes financial stability as “a condition in which the financial system - intermediaries, markets themselves and market infrastructures - can withstand shocks without major disruption in financial
intermediation and in the general supply of financial services” (Financial Stability and
Macroprudential Policy, n.d.)9.
2008 Global Financial Crisis was a turning point for how monetary authorities perceive
and act upon financial stability. The crisis which originated in the mortgage market of US
was spilled over to whole US financial sector through high level of securitization, excess
risk taking and enormous leverage of investors and intermediaries. This situation caused
an illiquid money market and left bank balance sheets full of toxic assets. The collapse of
7 Even among the countries which have similar economic structure, there are different ways of measuring
inflation. Rajan (2016) mentions about the use of Wholesale Price Index to do inflation calculations in India (a Fragile Five country), while Turkey (another Fragile Five country) utilizes CPI.
(http://www.bis.org/review/r160628f.htm)
8 During Irısh bank strike of 1970 and Greek default in 2015, majority of the customary means of payments
had not been available.
9
24
Lehman Brothers on September 2008 was marked as an indicator of seriousness of the
crisis and the impact was carried to Europe and other parts of the world by creating
systemic risk as financial markets were interconnected deeply. The financial instability caused by “Great Recession”, as termed, is observed in financial and economic indicators of US and global data.
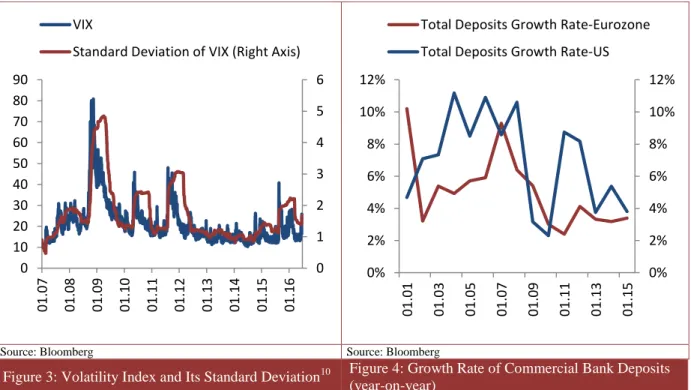
Source: Bloomberg Source: Bloomberg
Figure 3: Volatility Index and Its Standard Deviation10 Figure 4: Growth Rate of Commercial Bank Deposits (year-on-year)
Volatility Index (VIX) is an indicator for global risk appetite and financial stress level.
As Kara (2012) states, level of VIX is a broad representation of risk in the global
economy, whereas standard deviation of VIX is an indicator of uncertainty in the global
economy. The fact that a financially instable environment was created after 2008 crisis is
evident in sudden increase of VIX in Figure 3. The sudden spike in the VIX data on
September 2008 implies the rising level of risk as well as the uncertainty in the global
10 Volatility Index (VIX) is defined as 1-month implied volatility of the option contract written on S&P 500
Index. 0 1 2 3 4 5 6 0 10 20 30 40 50 60 70 80 90 01 .07 01 .08 01 .09 01 .10 01 .11 01 .12 01 .13 01 .14 01 .15 01 .16 VIX
Standard Deviation of VIX (Right Axis)
0% 2% 4% 6% 8% 10% 12% 0% 2% 4% 6% 8% 10% 12% 01 .01 01 .03 01 .05 01 .07 01 .09 01 .11 01 .13 01 .15
Total Deposits Growth Rate-Eurozone Total Deposits Growth Rate-US
25
markets. It can also be seen as an externality of fragile financial markets conditions
observed in almost last ten years.
One component of financial stability definition of Allen and Wood (2006) is undisturbed
transformation of funds into investments through financial institutions. Figure 4 presents
the rate of growth of aggregate commercial bank deposits in US and Europe (which are
two biggest economic zones affected by the global crisis severely). Not only for US, but
also for Eurozone countries as a whole, the ability of banking system to collect funds in
the form of deposits, which are most stable and core source of funding for banks as
Hahm, Shin and Shin (2012) describe, crippled. The deposit growth rate decreased from
10% levels in before crisis period to 4% levels in after-crisis period.
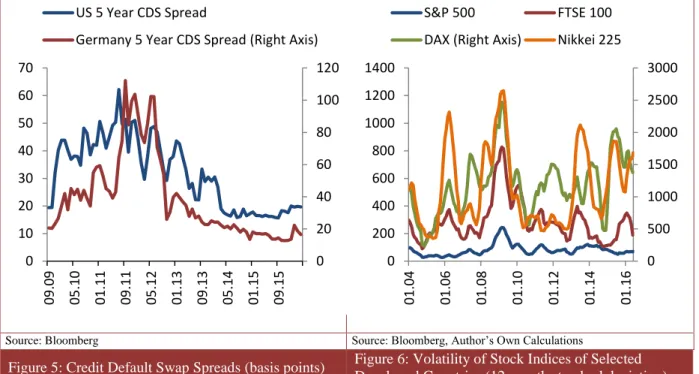
Source: Bloomberg Source: Bloomberg, Author’s Own Calculations
Figure 5: Credit Default Swap Spreads (basis points) Figure 6: Volatility of Stock Indices of Selected Developed Countries (12-month standard deviation)
Especially, during economic turmoil, country-specific risk level can be inflated which
may affect a foreign investor to bring funds and capital to a particular country.
0 20 40 60 80 100 120 0 10 20 30 40 50 60 70 09 .09 05 .10 01 .11 09 .11 05 .12 01 .13 09 .13 05 .14 01 .15 09 .15 US 5 Year CDS Spread
Germany 5 Year CDS Spread (Right Axis)
0 500 1000 1500 2000 2500 3000 0 200 400 600 800 1000 1200 1400 01 .04 01 .06 01 .08 01 .10 01 .12 01 .14 01 .16 S&P 500 FTSE 100 DAX (Right Axis) Nikkei 225
26
Financially instable economies are also characterized with high level of country-specific
risk. Whether or not recent 2008 crisis contributed to the financial instability through
increasing sovereign risk is clearly evident in Figure 5, in which premiums on 5-year
credit default swap contracts are scattered. Especially, initial periods after crisis
witnessed a sudden increase in CDS spreads in US and in Germany (as a proxy for
Eurozone).
To describe a financially instable framework, Allen and Wood (2006) mention the role of
volatility in finance asset prices as well. Figure 6 displays the 12-month standard
deviation of stock market indices of selected developed countries which belong to US
(S&P 500), UK (FTSE_100), Germany (DAX) and Japan (Nikkei-225). It can be said that during “Great Recession”, volatility for stock indices increased substantially which allowed for a financially instable situation.
We have covered extensively the definition of financial instability concept and how well
time period of 2008 crisis fits that concept. Global economic turbulence observed in the
crisis was a key turning point for how monetary authorities approach to financial
stability. The importance of including financial stability as a policy goal along with
traditional price stability aim started to be understood after this period. There appeared a
view that financial stability should be incorporated into policy-reaction functions of
central banks and other monetary authorities (Bayoumi, Dell’Ariccia, Habermeier,
Mancini-Griffoli, & Valencia, 2014). Moreover, adding a second target to the monetary policy makers’ agenda requires the composition and implementation of macro-prudential tools including regulatory and supervisory policies in the banking sector to ensure
27
integrated to the objective function of central banks which apply traditional
inflation-targeting framework (Kara, 2012). Additionally, implementing new monetary policy and
macro-prudential measures naturally requires a well-coordinated institutional framework
(Agenor, Alper, & Silva, 2013).
In Turkey, CBRT is a major part of such framework in the quest of providing financial
stability. In this context, one of the responsibilities of CBRT is closely monitoring
financial intermediary services to improve the functioning of financial transactions.
CBRT implemented several policies in last couple of years to this end.
Firstly, inflation-targeting monetary policy structure was altered to accommodate
complementary policy tools. The gap between overnight lending and borrowing rates had
been widened to create a mechanism to adjust volatility of short-term money market rates
in response to global and domestic developments. In that way, the inflow of short term
funds was limited because of the low rate of returns and high volatility of money market
rates. Excessive and volatile inflows were result of accommodative monetary policies of
industrialized countries to overcome the impact of crisis. This step was necessary as
excessive fund flows that are transformed into loans caused problems with respect to
current account deficit, credit growth and household indebtedness. The rationale of the
asymmetric interest rate corridor based on this discussion is examined in Chapter 4.
Secondly, macro-prudential policies were implemented by CBRT to restore financial
stability. For instance, Reserve Option Mechanism (ROM) allowing banks to place a
portion of TL required reserves in the form of foreign exchange and gold was put into
28
requirement rules, regulations encoded to limit borrowing capacity and installments
(CBRT and Financial Stability, n.d.)11.
An integral responsibility of CBRT in terms of financial stability is to monitor financial
institutions and this aim is somewhat related to bank profitability. CBRT is following
developments about financial institutions through its Financial Stability Report. Similar
to other examples of such reports, this one is specifically designed to follow the trend of
data developments in terms of specific aspects of financial industry. Report also focuses
on the pre-determined risk types that financial institutions face such as credit risk,
liquidity risk, interest rate risk, currency risk, capital adequacy and, more importantly for
our discussion, profitability. Hence, banking sector has been closely monitored by
CBRT12.
In this chapter, we try to summarize how bank profitability evolves over time in detail.
Data includes total items in the sense that it is composed of both TL and FX components.
FX items are transformed into Turkish lira as banks report their data to BRSA in that
way. Hence, we make no adjustment to account for possible currency or parity impact on
data.
11
(http://www.tcmb.gov.tr/wps/wcm/connect/TCMB+TR/TCMB+TR/Main+Menu/Para+Politikasi/Finansal+ Istikrar/Merkez+Bankasi+ve+Finansal+Istikrar)
12 For the rest of this chapter, by using the monthly aggregate sector data obtained from Banking
Regulation and Supervision Agency (BRSA), we conduct ratio analysis of some profitability measures which are also preferred in Financial Stability Report (Financial Stability Report, n.d.).
29
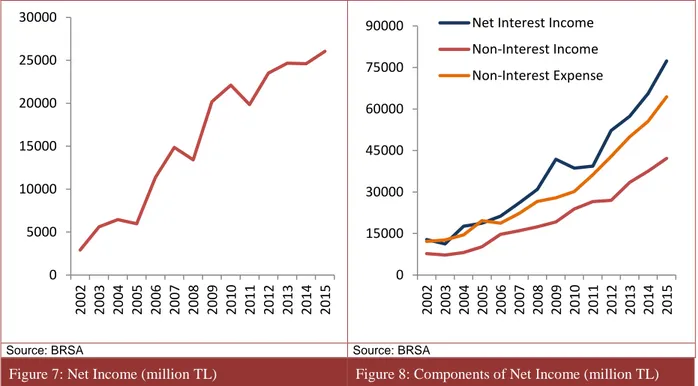
Source: BRSA Source: BRSA
Figure 7: Net Income (million TL) Figure 8: Components of Net Income (million TL)
Net income of Turkish banks has a strong upward trend, despite there exists some periods
of moderation in profit generation ability of banks, as seen in Figure 7. Despite the fact
that, net income is stable during the period of stabilization and recovery after 2001 crisis
(period until the year 2005), an accelerated trend is observed especially after 2005.
Global financial crisis and European sovereign debt crisis seem to intervene that trend
and, the cumulative change in net income becomes slower and it even declines during the
years 2008 and 2011.
Banks have two main income and expense sources. The main operation of banks
involving collecting deposits and extending credits is also the main source of net income.
In Figure 8, the fact that net interest income being higher than the difference between
non-interest income and non-interest expense, especially after 2006, is supporting this
argument. Banking activities other than lending is contributing negatively to net income
0 5000 10000 15000 20000 25000 30000 20 02 20 03 20 04 20 05 20 06 20 07 20 08 20 09 20 10 20 11 20 12 20 13 20 14 20 15 0 15000 30000 45000 60000 75000 90000 20 02 20 03 20 04 20 05 20 06 20 07 20 08 20 09 20 10 20 11 20 12 20 13 20 14 20 15
Net Interest Income Non-Interest Income Non-Interest Expense
30
as non-lending expense is larger than non-lending income throughout whole sample. The
stable trend of non-interest income shows that Turkish banks are not able to extract too
much economic value from non-lending activities.
Source: BRSA Source: BRSA
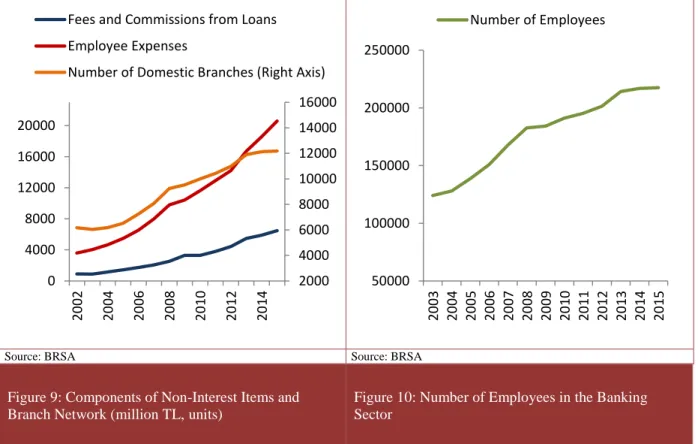
Figure 9: Components of Non-Interest Items and Branch Network (million TL, units)
Figure 10: Number of Employees in the Banking Sector
Despite the fact that, there is a maturing trend with which Turkish banks enlarge their
branch network after 2013, employee expenses which is an overhead cost category that is
directly linked to the branching activity increase substantially, as observed in Figure 9.
One factor in this development is the increase in number of people employed in the
sector, as seen in Figure 10. On the other hand, fees and commissions can be regarded as
an important component of non-interest income sources. As Demirgüç-Kunt and
Huizinga (2010) state, recent developments in the banking sector in terms of operational
diversity enhanced some banks to adapt a range of activities such as commercial banking,
2000 4000 6000 8000 10000 12000 14000 16000 0 4000 8000 12000 16000 20000 20 02 20 04 20 06 20 08 20 10 20 12 20 14
Fees and Commissions from Loans Employee Expenses
Number of Domestic Branches (Right Axis)
50000 100000 150000 200000 250000 20 03 20 04 20 05 20 06 20 07 20 08 20 09 20 10 20 11 20 12 20 13 20 14 20 15 Number of Employees
31
investment banking and insurance. As activity mix is enlarged, non-interest income
sources derived from activities like underwriting securities or asset management become
more visible. In the case of Turkey, fees and commissions (as an important component of
non-interest income13) are not increasing at a faster rate.
Source: BRSA Source: BRSA
Figure 11: NPL Provisions and Profit/Loss from
Capital Markets Operations (million TL) Figure 12: ROA and ROE (percentage)
Banks keep provisions to protect their net income from losses caused by default of firms
and households on their debt. One indicator of this careful stance of banks can be seen in
Figure 11 where non-performing loan (NPL) provisions have upward trend especially
after 2011. Moreover, this situation is also in line with the view that credit risk could be
related to bank profitability. Moreover, the income stream from capital market operations
is volatile especially for the last five years when even occasional losses are observed.
13 As of March 2016, fees and commissions constitute 14.7% of all of the non-interest income.
-12000 -8000 -4000 0 4000 8000 12000 0 4000 8000 12000 16000 20000 20 02 20 04 20 06 20 08 20 10 20 12 20 14 NPL Provisions
Net Profit/Loss from Capital Markets Operations (Right Axis) 4 6 8 10 12 14 16 18 20 1.0 1.2 1.4 1.6 1.8 2.0 2.2 2.4 2.6 2.8 20 02 20 04 20 06 20 08 20 10 20 12 20 14 Return on Assets
32
Lastly, two alternative measures of bank profitability are presented in Figure 12. It is
evident that both return on equity (ROE) and return on assets (ROA) have been declining
after 2009. As of 2009, ROE was at around 18% while it is decreased to 9.9% in recent
times. Similarly, ROA decreased from the levels of 2.4% to the 1.1%.
When we summarize these observations from ratio analysis, we can say that:
Turkish banking sector has an increasing net income level in spite of the periods during 2008 global financial crisis and recent European sovereign debt crisis that
resulted phases of maturing speed in profit creation.
Turkish banks rely mostly on interest bearing items in revenue creation. The higher level of net interest income from net non-interest income in the examined
sample period is in line with that argument.
Turkish banks are not productive in terms of revenue creation from activities that do not involve interest. Banks are incurring losses that are more than
corresponding revenues from non-interest activities. When we examine the
components of non-interest income, we see that slow-growing fee and
commissions income is contributing to the narrow scope of business model
Turkish banks have.
Despite the maturing trend of the expansion on bank branch network and number of employees, employee expenses are increasing substantially.
Turkish banks are becoming more aware of credit risk especially after global financial crisis that is manifested in accelerating level of NPL provisions. Income
stream from capital markets operations is very volatile, especially during recent
33
Bottom-line profitability measures of ROA and ROE have significant downward trend, especially for the last six years.
Hence, in this thesis, we concentrate mainly on explaining the factors that may affect the
trend of net interest income of Turkish commercial banks during 2011-2016 using
quarterly data. As emphasized in the introduction chapter, we try to understand the role of
unconventional monetary policy exercised by CBRT after 2011 on net interest income of
commercial banks. We have no intention to answer lessening bottom-line profitability
34
CHAPTER IV
POLICY RATE AND LOAN/DEPOSIT RATES
The impact of Central Bank policy rate on bank net interest margin is a focal point of this
study. Testing the significance of the impact of policy rate on net interest income of
commercial banks creates a complication in the case of Turkey given the fact that CBRT
has been conducting an unconventional monetary policy characterized by an asymmetric
interest rate corridor system with active liquidity management. The nature of monetary
policy followed in Turkey since 2010 brings several short term interest rates into the
picture for which an additional analysis is required to reveal the level of their impact on
bank lending and deposit rates.
In this chapter of the thesis, firstly, we are describing the reasons why such
unconventional policies are adopted and how did those measures serve in macroeconomic
structure. Then we define the asymmetric corridor system, its mechanics and interest rate
parameters; not only those which are officially determined by CBRT but also those which
35
mechanism of chosen parameters of interest corridor framework to bank commercial
loan, consumer loan and deposit rates are explored. These relations are evaluated with a
reduced-form VAR model on the aggregate banking sector level. We end this chapter by
a panel VAR analysis with the bank level data to see the existence of pass through from
policy rates to loan and deposit rates on the individual bank level.
4.1 Interest Rate Corridor System In Turkey 4.1.1 Motivation
In the contemporary understanding of implementing monetary policy, a target overnight
rate is aimed to be achieved by policy makers. A target is set and then money market
rates are forced to float closely to policy rate through liquidity operations. In keeping
money market rates closer to targeted policy rate, two methods are generally used which
are reserve averaging and corridor system. Corridor system is preferred by central banks
of some developed countries (Whitesell, 2006)14. As a natural implication of traditional
corridor system, central bank lending rate constitutes a ceiling for overnight interest rates
while borrowing rate of a central bank constitutes a floor (Whitesell, 2006). In this
traditional sense of rate corridor framework, central bank’s target interest rate is
positioned at the midpoint of the corridor. Aftermath of the global crisis, the framework
is different in Turkey since it has an asymmetric structure and involves with different
parameters.
As emphasized in Chapter III, global financial crisis in 2008 was a turning point when the
importance of financial stability was comprehended by monetary authorities. Especially,
14 Noticeable examples of monetary authorities with corridor framework are Federal Reserve, Bank of
36
the unconventional measures taken by developed countries’ central banks had created new economic dynamics for emerging markets. Due to the quantitative easing policies of
developed countries to cope with the impact of crisis, abundance of liquidity was
emerged. This created a high volatility of capital flows to emerging countries given the
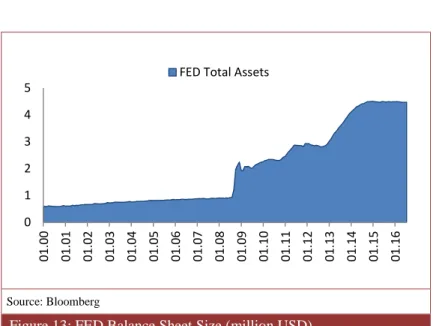
fragile financial conditions in the aftermath of crisis. As it can be seen in Figure 13, the
size of the balance sheet of Federal Reserve (FED) displays an indicator of quantitative
easing and the availability of liquidity in global markets.
Source: Bloomberg
Figure 13: FED Balance Sheet Size (million USD)
The volatility of short term capital flows to emerging countries increased not only in
equities but also in fixed income securities, especially after the implementation of second
quantitative easing program in US in 2010. After the crisis, changes in global liquidity
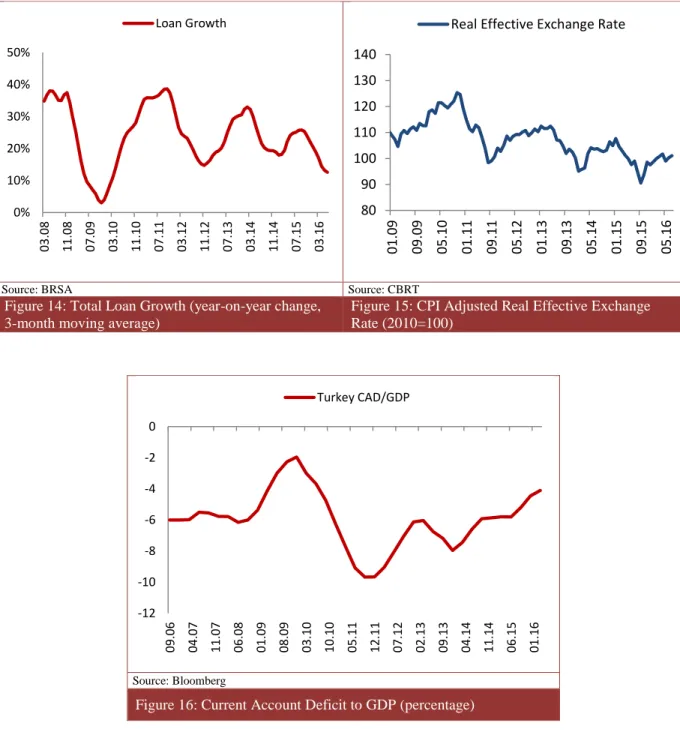
conditions also affected the macro balances of developing countries such as Turkey. As it
can be seen in Figure 14, year-on-year loan growth increased to the levels of 40% caused
by the fact that high level of capital inflows eased the access to finance, which in turn
enhanced domestic consumption. However, such excessive level of loan growth created
financially instable environment. During the same period, capital inflows to Turkey
0 1 2 3 4 5 01.00 01.01 01.02 01.03 01.04 01.05 01.06 01.07 01.08 01.09 01.10 01.11 01.12 01.13 01.14 01.15 01.16