AN ANALYSIS OF RELATION BETWEEN INTEREST RATE SPREAD AND ECONOMIC ACTIVITIES OF OECD COUNTRIES USING PANEL DATA ANALYSIS
A THESIS SUBMITTED TO
THE INSTITUTE OF SOCIAL SCIENCES OF
YILDIRIM BEYAZIT UNIVERSITY
BY
ERKAN KARA
IN PARTIAL FULFILLMENT OF THE REQUIREMENTS FOR
THE DEGREE OF DOCTOR OF PHILOSOPHY IN
THE DEPARTMENT OF BANKING AND FINANCE
Approval of the Institute of Social Sciences
Assoc. Prof. Dr. Seyfullah Yıldırım Manager of Institute
I certify that this thesis satisfies all the requirements as a thesis for the degree of Doctor of Philosophy in Department of Banking and Finance.
Assoc. Prof. Dr. Ayhan KAPUSUZOĞLU Head of Department
This is to certify that we have read this thesis and that in our opinion it is fullyadequate, in scope and quality, as a thesis for the degree of Doctor of Philosophy in Department of Banking and Finance.
Assist. Prof. Dr. Erhan ÇANKAL Supervisor
Examining Committee Members
Assist. Prof. Dr. Erhan ÇANKAL (YBU, Banking and Finance) Prof. Dr. Nildağ Başak CEYLAN (YBU, Banking and Finance) Prof. Dr. Ramazan SARI (ODTÜ, Business Administration) Assist. Prof. Dr. Ayşe Ediz (GAZİ, Econometrics)
iii
PLAGIARISM PAGE
I hereby declare that all information in this thesis has been obtained and presented in accordance with academic rules and ethical conduct. I also declare that, as required by these rules and conduct, I have fully cited and referenced all material and results that are not original to this work; otherwise I accept all legal responsibility.
Name, Last name: Erkan KARA
ABSTRACT
AN ANALYSIS OF RELATION BETWEEN INTEREST RATE SPREAD AND ECONOMIC ACTIVITIES OF OECD COUNTRIES USING PANEL DATA ANALYSIS
KARA, Erkan
Ph.D., Department of Banking and Finance Supervisor: Assist. Prof. Dr. Erhan ÇANKAL
April 2017, 141 pages
The aim of this study is to see long run relation between interest rate spread and economic activities for OECD countries. In this context, the research focused on the effect of spread on main maco-economic indicators such as industrial production, inflation and unemployment rate between 2005 and 2015 by using monthly data. Apart from spread, stock exchange index, M1 and long term interest rates were used to see their influence on macro-economic variables. Panel data analysis was employed to find long run linkage between the variables. The tools that necessary for panel analysis were employed. For instance panel unit root tests, panel cointegration tests, panel estimation methods were employed in the analysis.
The results reveal that while interest rate spread still has positive relation with economic activities, as pointed by some authors, the degree of positiveness seems to be declining over the years. However, due to macro-economic development around the World, some variables such as money supply is losing its significance in explaining economic activities.
v
This happens at the time of the economies that are in a new state, which some economists call as “New Normal”. Because, interest rates in many countries are in near-zero level and has been staying there for a along time since the financial crisis of 2008. Despite these lower rates, economic activities could not reach the level desired up until 2016. Although inflation seems to be explained well by all financial indicators, the relation between unemployment rate was not found for spread.
Keywords: interest rate spread, economic activities, panel data analysis, cointegration, OECD countries.
ÖZET
OECD ÜLKELERİNDE GETİRİ FARKI VE EKONOMİK AKTİVİTELER ARASINDAKİ İLİŞKİNİN PANEL VERİ YÖNTEMİ İLE ANALİZİ
KARA, Erkan
Doktora, Bankacılık ve Finans Bölümü Tez Yöneticisi: Yrd. Doç. Dr. Erhan ÇANKAL
Nisan 2017, 141 sayfa
Bu çalışmanın amacı OECD ülkeleri için getiri farkı ve ekonomik aktiviteler arasındaki uzun dönemli ilişkiyi araştırmaktır. Bu kapsamda, bu çalışmada, 2005 – 2015 dönemi arasında getiri farkının ana makro-ekonomik göstergelere, yani sanayi üretimi, enflasyon ve işsizlik oranlarına, etkileri üzerine odaklanmıştır. Getiri farkının yanında, borsa endeksi, M1 para arzı ve uzun vadeli tahvil faizlerinin de ekonomik ektiviteler üzerindeki etkileri incelenmiştir. Değişkenler arasındaki uzun dönemli ilişkiyi bulmak için panel data analiz yöntemi kullanılmıştır. Bu çerçevede kullanılan araçlar ise panel birim kök testleri, panel eşbütünleşme testleri ve panel tahmin modellemeleri kullanılmıştır.
Sonuçlar bize getiri farkının ekonomik aktivitelerle uzun dönemli pozitif bir ilişkiye sahip olduğunu söylerken, literatürdeki bazı yazarlar ise bu ilişkinin gücünün zayıfladığını vurgulamaktadırlar. Bununla beraber dünyada meydana gelen son yıllardaki gelişmelerden dolayı para arzı gibi değişkenlerde ekonomik aktiviteleri açıklamadaki güçlerinin yitirildiği gözlemlenmektedir. Ekonomilerdeki son yıllarda vuku bulan bazı reel olayların teori ile ters düşmesi durumları bazı ekonomistler tarafından “Yeni Normal” – “New Normal”- olarak
vii
adlandırılmaktadır. Çünkü, Dünyada önemli sayıda ülkede 2008 finansal krizinden bu yana faiz oranları sıfır veya sıfıra yakın seyretmektedir. Bu çok düşük faiz oranlarına rağmen ekonomilerde ekonomik aktivitelerde istenilen büyüme ve canlanmalar, en azından 2016 yılına kadar, meydana gelmemiştir. Sonuçlarda ayrıca enflasyon ile finansal göstergeler arasındaki ilişkilerin varlığı gözlemlenmiş, fakat işsizlik oranları ve finansal göstergeler arasındaki uzun dönemli ilişkinin varlığı ise görülememiştir.
Anahtar Kelimeler: getiri farkı, ekonomik aktiviteler, panel veri analizi, eşbütünleşme, OECD ülkeleri
ix
ACKNOWLEDGMENTS
I would like to offer my special thanks to;
…my thesis advisor, Assist. Prof. Dr. Erhan Çankal for his guidance, advice, encouragement, support throughout my research.
…the examining committee members, Prof. Dr. Ramazan SARI, Assist. Prof. Dr. Erhan ÇANKAL, Prof. Dr. Nildağ Başak CEYLAN, Assist. Prof. Dr. İklim Gedik BALAY and Assist. Prof. Dr. Ayşe EDİZ for their precious contributions and criticisms.
I would also like to extend my sincerest gratitude and appreciation to; …my all family members for their patience, support and encouragements.
TABLE OF CONTENTS
PLAGIARISM PAGE ... III
ABSTRACT ... IV ÖZET ... VI
ACKNOWLEDGMENTS ... IX
TABLE OF CONTENTS ... X
LIST OF TABLES ... XIII
LIST OF FIGURES ... XIV
LIST OF ABBREVIATIONS ... XV
INTRODUCTION ... 1
CHAPTER ... 5
1 AN OVERVIEW OF THE ORGANISATION FOR ECONOMIC CO-OPERATION AND DEVELOPMENT ... 5
1.1 THE CREATION OF OEEC ... 6
1.2 THE CREATION OF OECD ... 7
xi
1.4 ORGANISATIONAL STRUCTURE OF OECD ... 12
1.4.1 The Council ... 13
1.4.2 The Committees ... 13
1.4.3 The Secretariat ... 14
2 A BRIEF OUTLOOK TO FINANCIAL AND ECONOMIC INDICATORS ... 15
2.1 INTEREST RATES SPREAD ... 15
2.2 LONG TERM INTEREST RATES ... 17
2.3 STOCK EXCHANGE INDEXES ... 19
2.4 MONEY SUPPLY OF M1 ... 21
2.5 INDUSTRIAL PRODUCTION ... 23
2.6 CONSUMER PRICE INDEX ... 25
2.7 UNEMPLOYMENT RATES ... 27
3 LITERATURE REVIEW AND THEORTICAL BACKROUND ... 29
3.1 DISCUSSION OF VARIABLES IN THE ANALYSIS ... 29
3.1.1 Spread (Long term bond – Short term bill) ... 29
3.1.2 Long Term Interest Rates ... 32
3.1.3 Stock Index ... 34
3.1.4 Industrial Production ... 34
3.1.5 Consumer Price Index ... 35
3.1.6 Unemployment Rates ... 36
3.1.7 Money Supply of M1 ... 37
3.2 LITERATURE REVIEW ... 38
4 DATA AND METHODOLOGY ... 54
4.1 DATA DESCRIPTION ... 54
4.3 PANEL UNIT ROOT TESTS ... 60
4.3.1 First Generation Panel Unit Root Tests ... 60
4.3.2 Second Generation Panel Unit Root Tests ... 63
4.4 HOMOGENEITY TEST ... 70
4.5 PANEL COINTEGRATION ANALYSIS ... 72
4.6 PESARAN (2004) CROSS-SECTION DEPENDENCY (CD) TEST ... 77
4.7 COINTEGRATION TESTS CONSIDERING CROSS-SECTION DEPENDENCY... ... 78
4.8 PANEL DATA ESTIMATION ... 81
4.9 EMPIRICAL FINDINGS ... 84
4.10 PANEL CAUSALITY TEST ... 89
5 CONCLUSION ... 92
REFERENCES ... 96
APPENDICES ... 108
A. ILT (2013) STRUCTURAL BREAK UNIT ROOT TEST RESULTS ... 108
B. GRAPHS OF VARIABLES FOR EACH OECD COUNTRIES ... 122
CURRICULUM VITAE ... 130
xiii
LIST OF TABLES
Table 4.1: Panel Unit Root Test at Level ... 67
Table 4.2: Panel Unit Root Test First-Differenced... 68
Table 4.3: Hadri and Kurozumi Augmented Panel KPSS test, (2012) ... 69
Table 4.4: Im, Lee Tieslau (2013) Structural Break Unit Root Test ... 70
Table 4.5: Homogeneity Test Results ... 71
Table 4.6: Westerlund (2007) cointegration testing results ... 73
Table 4.7: Pedroni (2004) Cointegration testing results ... 76
Table 4.8: Pesaran (2004) CD test results ... 77
Table 4.9: Westerlund and Edgerton (2007) cointegration testing results ... 79
Table 4.10: Westerlund (2006) Cointegration testing multibreak LM statistics results ... 80
Table 4.11: Panel ARDL model for industrial production test results ... 86
Table 4.12: Panel ARDL model for consumer price index test results ... 87
Table 4.13: Panel ARDL model for unemployment test results ... 88
LIST OF FIGURES
Figure 1.1 The world and the OECD population level in billions, 2000 and 2013 ... 9
Figure 1.2: The OECD countries’ Gross Domestic Products in US Dollar in current prices, 1980 and 2014 ... 10
Figure 1.3: Comparison of GDP for The OECD countries and World Total in US Dollar in current prices, 1980 and 2014... 10
Figure 1.4: Employment Rate, Total % of Working Population, 2005 and 2014 ...11
Figure 2.1: Interest Rates Spread Over the Period of 2005 and 2015 ... 16
Figure 2.2: Long Term Interest Rates (10-years) Over the Period of 2005 and 2015 ... 18
Figure 2.3: Stock Market Exchange Indexes Over the Period of 2005 and 2015 ... 20
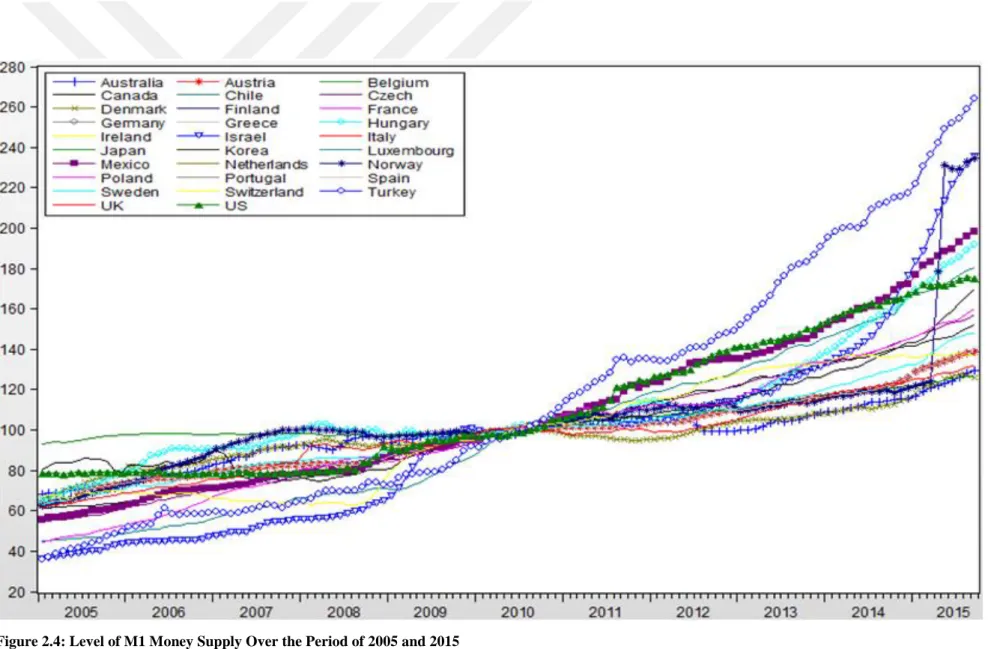
Figure 2.4: Level of M1 Money Supply Over the Period of 2005 and 2015 ... 22
Figure 2.5: Level of Industrial Production Over the Period of 2005 and 2015 ... 24
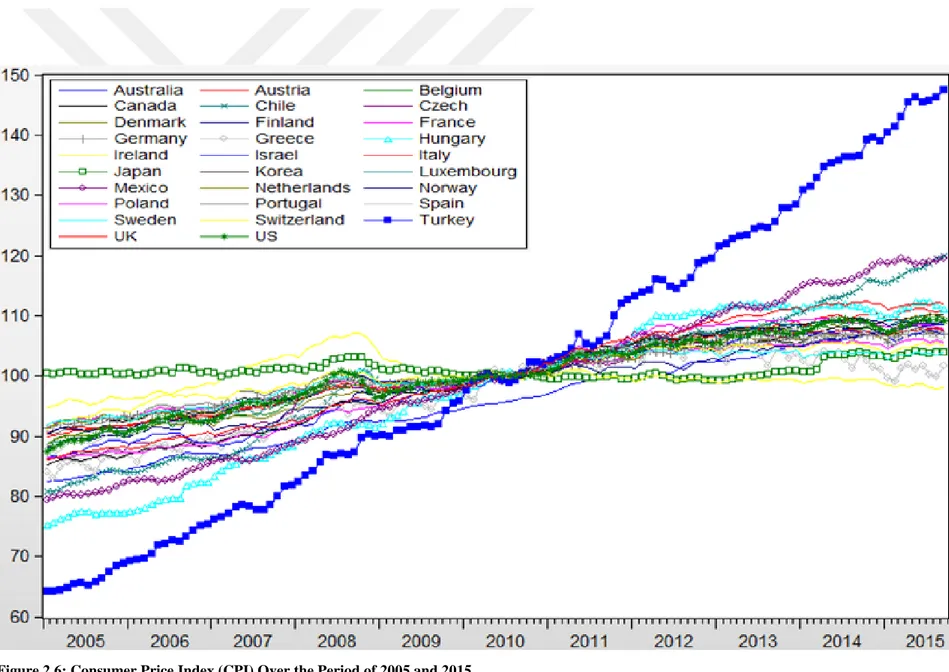
Figure 2.6: Consumer Price Index (CPI) Over the Period of 2005 and 2015 ... 26
xv
LIST OF ABBREVIATIONS
ADF Augmented Dickey-Fuller Test
ARDL Autoregressive Distributed Lags
BoE Bank of England
BoJ Bank of Japan
CADF Cross-Sectionally Augmented Dickey-Fuller
CD Cross-section Dependency
CIPS Cross-sectionally Augmented IPS
CPI Consumer Price Index
DOLS Dynamic OLS
ECB European Central Bank
ECM Error Correction Model
EPU European Payment Union
FED Federal Reserve
FMOLS Fully Modified OLS
GNP Gross National Product
GDP Gross Domestic Product
ILT Im, Lee and Tieslau Test
IPS Im, Pesaran and Shin Test
KPSS Kwiatkowski-Phillips-Schmidt-Shin Test
LM Lagrange Multiplier
M&W Maddala & Wu Test
NATO North Atlantic Trade Organization
OECD Organization for Economic Co-operation and Development
OEEC Organization for European Economic Co-operation
OLS Ordinary Least Square
PMG Pooled Mean Group
T-Bill Treasury Bill
U.K. The United Kingdom
U.S. The United States
1 INTRODUCTION:
This thesis is dedicated to investigate the long run relation between interest rate spreads and economic activities which includes industrial production, inflation and unemployment rate- in OECD countries over the period of between 2005 and 2015 by using panel data analysis. This thesis will use latest panel data models that take structural breaks and cross-sectional dependency into account. Besides using panel data analysis on this issue, this thesis will also try to see the effect of new monetary policies that are taken place by major central banks on yield spread and economic activities especially industrial production. As it is known that, in the post financial crisis of 2008 period, major central banks such as Federal Reserve1 (The FED was the first central bank that started to implement new monetary policies just after collapse of several large scale investment banks in the U.S), European Central Bank, Bank of Japan and Bank of England, have taken action to stimulate the world economy. Henceforth, not only these major central banks, but also other economies started to lower their policy interest rates soon in conventional way. These policies pushed interest rates almost to zero and since then the rates have remained very low due to lower output level and disinflationary fears.
The reason why academic worlds as well as the real world institutions such as central banks and policy makers are interested to know the intuition behind yield curve and economic events is explained by Dotsey (1998). The author categorises predictive content of interest rate spread into four groups that are influenced by future economic movement. These interested groups are private businesses, central banks, governments and foreign investors. The judgement from the movement of yield curve perception can give assistance to the interested parties to take right action in their monetary policy stand and produce to help future planning decisions.
In literature, when the interest rate spread of 10-years bond and 3-months Treasury bill squeezed or narrow, it means that future economic activities should also fall accordingly. Because it is believed that when the spread between long term rates and short term rates are converge or the yield curve flattened, the economic activities are followed to be slowing
1 The FED was the first central bank that started to implement new monetary policies just after collapse of
several large scale investment banks in the U.S. For example its first action was to set up Troubled Asset Relief Program (TARP).
down in the future. This association is important for policy makers to have a better future economic planning. The intuition behind this theory is explained by Estrella and Hardouvelis (1991). Their empirical study suggests that a flattening of the yield curve predicts a drop in the future interest rates and that these lower rates are associated with a lower level of Gross National Product (GNP) output.
In their work, Estrella et al., (2003) gives the importance of yields curve spread as it helps to effectively predicts economic direction for monetary policies. If the central bank raises short-term interest rates and market participants expect this policy to be effective in curbing inflation in the long run, long-term rates (the averages of future expected short rates, according to the expectations hypothesis) should rise in smaller proportions. Thus, a restrictive monetary policy tends to flatten the yield curve, and at the same time slows down the economy (Estrella, 2005; Bernanke, 1990). Estrella and Mishkin (1997) refer that the most fundamental determinant factors behind interest rate spreads are short term interest rates, long term interest rates and central bank policy rates. These will be discussed later when variables are defined.
Proper econometric analysis can reveal useful insight that can be used for policy maker, especially for central bankers and researchers. As Dotsey (1998) quotes that “it is important for the Federal Reserve (the Fed) in deciding the stance of current monetary policy”. The predictive content of interest rate spreads can help market makers to foresee future economic development and take monetary and economic projections accordingly.
This thesis will document useful variables to project the long run relationship between interest rate spreads with some indicative variables such as stock market prices, money supply of M1, Long term interest rates and economic activities which includes industrial production, consumer price index and unemployment rates in OECD countries.
The objective of thesis is not only to examine the long run relation of spread and economic activities, but also considers that there are several compelling macro-economic and financial characteristics variables that had been used in the literature. These macro-economic and financial variables are as follow,
3
Macro-economic variables: (These are also dependent variables in our models)
Industrial production
Consumer Price Index (CPI) Unemployment rate
Financial variables: (These are also independent variables in our models)
Spread (Long term interest rates – Short term interest rates) Stock exchange index
M1 money supply Long term interest rates
The literature uses several other economic activities such as durable orders, retail sales, consumption, personal income (Bernanke, 1990). However, due to data inefficiency and duration mismatches among the OECD countries, these variables cannot be used in the analysis. Further, the reason why above macro-economic variables are chosen is explained by Bernanke (1990) and Bernanke and Blinder (1992) that these variables often monitored by policy makers in terms of measuring the economic situation.
This study will contribute to the literature in the following regards; first, this study is thought , to the best of our knowledge, the first study that uses panel data analysis in the field of relation between interest rate spread and economic activities. Second, the study also tried to imply latest panel data methods for finding long run relation and regression estimation. For instance, tests of unit root, co-integration and panel estimation considered cross-sectional dependency. In literature, the previous studies have employed usually time series analysis. When using panel data analysis, it could give the opportunity to assess the earlier results a generalisation for a group of countries. Third, this study is believed to be one of the few study that analyse the relation of spread and economic growth after the financial crisis of 2008, which is regarded as the biggest economic crisis since the Great Depression.
The organisation of this thesis is as follows:
Section I provides an overview of OECD organization including the role of the organization in the world economics, its organizational structure, members, partners and bodies. Section II will bring forth financial and economic activities in OECD countries to see comparable developments. Section III summarizes literature review on relationship between terms structure of interest rate and economic growth and the reasons behind the linkage between yield curve and economic growth and analysis of the theoretical background of interest rate. This section will further discuss the literature review on other financial and economic activity variables. Section IV will bring up identification and discussion of variables included in the analysis and outlines the thesis’s methodology and hypothesis. And finally, Section V will conclude the finding of the thesis and gives brief suggestions about this issue.
5 CHAPTER I:
AN OVERVIEW OF THE ORGANISATION FOR ECONOMIC CO-OPERATION AND DEVELOPMENT
INTRODUCTION:
This chapter will introduce the role of the Organization for Economic Co-operation and Development (OECD), which was founded in 1961 in Paris. The reason why this chapter has been included in the study is that, when looking at previous studies regarding the issue of relationship between financial indicators and economic activities, we see that many empirical works focus on large economies such as the U.S, the U.K, Germany, Canada and other most advanced economies. And, all these countries are also represented in the Organization for Economic Co-operation and Development beside some other major emerging economies with the exception of largest emerging economies of China, India and Brazil. Though, the OECD is closely working and partnering with those countries.
In fact, one of the main roles of the OECD in world economics is that it produces ideas, does research on economic developments, such as what factors affect economic activities, and does recommendations on policies for member and non-member countries. In one his speech at one of the Executive Council on Global Diplomacy, Angel Gurria, the Secretary-General, described the role of the OECD as following: “the mandate of the OECD is to promote by “consultation and co-operation […] the highest sustainable growth of their economies and improve the economic and social well-being of their peoples”2.
In this chapter, the various role of the OECD in world economics, its role on designing economic developments with regards to research on financial and economic activities, organization’s structure and its members and partners will be examined.
2 Source: OECD, http://www.oecd.org/about/secretary-general/oecd-role-in-global-economic-governance-remarks-at-executive-council-on-global-diplomacy.htm
1.1. THE CREATION OF THE OEEC
OECD was established in 1961, to restructure European economies after Second World War the organization was a continuation of the previous economic organization called The Organization for European Economic Co-operation (OEEC) which was founded just after Second World War in 1948. This was created by Marshall Plan which proposed European countries to work on and assist their recovery and aid programme. The organization’s aim was not only to deal with the American aid but also to promote free trade among the countries.
OEEC originally had 18 participant countries3. These countries were Austria, Belgium, Denmark, France, Greece, Iceland, Ireland, Italy, Luxembourg, Netherlands, Norway, Portugal, Sweden, Switzerland, Turkey, United Kingdom, United States, Western Germany and The Anglo-American zone of the Free Territory of Trieste.
The OEEC founded with the aim of the following principles4:
Encourging European countries to adopt national production programmes in the post war period.
To expand and develop trade between European countries, tariffs would be removed. To create a custom union and free trade area.
Easing payment system within member countries. Reforming labour market within the group members.
Further capacity can be mentioned about the role of the OEEC, which had the mission to encourage European countries to get the U.S. help and recover from the ruin of the World War in order to restructure their broken economies. The first objective of the OEEC was to engage to allocate moneys promised by Marshall Aid Plan for European countries with the assistance of the U.S. and to make up countries’ balance deficit. Later on, when there was currency crisis in Europe, especially in Britain, the U.S decides to extend the aid by
3 Source: OECD, http://www.oecd.org/general/organisationforeuropeaneconomicco-operation.htm 4 Information is taken from the OECD.
7
providing credit to member countries in exchange to agree to free 50% of private import trade in foodstuffs, manufactured products and raw materials.
In 1950, Europeans decides to regulate their currencies trade and creates a payment system called European Payment Union (EPU) under the control of the OEEC with the following objectives:
Easing European currencies conversion. Removing quantity restrictions.
Suppress bilateral commercial practices.
1.2. THE CREATION OF THE OECD
When the Marshall Plan ended and countries favoured North Atlantic Trade Organization (NATO), which is a mutually security and economic organization, the influence of OEEC begins to decline. However the member countries use the OEEC’s structures for NATO for the aim of the functionalities. For example, to promote NATO alliance’s, members propose to use the OEEC and its committees, teams of experts and statistical output. It should also be noted that the OEEC was partly used only for European member countries economic problems.
The OEEC was replaced by the Organization for Economic Co-operation and Development (OECD), a worldwide body. Members of the OECD were not consist of European founder countries but also included the U.S. and Canada. Over the years, as the organization as the integration, economic development and trade advanced among the member countries the organization has expanded. Today there are 34 countries are represented in the OECD. Since its creation in the post war period, the OECD has dedicated to improve and integrate economic policies and social welfare for members and other major trading partners.
OECD does not only promote free trade and removing barriers between its members but also contribute world economic knowledge by sharing experiences to have solutions for economic upheavals and while understanding the economic policy, the organization works closely with members governments.
A news taken from the BBC News describes the OECD as an non-academic university5. In fact, since the OECD has been engaged in dealing with the economic problems, it has produced many research articles by working closely with member governments, business industry, labour unions and academia. For example, the organization tries to find solutions on social and environmental change, measures productivity and flow of trade and investment, analysis and forecast the future economic trends and set international standards from agriculture to tax regulation.
The OECD not only assist governments with above economic issues but also help to provide policy suggestion issues like daily life, social security. For instance comparing different schooling and pension systems of countries with the aim of supporting countries by backing their market economies with democratic institutions.
1.3. THE PLACE OF OECD MEMBERS IN THE WORLD ECONOMIC SCENE
Today as the organization has an important role in world economic arena, its members also has a great place shaping the world’s industrial and technological growth, trade, labour and investment environment.
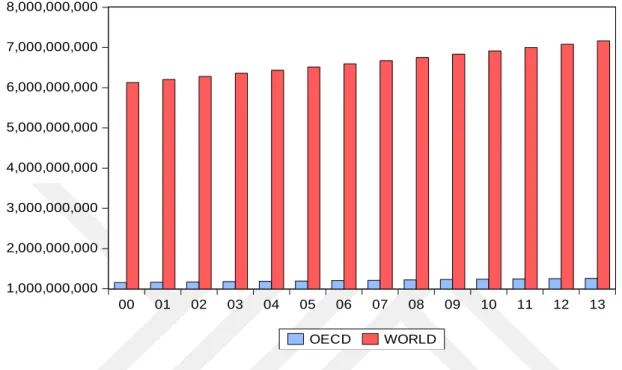
Before going further to see the main economic indicators of OECD countries in world economics, first we should look at the ratio of population of OECD members to the world population. The figure below shows the number of population for both the total OECD countries and the world population over thirteen years between 2000 and 2013. The share of population of the OECD countries to the world is about 17,5% as of 2013. However, as mentioned below, the 17,5% population dominate 64% of world economic output. Which can be interpreted that the remaining population of the world countries are low income countries.
The figure indicates that while the increase in population of the OECD is steady over the years, the same increase is upward in the case of whole world. This is understandable due to aging population. Because, as the OECD mainly consist of advanced economies, there is concern that growth in population of these countries is not enough for demographic reasons
9
(Fougere and Merette, 1999). The authors also point that as the aging problem arise in advanced countries, this will have significant negative effect on macroeconomic and so on fiscal policies of these countries.
Figure 1.1: The world and the OECD population level in billions, between 2000 and 2013.
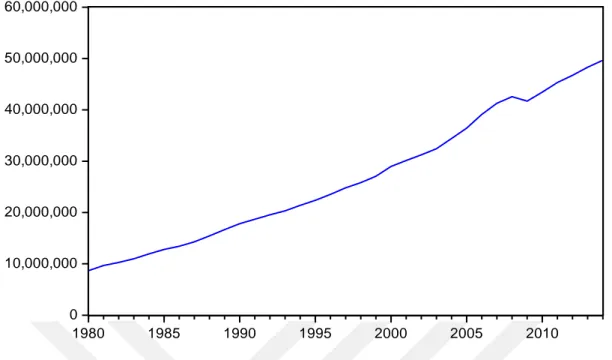
The OECD countries dominate world’s trade today. Looking at the figures of Gross Domestic Products (GDP), which measures the total value of goods and services produced in a country, the OECD countries produces more than half of the world’s GDP today. As of end of 2014, the world’s GDP totals to about 77,8 Trillion US Dollars6 and of this value, about 50 Trillion US Dollars7 produced by 36 countries of the OECD organization (See figure 1 below). It should also be noted that the World Bank data consist of world’s total 193 countries. Which indicate that the OECD members’ GDP ratio to world is about 64%.
When looking at below figures, it can be seen that the OECD countries’ production magnitude of goods and services has an upward trend since 1980. From 1980 to 2014, in 34 years, the OECD members increased their economic growth level almost five-fold from 10 Trillion US Dollars to 50 Trillion US Dollars.
6 Source: World Bank, http://databank.worldbank.org/data/download/GDP.pdf
7 Source: OECD, https://data.oecd.org/gdp/gross-domestic-product-gdp.htm#indicator-chart 1,000,000,000 2,000,000,000 3,000,000,000 4,000,000,000 5,000,000,000 6,000,000,000 7,000,000,000 8,000,000,000 00 01 02 03 04 05 06 07 08 09 10 11 12 13 OECD WORLD
Figure 1.2: The OECD countries’ Gross Domestic Products in US Dollar in current prices, between 1980 and 2014. (Total, in Million US Dollars)
Figure 1.3: Comparison of GDP for The OECD countries and World Total in US Dollar in current prices, between 1980 and 2014. (Total, in Million US Dollars)
0 10,000,000 20,000,000 30,000,000 40,000,000 50,000,000 60,000,000 1980 1985 1990 1995 2000 2005 2010 20,000,000 30,000,000 40,000,000 50,000,000 60,000,000 70,000,000 80,000,000 00 01 02 03 04 05 06 07 08 09 10 11 12 13 14 OECD GDP World GDP
11
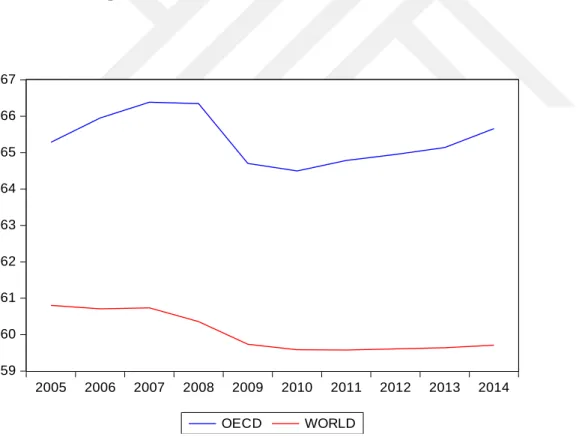
As it is mentioned above that OECD dominate the world economic output, this fact is backed by the number of employment level when the OECD figures compared to world. When looking at the employment ratio, i.e. the total percentage of working age population of the two groups, it appears that the number of people employed in OECD economies is much greater than the world average. For example, as of end of 2014, the OECD countries’ employment rate stood at 65,6%, while the average world employment was at 59,7%. This result is quite predictable. Because, since OECD members include major industrialised countries their share of output is greater in comparison to the rest of the world. Further, as pointed out above, when the population figures introduced, the population level is steady and do not increase over the last couple of decade in OECD countries. In contrast, the rest of the world has seen a rise in their population. This situation obviously draws the employment down in especially undeveloped world. Another point is that, the graph below indicates that, at the time of financial crisis in 2008, the employment rate falls during the crisis. This drop is much more visible for the OECD members.
Figure 1.4: Employment Rate, Total % of Working Population, between 2005 and 2014.
59 60 61 62 63 64 65 66 67 2005 2006 2007 2008 2009 2010 2011 2012 2013 2014 OECD WORLD
1.4. ORGANISATIONAL STRUCTURE OF OECD
In this part of the chapter, an oversight of OECD will be examined to see how the organization functions with its council, committees and secretariat. Before giving information on the basic structure of OECD, some other information about the budget of the organization will be given.
The organization is funded by its members. Funds are collected in accordance with the members’ economic size. For instance, the U.S. is the largest contributor with providing 21% of the budget. Japan with its size, comes second financier. The budget and related programme are decided by its members for every two years. The budget programme is supervised by external independent audit which is performed by Supreme Audit Institution of an OECD member country, appointed by the Council.
OECD exercises its information gathering power to help related parties such as governments, business and academia, to improve their prosperity, develop their economic growth and financial stability.
The OECD, when helping the governments in their research, follows the following procedures8: Data Collection Analysis Discussion Decisions Implementation And finally,
Peer reviews, Multilateral surveillance
13 1.4.1 The Council
The Council of the OECD is decision-making and governing body of the organization. The council’s aim for the member countries is that it recommends policies regarding economic issues. For instance, when regular meetings are held, it can discuss economic issues ranging from financial stability of the world economics to tax agenda.
The OECD council is formed by one representative who is assigned from each member. In addition to representative by the members, a representative from the European Commission is represented in the council. The decisions of the OECD are taken unanimously when the council meets regularly. These meetings are chaired by the OECD Secretary-General. To discuss important issues of global economics, the council also meets at ministerial level once a year. The decisions taken are implemented by the Secretariat of the OECD.
For example, at the ministerial meetings, a statement of comments are drafted to present past performance of the OECD, specifies issues that member countries are facing and suggest aims and recommend policies for the OECD members (Grinvalds, 2011).
1.4.2. The Committees
The OECD states that there are about 250 committees, working and expert groups within the organization. The goal of these groups or committees are to review progress in areas such as economics, trade, science, employment and financial markets. These committees and groups are represented by the all 36 member states.
Marcussen (2004) points that about 40.000 delegates from each member country attend 15-20 working meeting each day. In her thesis, Grinvalds (15-2011), when reviewing the OECD’s committees, she points that the committee structure of the OECD is “hierarchy of multiple -lead- committees supported by what are typically called -working parties- or -working groups”
1.4.3. The Secretariat
There is about 2.500 staff in the secretariat. The staff’s main job is to support the work of committees and exercise and response priorities determined by the OECD Council. The OECD specifies that their staff include economists, lawyers, scientist and other professional.
The head of the OECD Secretariat also chairs the Council and provide the link between national delegations and the Secretariat.
15 CHAPTER II
A BRIEF OUTLOOK TO FINANCIAL AND ECONOMIC INDICATORS
This section introduces financial and economic activities in OECD countries to see comparable developments. In this chapter, the graphs of each variable are drawn to see comparable behaviour between the countries. Both, financial and economic indicators display that there appears to be divergence in challenging economies of European countries such as Greece, Portugal, Spain and Italy within the investigated period. For example, these countries experienced higher level of interest rate in contrast to lower level of industrial output.
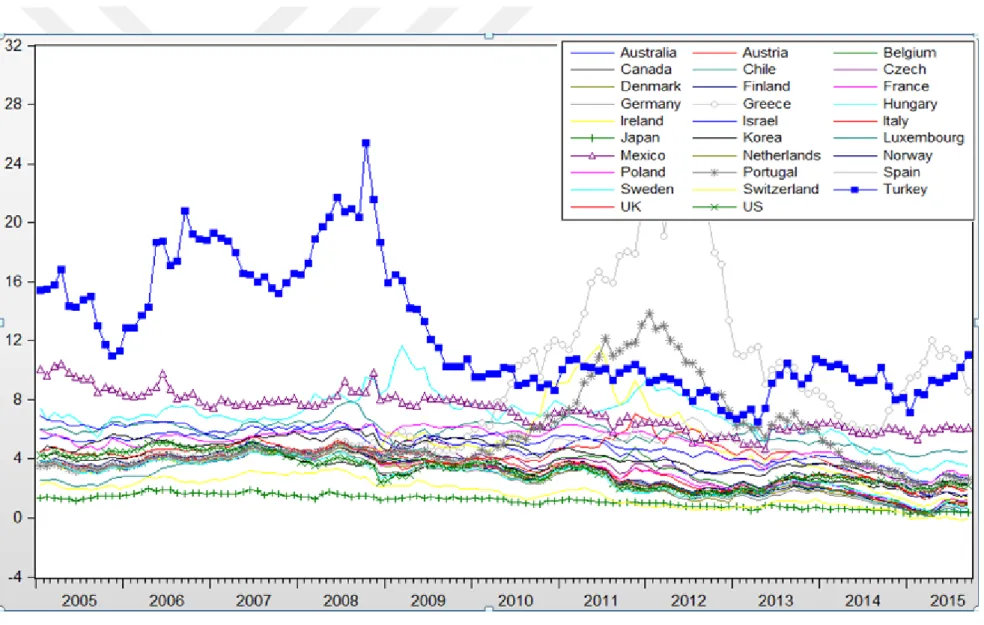
2.1. INTEREST RATE SPREAD (10 years bonds – 3 months T-bills)
In the spread side, the below figure shows that the spreads between 10-year and 3-month T-bills for all OECD countries move in the same direction within the analysed period (See Figure 2.1). This situation is understandable as the OECD economies are integrated strongly. Change in interest rates in one country poses effective adjustment on other countries. Here, especially the world’s most powerful central bank’s, The FED, fundamental decisions are playing bigger roles.
Nevertheless, the below figure also indicates some extreme fluctuations in spread than other member countries after the financial crisis of 2008. The biggest variation and positive spread occurs for Greece and Portuguese’s spread and slightly higher variation appear to have been for Ireland, Spain and Italy. This movement seems to be normal as the mentioned countries were affected most during the crisis. As the higher spreads imply greater future economic activities, so, in the post crisis period, higher spreads of these countries imply their economies were expected to recover soon according to theory. Another explanation could be that long term rates were increasing more than short term rates in that period, due to preferred habitat theory, which asserts that investors demand higher risk premium for longer term investment. In fact, when looking at long term interest rates of OECD countries from Figure 2.2, it can be seen that long term interest rates are higher for these countries.
17
2.2. LONG TERM INTEREST RATES (10-year government bonds)
On the long term interest rates side, for all OECD countries, the longer term rates seems to be decreasing over the analysed period (See Figure 2.2). This is due to decision by central banks to stimulating economies by lowering short term interest rates and unconventional monetary policies of asset purchase program. For these reason long term interest rates of many member countries have been at low levels since the crisis. The expectation of deflation fear for developed countries, such European countries and Japan, also led long term rates to stay very low.
As it mentioned above in the case of spread, for troubled European Union countries, such as Greece, Portugal, Ireland and Italy the longer term interest rates are higher than other members. The reason for this is discussed when variation in spread introduced.
The lowest long term interest rates emerge for Japan before and after the crisis. On the other hand, the long term interest rates were much higher for Turkey prior to the crisis, however, especially after crisis, the trend for Turkish long term interest rates had gone down similar to other members.
19 2.3. STOCK EXCHANGE INDEXES:
On the stock exchanges indexes side, again all OECD stock markets performance looks to be correlated in the same direction during the analysed period. The stock markets seem to be increasing before the crisis until they reached their peak level in July of 2007. However, once financial crisis of 2008 deepened, stock markets tumbled through 2008 till March of 2009 and bounced back afterwards as the markets conceived the way central banks are doing well.
The average fall in stock markets during the crisis were stood at about 50% to 60%9. The biggest fall took place in Greece and Ireland stock markets, which faced almost 70% of its value slipped due to debt trouble. While Irish stocks have recovered after the crisis, the Greek stocks could not regain and even fall further. From the figure 2.3, it is observed that the best performed stock market is Denmark in the post crisis period.
21 2.4. MONEY SUPPLY OF M1
On the M1 money supply side, the figure illustrates an upward trend in money supply since 2005 till 2015. The upward trend got sharper after the crisis, in particular later 2010. The reason why money supply increased in the post crisis is that almost all the major and other central banks of members of the OECD countries have undertaken stimulus programme to boost output growth and increase consumption demand.
Having said this, for instance, the FED stared to implement and unconventional monetary policy of Quantative Easing Programme, by which, the FED aimed to buy back government securities as well as corporate securities to with the goal of decreasing interest rates and increasing money supply. Not only The FED, but also other major central banks such as European Central Bank (ECB), Bank of Japan (BoJ) and Bank of England (BoE) including some of small scale economies started to use unconventional monetary policies. They also followed the FED in terms of buying longer term government securities and private sector bonds and reduced their policy interest rates. For instance, as Stiglitz (2016) reports in his paper that the balance sheet of FED, Bank of Japan, Bank of England and European Central Bank reached 25%, 82%, 21% and 31% respectively as of 2016.
Among OECD countries, the largest increase in M1 money supply comes from Turkey. Another point that this picture views is that, in the mid of 2015, the M1 money supply of Norway experiences a sudden increase of about 80% just in two months.
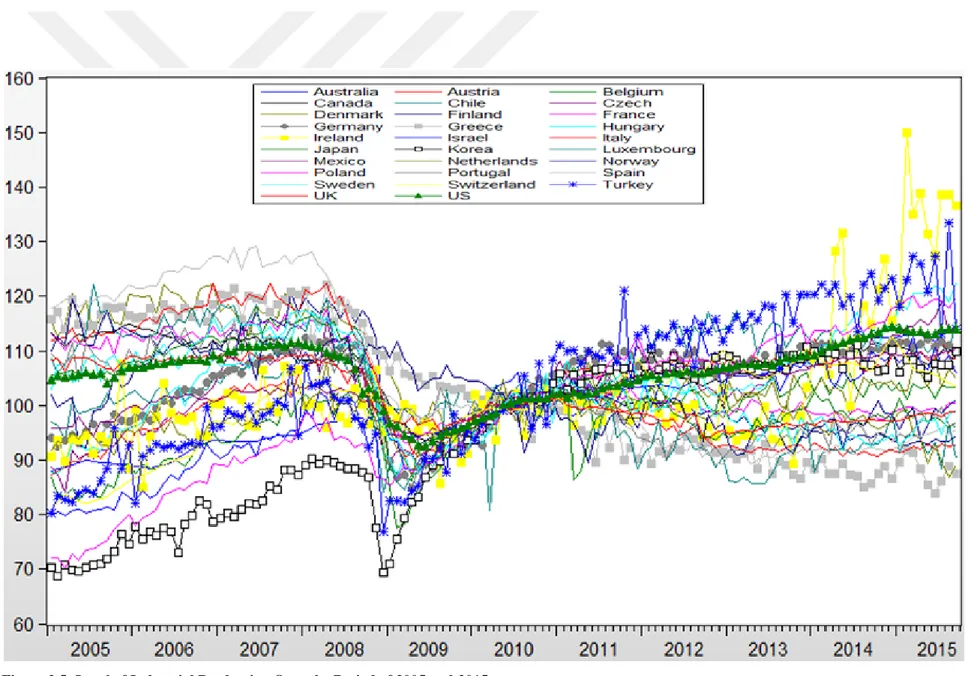
23 2.5. INDUSTRIAL PRODUCTION:
On the industrial production side, the effect of financial crisis is evident from thr Figure 2.5 in between 2008 and 2009. Prior to the crisis, there was a stable increase in all countries, however, once the crisis felt by the economies the level of industrial output fell significantly. It should be noted that industrial production index is generally used as a proxy to gauge GDP for countries.
As mentioned above in policies regarding money supply, by introducing new unconventional monetary policies and reducing interest rates, the central banks’ action, actually, have succeeded in recovering the output growth in the post crisis period. Among the most affected countries from the crisis, Ireland seems better than Greece in terms of growth in industrial production. Turkey appears to be the country that performs well amid OECD countries in the post crisis period. The overall picture shows that, while some countries production levels were increasing, others seem to be experiencing struggling to raise their output level aftermath of the crisis.
25 2.6. CONSUMER PRICE INDEX (CPI)
On inflation side, visible from the Figure 2.6, Turkey is the only country that had higher inflation rate in OECD group. This inflationary development for Turkey exists not only prior to the crisis but also continue after the crisis, yet slightly lower during the crisis. Apart from Turkey, the situation for Mexico and Chile look strange. For instance when the country had had lower inflation rate than other most of the OECD members, the inflation level accelerate thereafter. The only country that a flat inflation rate is Japan both prior and after the crisis. Nevertheless, it should also be noted that having implementing monetary easing, inflation seems to be slightly rising after 2014.
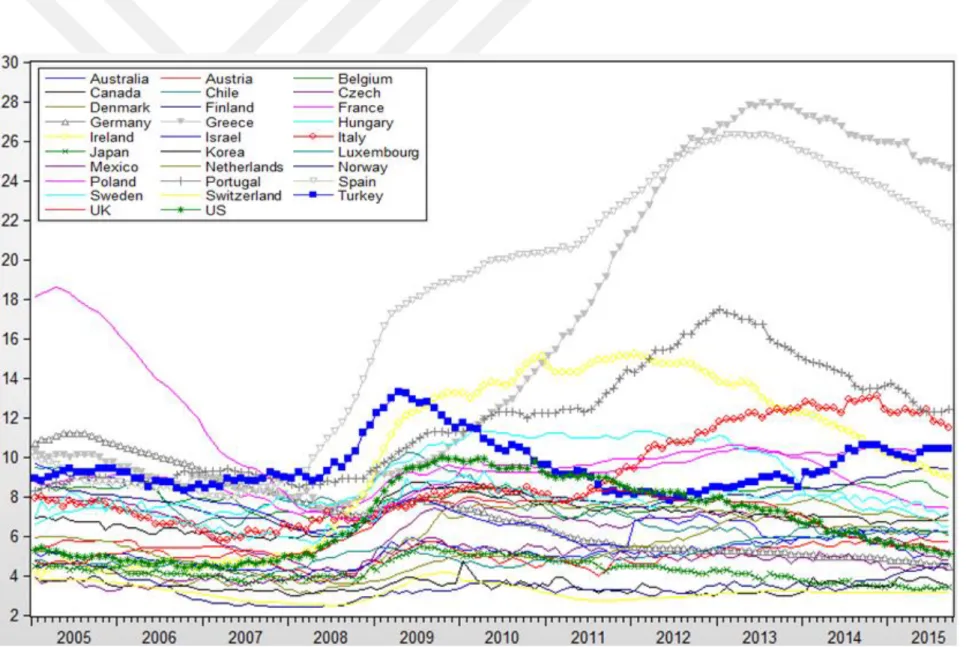
27 2.7. UNEMPLOYMENT RATES:
On the unemployment side, unemployment rate graph indicates that all countries have lower unemployment rates during the economic output is high and higher unemployment rates at the time lower output level. It is noticeable that the economically troubled European countries - these are Greece, Spain, Italy, Portugal and Ireland- experience the most unemployment rate during the analysis period. Even, in the post crisis period, these countries’ unemployment levels peak as high as 28% and 26% respectively for Greece and Spain. On the other hand, the most developed countries such The United States, Germany and Switzerland have lowest unemployment rate in between 2005 and 2015.
29 CHAPTER III
LITERATURE REVIEW AND THEORTICAL BACKGROUND
This chapter will summarize literature review on relationship between terms structure of interest rate and economic growth and the reasons behind the linkage between yield curve and economic activities with the theoretical background of interest rates. This section will further discuss the literature review on other financial and economic activity variables.
3.1 DISCUSSION OF VARIABLES IN THE ANALYSIS
3.1.1 Spread (Long term bond - Short term bill)
Interest rate spread or sometimes called term structure of interest rate (or yield curve) is defined by Estrella and Hardouvelis (1991) as the difference between 10-year Treasury bond yield and 3-month Treasury bills yield. The main argument that has been debated over the last couple of decades is the relation between spread and economic activities. Many empirical studies assert that in many cases when interest rate spread narrows or even becomes negative, the economic activities follow to slowdown afterwards or if the other way around occurs, then the economic growth will have an upward phase.
In the case of lower long term interest rates will give the expectation of future slower productivity growth in economies (Bauer and Rudebusch, 2016). When this expectation realised the long term interest rates will be lower than short term and this will imply a negative spread or a flat yield curve.
This issue of spread and economic activities is not only investigated by government long term bonds and short term bonds but also has taken several other interest rate spreads or other related variables into account. Among these, for instance, corporate bond spread (Papadamou and Siriopoulos, 2009), corporate profits (Ergungor, 2016), spread between overnight interest rates and Treasury auction interest rates (Berument et al. 2014),
In the last couple of decades, many studies have been conducted to examine a variety of country’s sovereign bond’s interest rate spread and economic growth and/or economic activities. Virtually, entire empirical works proved that there is a positive relation between the slope of yield curve and future economic activities. Among these empirical works, the well-known papers are Bernanke (1990), Estrella and Hardouvelis (1991), Plosser and Rouwenhorst (1994), Haubrich and Dombrosky (1996), Estrella and Mishkin (1997, 1998), Estrella et.al, (2003) Cuaresma et.al (2005) and Dotsey (1998). Likewise, Estrella and Mishkin (1996), Kozicki (1997), Bernard and Gerlach (1996) and Dueker (1997) used the yield curve to predict recessions and inflation in the U.S., Euro area, Germany and Canada.
This positive relationship does not occur at any time. Sometimes, As Bernanke (1990) point out that there may be no relation between spread and economic activities at some point. For example the author states that as time go on, this relation disappear in the United States.
On the other hand, there is the opposite case, where there is no relationship between interest rate spread and economic activities. This case exist especially for developing or less developed countries for example see Telatar et.al (2003) ; Omay (2008) Berüment et. al, (2014) for Turkey, Gupta et.al (2013) for India, Papadamou (2009) for Hungary. The reason for this may be that there are no well-functioning financial and capital markets and as stated by Nickel (2011) political and some other internal risks. Further, these countries did not have very long term borrowing securities due to inefficient capital markets and higher risk premium.
The Theory of Why Do Interest Rate Spreads Affect Economic Activities
According to Estrella and Hardouvelis (1991) a flat or concave yield curve can be interpreted as falling future interest rates and that these lower rates are associated with a lower level of GNP output. For example Fama (1986) and Stambaugh (1988) show that increase in forward rates can be portrayed a future increase in economic expansion and a fall in forward rates will deemed activities to slowdown.
31
The main economic rationale for the yield spread’s predictive power is that it serves as an indicator of the effectiveness of the stance of the monetary policy (Estrella et al., 2003). The author believe that if central banks raise short-term interest rates and market participants expect this move as effective in curbing future inflation in the long run, long-term rates (the averages of future expected short rates, according to the expectations hypothesis) should rise in smaller fraction. For this reason a confining monetary policy, in this case, will lead to flatten the yield curve, and at the same time slows down the economy (Estrella, 2005). When looking at the literature, there are four common theories that try to explain movement in term structure of interest rates. These are expectation hypothesis, liquidity preference hypothesis, market segmentation hypothesis of Culbertson (1957) and preferred habitat theory. These theories identify and extract information about the changes in the variables that affect term structure of interest rate.
The expectation theory suggest that long term bonds rates indicate current short term bond or T-bills rates and expected future short term bond rates. According to expectation theory, in the case of an investment in bonds, it should not matter whether to invest in long term bonds or short terms bonds as their expected rate of return should be the same in terms of maturity that investment is placed. In that, investors should not be worry in their return, because the return in long term investment will almost be the same as short term investment. For instance, suppose that short term interest rates provide greater return when compared to long term interest rates. In this case the demand for short term bonds will increase and their prices and as a result the yield will fall. According to expectation theory, if investors expect interest rates will increase in the future, then the investors will require higher rates for long term interest rates to invest.
The theory of liquidity preference is simply that most of the investors try to invest their savings in liquid form. For this reason, investor can expect a higher premium for long term maturity securities. In opposite, by having short term securities, investor could easily sell their short term assets for liquidity purpose.
This theory first introduced by John Maynard Keynes in economics. Keynesian theory is based on three motives. The first one is transaction aim, which states that demand for money is depend on the level of income. In this case, income or money is needed for daily expense
transactions. The second motive is related to precautionary motive. In this case, people need demanding money for unknown periods. The third motive to hold money is about speculative aim. In this case, people can use these investments to take advantage of change in interest rates.
Market segmentation theory hypothesis was developed by Culbertson (1957) and is assumed that interest rates level are set in their own markets for different interest rates in different maturities, thereby there will be no link between long term interest rates and long term interest rates. For this reason, Culbertson (1957) suggests that interest yield in one segment of market cannot be used to estimate interest rate yield of a different maturity asset.
Preferred habitat theory suggests that investors could prefer one period of time segment which is proper maturity for their investment objectives. However, these investors could go for other securities in different maturities only if the available risk premiums are higher, i.e. if higher interest rates are offered, investor could change their investing period. For this reason, long term rates will be higher than short rates.
3.1.2 Long term interest rates (10-year Government Bonds)
Monetary policies taken by central banks have effect on economies through interest rates. For instance, industries such as durable goods, housing and fixed investments are sensitive to change in interest rates (Roley and Sellon, 1995). Long term rates are not influenced only by short term rate decision but also prospective inflationary expectations and risk premium. An upward long term real interest rates due to fiscal and monetary policies, could lower stock market prices (Blanchard and Summers, 1984). However, in their empirical work, they also see that when interest rates are higher stocks continue to be higher before 1984.
Stock and Watson (1989) believe that change in long term government bonds have effects on forecasting of economic activities. This relation is discussed when the relation of spread have been introduced above.
33
The reason why long term interest rates are chosen instead of short term rate is that short term interest rates are affected by business fluctuations and monetary policies in the short run, however, long term interest rates considers longer term economic prospect (Humpe and Macmillan, 2007).
Beside long term rates of 10-years, the literature also uses 3-month Treasury bill rates in several empirical studies. However, due to high correlation between long term rates and short term rates, short term interest rates are excluded from the analysis period10.
Furthermore, any movement of long term interest rates will have effect on the level interest rate spread which is altered by both short and long interest rate change. For instance, an increase in long term bonds interest rates, if greater than relative to short term rates, will expand spread. In opposite case, i.e. if short term interest rates increase more than long term rates than the spread will narrow. One of the example of this case has been given in the theory of spread that in inflationary period, if the market believe that central banks are going to decrease inflationary effects in the future, short term rates will be quick to rise relative to long term interest rates.
The empirical studies uses 3-month treasury bills and define short term rates that are influenced directly by the monetary policies set by the central banks. In their empirical works, Sim (1980), Grossman and Weiss (1980), Litterman and Weiss (1983) found that interest rates are better at predicting future output better than monetary base or money stock. Similar conclusion also was drawn by Bernanke’s paper of 1990.
Grossman and Weiss (1980) suggest Treasury bill interest rates are better for prediction, because the authors state that “interest rates affect output because they help to distinguish relative from aggregate productivity shocks which influence each agent's desired level of investment”. It is understood from this passage that when there is an interest rate shock, the investment decision of firms will be affected and this effect will be channelled to change the level of output produced. These results are consistent with economic theories that due to tight monetary policy, real interest rates become higher which leads delay in investment and
10 The statistical results reveal that the correlation coefficient is 96% among short and long term interest rates
decline in future output (Stock and Watson, 1989). According to Cozier and Tkacz (1994), the cycle of lower short term rates relative to long term rates could react to liquidity effect on short term rates of expansionary monetary policies.
3.1.3 Stock Index
The stock prices movement are thought to be one the financial indicators that can predict the future direction of economic activities, because financial markets are forward looking. In fact, stock markets price assets when new information arrives and reacts to this news accordingly (Chan, 2003). Hence, if the future of economic movement appears to be positive, then the stock prices buy these positive developments in advance and their prices increases with the magnitude of information at hand. Hence, there should be long run relation between stock prices and economic activities.
When looking at the literature that how stock prices are correlated with economic activities, Cozier and Tkacz (1994) uses the growth of stock price index to see the relation to the economic growth. The authors note that stock prices predict economic activities for only short term of one to two quarter. Similarly, Valadkhani (2004) uses Australian stock price index to show the prediction power of stock prices to economic growth and finds that stock prices can predict Australia’s economic output. Nevertheless, Papadamou (2009) found negative relation between stock market index and economic activities for Eastern European countries and noting the reason that stock markets in those countries may not be well developed. In the Turkish context, Cankal (2015) investigates the relation between stock market and macro-economic variables in Turkey. The author finds a negative correlation between stock market and inflation, exchange rate and interest rates.
3.1.4 Industrial Production Index
Despite using Gross Domestic Product (GDP) as a common measure of the overall economic performance of an economy, Industrial production index will be used in the analysis because of availability of monthly data as GDP is computed quarterly. These two
35
measures, GDP and Industrial production, usually used by economist to see the business cycle; however GDP is more extensive measure of overall economy than industrial production (Moody et. al., 1993).
Industrial output, which sometimes referred as business cycle in literature, is directly related to the growth of the economy in a country. Therefore, a change in output level is easily affected by the change in economic and fundamentals such as interest rates, monetary stance of central banks, price of assets, which is stock prices, and political issues.
Further, Industrial production even determine other economics activities such as unemployment rate, produced goods, housing units, investment and saving rates (Moody et. al. 1993), inflation and capacity utilisation.
The relation between industrial production, alongside with other economic activities, and financial variables is going to be analysed. For example, the literature suggest that if interest spread widens then it is highly likely that the industrial output will be affected positively and there will be an increase in output in the near future. Similarly, an increase in stock prices will mean good news for corporate in particular and for the economy as a whole and subsequently the industrial output will benefit from this positive environment.
3.1.5 Consumer Price Index
The literature suggests that there is predictive power of interest rate spreads for inflation, alike output. For example Estrella (1997, 2004); Ivanova et. al. (2000); Bernanke (1990); investigated the predictive power of interest rate spreads on inflation on several developed countries and Telatar et. al. (2003) and Şahinbeyoğlu and Yalçın (2000) on Turkey.
The above researches find the power of spread to predict the future inflation. The rationale behind interest rate spread and inflation is the theory that an upward sloping yield curve indicates an expected higher future interest rates i.e. a positive interest rate spread will signal higher future interest rates.
When the theory of interest rate and economic activities were explained, Estrella et al., (2003), Estrella (2005) and Bernanke (1990) introduced the reasoning of why interest rate spread is so informative about future economic growth and future inflation. In that, the authors give justification that if the central bank increases its monetary policy rate, then the market participants will react to this news. The way of the reaction is that the participants will consider this move by central bank to tame future or decrease future inflation. Hence, if the increase in short term rate were to be successful in reducing future inflation rate, then the increase in future expected long term interest rates will be less than the increase in short term interest rates.
As a result, the yield curve will be flattened as mentioned by Estrella (2005). In terms of future expected inflation, this procedure will drive down the inflation. It can be concluded that an inverse yield curve will signal a future lower inflation rates for the countries.
3.1.6 Unemployment Rates
Employment rate is another economic indicator that especially central banks are focused on since the economic slowdown of 2008 financial crisis. When looking at Federal Reserve policy of late economic discussion, the FED puts emphasis on, apart from price stability, employment rate of the U.S. economy. The FED’s goal is that if the economy is in full employment level then there may be some room to increase interest rate which also might be considered the economy’s growth phase is accelerating. As previously mentioned above, if the FED increases its policy rate, the capital markets will consider this rate hike a signal of robust economic growth and short term rates increases more than long term rates and the interest spread will fall. (See discussion related the behaviour of short interest rate and long term interest rates above).
In literature, Papadamou and Siriopoulos (2009), when analysed the effects of monetary policies on unemployment rate in South Korean economy, they find a positive relation between corporate bond spread and unemployment rate which was predicted several months ago by the spread used. However, the authors also believe that the response of unemployment rate to change in monetary policies were smaller.
37
In contrast to employment rate, unemployment rate decreases if the economic growth increases. Seasonally adjusted employment rate and non-agricultural unemployment rate will be used in the analysis to see their relation with the financial variables.
3.1.7 Money supply of M1
Several researches point that money supply can be use to see future economic developments. For instance, Estrella and Mishkin (1995) uses M1 money supply as a proxy for monetary policy and uses M1 beside spread and short term rates in analysing the effect of spread on economic activities. Berument et. al (2014) state money supply of M1 as total size of monetary aggregates and a measure of liquidity. Here is the rationale is that increasing money supply will lower interest rates as the supply of monetary base increases according to central banks’ policy decisions. The conventional wisdom is that short term interest rates will soon react to the money supply and these rates will increase before long term interest rates in capital markets. Hence, increase in short term rates will lower interest rate spread in the short term.
From the perspective of economic activities, as the amount of money rises the interest rates on loanable funds will decrease and the availability of funds would be easier for businesses. Thus, expanding monetary base will boost industrial production and accordingly will lower unemployment rate in the period concerned. However, on the other hand, as money supply increase, inflation may be triggered as the consumption and investment increases.
In fact, more recently, when central banks’ action are being analysed, major central banks such as the FED, ECB and BoJ by employing unconventional monetary policies of increasing money supply in the markets have tried also to increase inflation rates which have been in very low level in the post crisis period.
3.2 LITERATURE REVIEW
Literature review on the issue of spread and economic activities are documented below. General literature studies have been on countries on more advanced economies. This seems to be reasonable as advanced economies have had longer term rates previously. However, developing countries or less developed countries, on the other hand, did not have very long term borrowing securities due to inefficient capital markets and their higher risk premium.
The predictive content of interest rate spread appears to be weak especially for developing countries such as Turkey (Berüment et. al, 2014, Omay, 2008), India (Gupta et. al, 2013), Hungary (Papadamou, 2009).
Here below, the literature review documented by including a summary of researches, applied econometric models, authors and publishing journals.
39 Author- Year Published
Paper
Analysed Countries
Data Type and Frequency Econometric
model
Results and Conclusions Bernanke, 1990 NBER
working paper
USA Monthly data
Financial variables:
- Variables used: 10 Yr Gov bonds minus 3 Month T-Bill spread.
- Commercial paper and T-Bill spread (6 month). - Commercial bond and Gov. bond spread(10 year).
- 10 yr T bond minus Fed Fund spread.
Explained economic variables: - Industrial Production - Capacity Utilisation - Housing stats - Unemployment - Employment - Retail sales - Personal ıncome - Consumption - Inflation OLS model -univariate and multivariate comparisons.
The spread between commercial paper rate and T-Bill seems to be a better at forecasting economic activities. This spread further gives information about default risk. This spread is also a measure of monetary policy. The author suggest that the power of spread is more in 1980’s and weak afterwards. This is due to the FED’s procedures of interest rates and substitutability among the other money market instruments due to deregulation and financial innovations. Estrella and Mishkin, 1997 European Economic Review USA, Germany, France, Italy and UK
To explain Spread: (Bond-Bill) or (Bond-Central bank rate)
- Central bank rate - T-Bill rate (3-month) - 10 yr gov. bond used. To explain output: - Spread VAR, OLS and Probit model (This is for predicting recession)
The authors conclude that monetary policy plays an important role in terms of determining interest rate spread. This paper applied the power of spread to predict future output and inflation not only on the US but for major European countries such as Germany, the UK, France and Italy and
- GDP
- Central bank rate - T-Bill rate
- Real central bank rate - Money supply (M1) To explain Inflation:
- Spread
previous results are similar for these countries. Spread can predict real activity and inflation at least one year in advance for the US but for European countries at least for two years horizons. Not only spread that has the predicted power but also other monetary policy instruments have effect on future output and inflation which defers country to country. The authors suggest ECB that spread can be influenced by monetary policy actions. Ivanova Lahiri and Seitz, 2000 International Journal of Forecasting
Germany Monthly data used. To explain inflation:
- Public_TS= Spread between 9-10 years bond and 1-2 years bond (public)
- Bank_TS= Spread between 9-10 years bond and 1-2 years bond (Bank bonds)
- Bank_Public= Spread between bank 1-2 years and public 1-2 years bonds - Lombard_TS= Spread
between 9-10 years public bond and Lomard rate - Call_TS= Spread between
9-10 years public bond and call rate. Two-regime Markov-switch model, Turning point forecast.
They suggest that public and bank term structures are obviously influenced by monetary policies. The bank–public spread, in addition, captures factors such as default risk and private financing needs (pointed by Bernanke, 1990), especially in building and construction in the context of Germany. It is the aim of this paper to see comparative performance of several spreads.
Their finding conforms to previous researches that yield spreads are useful tool for forecasting inflation and business cycles. They found that bank term structure, public term structure and spread based on call rate had been successful in predicting activities. The bank public spread were giving false signal in some periods.