Analysis ofthe Center for Epidemiologie Studies Depression
Scale (CES-D) in Children and Adolescents from the
Perspective ofthe Item Response Theory
ArkunTatar\ Sinan Mahir Kayiran^ Gaye Saltukoglu\ Emel Sebnem ZeybekOzkut^ Muge Emeksiz^
ÖZET:
CES-Depresyon Ölcegi'nin çocuk ve ergenlerde kullanimmin madde cevap kurami ile incelenmesi
Amaç Depresyon yayginhgi ve neden oldugu etkiler açisindan önemli bir hastahktir. Birinci basamak saglik hizmetinebajvuranlararasindaoldukçayaygindir. Çocuk ve ergenlerde de yaygin olarak gözlenen depresyonun tanilanmasinda öicekler önemli yer tutmaktadir. Bu baglamda çaliçmada, CES-Depresyon Ölcegi'nin (The Centre for Epidemiologie Studies Depression Scale) Türkce formunun çocuk ve ergenlerde kullaniminm mümkün olup olmadiginm incelenmesi ve psikometrik özellikierinin ortaya konulmasi amaçlanmiçtir. Yöntem: Çaliçma, 8-15 yajlari arasinda 583 ki^i ile yürütülmüjtür. Çalijmada maddelerin incelenmesinde klasik kuramin yam Sira modern test teorisinden de yararlanilmiçtir. Maddelerin madde ayirt ediciiikleri, madde güclükleri ve kullanilan iki parametreli modele uyum düzeyleri hesaplanmijtir. 4, 7 ve 11 numarali maddeler düjük ayirt ediciiikleri ve madde zoriuk düzeyleri ile dikkat çekmiçlerdir.
Bulgular: Olçegin tüm örneklemde 0,74 düzeyindeki elde edilen iç tutarlilik katsayismin farkli yaj gruplarinda da 0,60 ile 0,78 arasinda gerçekieçtigi görülmüjtür. ÖIcek, yaj düzeyi arttikça daha yüksek iç tutarlilik ve iki yarim test iç tutarlilik katsayisi ortaya koymujtur. ÖIcegin faktör yapisinin bu grupta, yetijkin örneklemden elde edilen yapiya yakin olsa da daha zayif olarak ortaya çiktigi belirlenmijtir. ÖIcegin kriter geçerliligi baglaminda birlikte kullanildigi farkli beç depresyon testi ile de 0,52 ile 0,74 arasinda baginti gösterdigi gözlenmijtir.
Sonuçlar: CES-Depresyon Ölcegi'nin bu çalijmada elde edilen sonuçlari, kullanildigi yaj grubunda, yetijkin örneklemden elde edilen sonuçlara oldukça benzer ortaya çikmijtir. Grubun özelliklerinden dolayi bazi maddeler sorunlu olmasina ragmen öIcegin bütünü söz konusu oldugunda çocuk ve ergenlerde kullaniminda temel bir sorun gözlenmemijtir. Diger bir ifadeyle öIcegin Türkce formunun bu yaj grubunda kullanilabilecegi yönünde bulgular elde edilmijtir.
Anahtar sözcükler: depresyon, CES-Depresyon öicegi, çocuk, ergen, madde-tepki kurami
Klinik Psikofarmakoioji Bulteni 2013;23(3):242-53
ABSTRACT:
Analysis of the Center for Epidemiologie Studies Depression Scale (CES-D) in children and adolescents from the perspective ofthe item response theory
Objectives: Because of its prevalence and the consequences of its impact, depression is a significant health issue. It is strikingly widespread among patients referred to primary health care services. Inventories occupy an important place in the diagnosis of depression, a condition frequently seen among children and adolescents. In this context, the present study has aimed to examine whether the Turkish version of the CES-Depression Scale (The Centre for Epidemiologie Studies Depression Scale) can be used for children and adolescents.
Methods: The study was conducted with 583 children and adolescents between the ages 8-15. Both classical and modern test theories were employed in the analysis of the items in the study. Item discrimination, item difficulty and the level of fit with the two-parameter model were used. Items 4,7 and 11 attracted attention with their low discrimination characteristics and low difficulty levels.
Results: It was found that the internal consistency coefficient for the whole scale was 0.74 but ranged between 0.60 - 0.78 in different age groups. It was also observed that as age increased, the scale displayed higher internal consistency and split-half coefficients. It was determined that the factor structure ofthe scale in this group was close to, but weaker than, the factor structure in the adult scale. The criterion validity of the scale in regard to the other scales used together showed correlation coefficients between 0.52 and 0.74. Conclusion: It was seen that the results of the analysis of the CES-Depression Scale in this age group were similar to those derived from adult samples. Although certain problems appeared in some of the items due to the characteristics of this age group, the scale as a whole did not display a major problem that would prevent its use in children and adolescents. In other words, our findings have shown that the scale can be used in this age group.
Keywords: depression, CES-depression scale, children, adolescents, item response theory
Bulletin of Clinical Psychopharmacology 2013;23(3):242-53
'Asist. Prof. Dr., Fatih Sultan Mehmet Vakif University, Psychology Department. Istanbul - Turkey ^M.D., American Hospital, Istanbul -Turkey
'Psychologist, Private Practice
Address reprint requests to: Arkun Tatar, PhD, Haliç Yerlejkesi Sutilice Mahailesi, Karaagaç Cad. No: 12, Beyoglu, istanbul - Türkiye
E-mail address: arkuntatarisyahoo.com
Date of submission: October 15,2012
Date of accepta nee: March 24, 2013
Declaration of interest:
A.T., S.M.K., G.S., E.S.Z.O., M.E.: The authors reported no conflict of interest related to this article.
INTRODUCTION
Depressive problems in children and adolescents
occur along with significant psychosocial disorders.
Communication with family, school and society
deteriorates, and may lead to consequences such as
suicide and substance abuse (1). Depression is a
health problem that has become increasingly
prevalent all over the world and has formed a
material and moral burden for society (2). In recent
years, the idea that depression is a problem
associated only with adults has disappeared;
instead, children and adolescents are often
diagnosed with depression (3). In order to diagnose
depression in children and adolescents, scales for
assessment have become useful tools (4). The
prevalence of major depression, a chronic problem
in adolescents has been reported to be around 3.5%
between the ages of 13-17 (3). The prevalence of
depression in school-age children has been
indicated to be 1.9% in children and 4.7% in
adolescents in epidemiological studies conducted
in the U.S. (5). It has been observed that the boy and
girl ratios are similar before puberty; however, a
gender difference occurs by early adolescence,
where girls outnumber boys. Some of the studies
have also reported that female adolescents had
more numerous and severe symptoms than male
adolescents (6).
Depression being a prevalent and general disease
(27), the diagnosis of it is crucial. It has been reported
that there are many scales to measure depression in
Turkish (28). However, the number of studies about
children and adolescents and the scales developed
for them are relatively few. The advantages of the
Center for Epidemiologie Studies Depression Scale
(CES-D Scale) are its free use (no need to pay
copyright), having been translated into many
languages, its widespread usage and its allowance for
cross-cultural studies. The scale's having been
developed for screening purposes, differentiates it
from the other scales used in the Turkish language (9).
The CES-D (7) has been developed by the
American National Mental Health Institute in
Common Diseases Center (8) and adapted into
Turkish by Tatar and Saltukoglu (9). It is suggested
not to be used as a diagnostic tool individually (10).
However, the scale is widely used for the assessment
of depressive symptoms in general population. It is
a short self-report assessment scale that has been
developed for screening purposes, is commonly
used in scientific studies (11,12), and is described as
a sensitive instrument in measuring depressive
symptoms (13).
While developing the CES-D scale, valid items of
the depression scales in use at that time were used.
The basic depressive symptoms of the scale were
provided from clinical literature and factor analytic
studies (7). Items of the scale include assessments
of the past week, and ratings vary between 0 (rarely
or none of the time) and 3 (most or all of the time)
on a four point Likert-type answer options. The
scale consists of 20 items, of which four are scored
in reverse order (14). There are many various short
forms of the scale (15-19). The score range of the
long form ranges between 0 and 60, and high scores
indicate depression (20). Although, different cut-off
scores are reported in different languages and in
different cultures (10), the cut-off point is 16
according to American norms and a score above
this point is considered as a sign of clinical
depression (11) One of the inadequacies of the
Turkish adaptation study of the scale is that the
cut-off pointhas not been determined; the determination
of this cut-off point needs a separate clinical study
on its own (9). Studies conducted using the scale are
rare due to its recent adaptation into Turkish.
Although it has been reported that the adult form
of the scale can be used in children (21,22), in
adolescents (21-25), and in teenagers (11,21), there
is also a separate form that has been developed for
children (26). Consequently, the purpose of this
study is to test whether the Turkish form of the
CES-Depression Scale can be used effectively in children
and adolescents.
MATERIAL AND METHOD
Participants
Participant of the study were 583 children 286
girls (49.1%) and 297 boys (50.9%)) between the
ages of 8 and 15 (average=12.16±1.85 years) in the
2nd iQ 3th classes of elementary school. Eighty-five
children, out of the total of 538, participated in the
test-retest study. This group consisted of 49 girls
(57.6%) and 36 boys (42.4%), between the ages of 8
and 15 (average= 12.31±2.45 years) in the 2nd to 8th
classes of elementary school.
Tools to Collect Data
The following scales have been used along with
the CES-D Scale.
Beck Depression Inventory: The Beck
Depression Inventory (BDI) has been used for the
criterion validity study along with the CES-D Scale
in this study. The inventory developed by Beck et al.
in 1961 (27) has been adapted into Turkish by two
independent studies (28). The form adapted by Hisli
(29,30) has been used in this study. The scale consists
of 21 items, scored between 0 and 3.
Zung Self-Rating Depression Scale: The Zung
Self-Rating Depression Scale (SDS) developed by
Zung in 1965 (31) has been adapted into Turkish by
Ceyhun and Akça in 1966 (32). The scale consists of
20 items, scored between 1 and 4.
Hospital Anxiety and Depression Scale: The
Hospital Anxiety and Depression Scale (HADS)
developed by Zigmond and Snaith in 1983 (33) has
been adapted into Turkish by Aydemir in 1997 (34).
The scale consists of 14 items, scored between 0 and 3.
Automatic Thoughts Questionnaire: The
Automatic Thoughts Questionnaire (ATQ)
developed by Hollon and Kendal in 1980 (35) has
been adapted into Turkish by Aydm and Aydm in
1990 (36). The questionnaire consists of 30 items,
scored between 1 and 5.
Children's Depression Inventory (CDI): The
scale developed by Kovacs in 1981 has been adapted
into Turkish by Oy in 1991. The scale consists of 27
items, 13 of them scored in reverse order and
between 0 and 2 (37).
Procedure
Tests were applied to randomly selected
students in their guidance hours in school. All the
applications were done under the supervision of
psychologists and expert psychologists. Students
participated in the study voluntarily and if they
wanted they could leave before completing the
task. All the students in the study also took a
questionnaire consisting of eleven items about
their socio-demographic characteristics along with
the CES-D Scale.
265 of the participating students filled out one
of the depression scales, described under the
heading "Tools to Collect Data" along with the
CES-D Scale and the questionnaire to conduct the
validity study. However, which depression scale
each student would fill out was determined
completely at random. During data collection,
along with the CES-D Scale, 50 copies of each
scale. Beck Depression Inventory, Zung
Self-Rating Depression Scale, Hospital Anxiety and
Depression Scale and Automatic Thought
Questionnaire, and 100 copies of the Children's
Depression Inventory, were distributed to
participants. Out of the forms that were returned,
47 Beck Depression Inventory, 45 Zung Self-Rating
Depression Scale, 39 Hospital Anxiety and
Depression Scale, 43 Automatic Thought
Questionnaire and 91 Children's Depression
Inventory were answered validly. The CES-D Scale
was distributed to a hundred randomly selected
participants 15 days after the first application for
the test-retest study and was completed by 85
students. The students, who took the second test
for the criterion validity study and the CES-D Scale
for a second time after some time had passed,
were selected completely at random.
Findings
The findings obtained in this study have been
classified according to their content and are
presented below. Firstly refiability findings and
secondly validity findings of the CES-D Scale are
indicated.
Reliability Results
Internal Consistency
In this study, item analysis according to classical
test theory and the Cronhach Alpha Internal
Consistency Coefficient of the CES-D Scale have
heen computed. Age heing an important variahle,
the reliahility of the scale has heen calculated hy
split-half reliahility and item analysis for each of the
six age groups of the participants separately and the
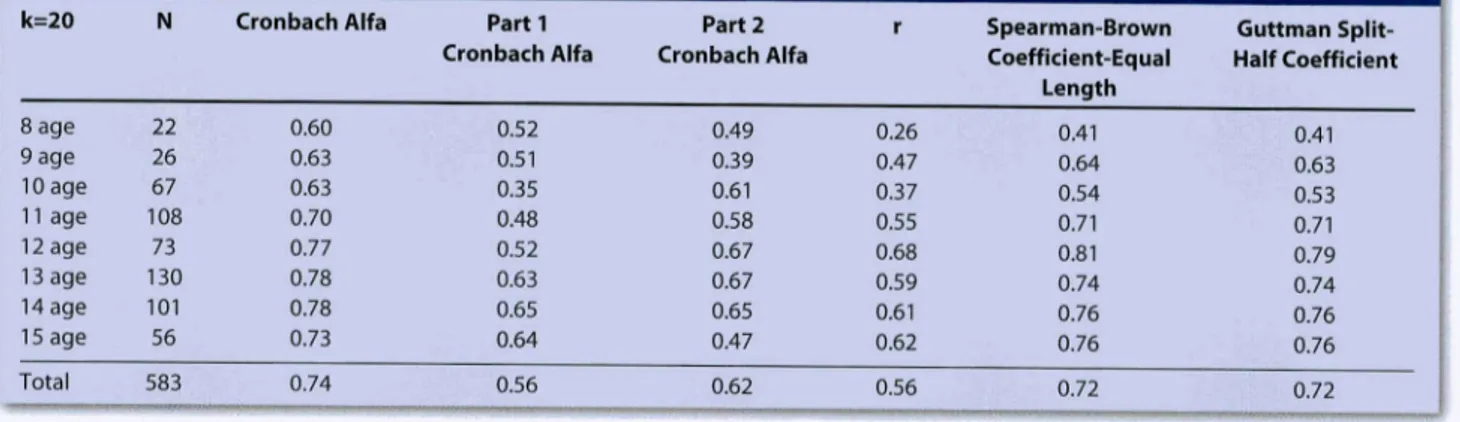
findings are presented in Tahle 1 and 2. The internal
consistency coefficient for the whole group was
found to be 0.74.
Split Half Reliability
The split half reliahility of the scale for the first
half is 0.56, for the second half is 0.62, While the
Gutman and Spearman-Brown coefficients for the
equal two halves was 0.72, the correlation coefficient
between the two halves is 0.56. Split-half reliahility
analyzes were conducted separately for each of the
eight age groups and are presented in Tahle 2.
Test-Retest Reliability
Pearson Correlation Analysis was conducted for
hoth total scores and for the items of the scale on 85
Table 1 : Item Analysis of the CES-D Scale for All Participants
Items item 1 Item 2 Item 3 Item 4 Item 5 Item 6 Item 7 Item 8 Item 9 Item 10 Item 11 Item 12 Item 13 Item 14 Item 15 Item 16 Item 17 Item 18 Item 19 Item 20 n=583, k=20 a=0.74 Mean 18.03 18.07 18.31 17.39 17.95 18.16 17.09 17.68 18.20 18.07 16.57 17.78 17.76 18.04 18.06 17.67 18.17 17.97 18.02 18.02 Variance 60.953 63.463 61.401 63.030 60.656 59.062 66.811 63.649 59.924 59.863 74.609 59.863 61.954 58.199 60.439 60.271 60.125 57.765 59.556 59.582
Table 2: Reliability and Split-Half Reliability Analysis Results for Age Groups
k=20 8 age 9 age 10 age 11 age 12 age 13 age 14 age 15 age Total N 22 26 67 108 73 130 101 56 583
Klinik Psikofarmakoloji Bülten
Cronbach Alfa 0.60 0.63 0.63 0.70 0.77 0.78 0.78 0.73 0.74 Parti Part 2 Cronbach Alfa Cronbach Alfa
0.52 0.51 0.35 0.48 0.52 0.63 0.65 0.64 0.56 0.49 0.39 0.61 0.58 0.67 0.67 0.65 0.47 0.62
Cilt: 23, Sayi: 3, 2013 / Bulletin of Clinicai Psychopharmacoiogy, Vol: 23, N.:
3,2013-r 0.377 0.208 0.404 0.144 0.368 0.516 -0.042 0.138 0.493 0.442 -0.485 0.358 0.254 0.534 0.396 0.327 0.431 0.585 0.445 0.467
Alpha if Item Deleted
r Spearman-Brown Coefficient-Equal 0.26 0.47 0.37 0.55 0.68 0.59 0.61 0.62 0.56 Length 0.41 0.64 0.54 0.71 0.81 0.74 0.76 0.76 0.72 www.psikofarmakoloji.org 0.724 0.736 0.723 0.745 0.724 0.713 0.759 0.744 0.716 0.719 0.786 0.725 0.734 0.711 0.722 0.728 0.720 0.707 0.718 0.717
1
Guttman Split-Half Coefficient 0.41 0.63 0.53 0.71 0.79 0.74 0.76 0.76 0.72 245subjects who participated in two test applications
separated by a two week interval. The correlation
coefficient of the total scores between the two
applications was r=0.55; p=0.001. On the other
hand, the calculations for each item yielded the
highest correlation coefficient for item 10 (r=0.57),
and the lowest correlation coefficient for item 15
(r=0.07).
Investigation of Items by Item Response Theory
The items of the CES-D Scale were examined
according to classic test theory on the topics above.
Item Response Theory (IRT) is used for the purpose
of providing more information than classical test
theory provides because it is relatively weaker than
IRT in examining the items and the scale (38). IRT is
also referred to as "Modern Test Theory", to
distinguish it from classical test theory (39).
In this study, to examine the items ofthe CES-D
Scale, a Two Parameters Logistic Model {2PLM) was
used for the purpose of estimating item- and
person-parameters and the PARSCALE computer statistical
program, version 4.1 was used (44) to determine the
compliance of items to the model and to determine
item-measured characteristic level for the reasons
stated in relevant studies (9,40-43).
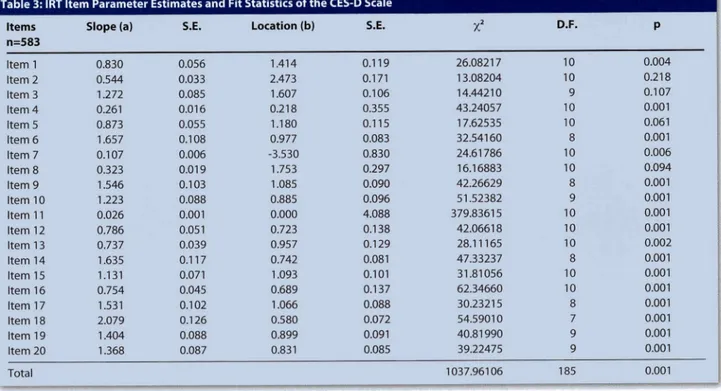
According to the results, items 4 and 7 were
found to have weak item-scale correlation
coefficients in the item analysis (Table 1). Item 11
did not have a direction problem although it seemed
to be in reverse order and had item discrimination
at the lowest level as shovm by the letter "a". As the
CES-D Scale is intended to measure the level of
depression, the discrimination parameter shows
how well it discriminates between high and low
depression levels of individuals (39). Items 11, 7, 4,
and 8 were the lowest discriminative items and
items 18,6,14 and 9 were the highest discriminative
items, respectively.
Item difficulty that is shown by the letter "b", is a
technical specification obtained from the IRT. While
an item described as having high "b", i.e. a difficult
item, indicates test subjects with high levels of
depression, an item with low "b" indicates subjects
with low levels of depression. For this reason, item
difficulty is a situation index for the depression level
(45). In other words, the "b" parameter shows the
location of the item on the depression level. Taking
this parameter into account, while items 7, 11, and
Table 3: IRT Item Parameter Estimates and Fit Statistics o f t h e CES-D Scale
Items n=583
Slope (a) S.E. Location (b) S.E. D.F.
Item 1 Item 2 Itenn3 Item 4 Item 5 Item 6 Item 7 Item 8 Item 9 Item 10 Item 11 Item 12 Item 13 Item 14 Item 15 Item 15 Item 17 Item 18 Item 19 Item 20 Total 0.830 0.544 1.272 0.261 0.873 1.657 0.107 0.323 1.546 1.223 0.026 0.786 0.737 1.635 1.131 0.754 1.531 2.079 1.404 1.368 0.056 0.033 0.085 0.016 0.055 0.108 0.006 0.019 0.103 0.088 0.001 0.051 0.039 0.117 0.071 0.045 0.102 0.126 0.088 0.087 1.414 2.473 1.607 0.218 1.180 0.977 -3.530 1.753 1.085 0.885 0.000 0.723 0.957 0.742 1.093 0.689 1.066 0.580 0.899 0.831 0.119 0.171 0.106 0.355 0.115 0.083 0.830 0.297 0.090 0.096 4.088 0.138 0.129 0.081 0.101 0.137 0.088 0.072 0.091 0.085 26.08217 13.08204 14.44210 43.24057 17.62535 32.54160 24.61786 16.16883 42.26629 51.52382 379.83615 42.06618 28.11165 47.33237 31.81056 62.34660 30.23215 54.59010 40.81990 39.22475 1037.96106 10 10 9 ID 10 8 10 10 8 9 10 10 10 8 10 10 8 7 9 9 185 0.004 0.218 0.107 0.001 0.061 0.001 0.006 0.094 0.001 0.001 0.001 0.001 0.002 0.001 0.001 0.001 0.001 0.001 0.001 0.001 0.001
4 function relatively at lower levels on the measured
characteristics, items 2, 8, and 3 are the first three
items that function relatively at higher levels. Items
2, 3, 5, and 8 are identified as showing model fit.
Validity Findings
Construct Validity
Construct validity of the scale was examined by
the use of explanatory and conflrmatory factor
analysis and is presented below under the same
titles.
Explanatory Factor Analysis (EFA)
There is not a recommended factor structure of
the scale by the investigators (9); although it is
frequently evaluated as one dimensional, it is also
evaluated as three or four dimensional (50,73), but,
in many studies the four factor structure of the scale
has been preferred (8,54,74-76). In our study the
four factor structure of the scale was preferred and
examined.
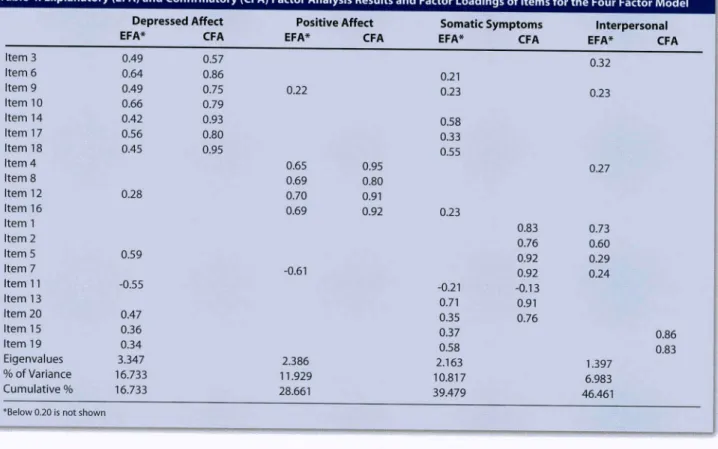
The construct validity of the scale was first tested
by Explanatory Factor Analysis (EFA). Principle
Components Analysis, "Varimax" Rotation was
applied to the data of all participants. The scale was
examined by EFA as four dimensional and it was
found that the "Positive Affect" dimension was fully
compliant with the adult sample. Even though
some of the items in the "Depressed Affect"
dimension were close to or loaded just below the
loads of other dimensions, they were still distinctive.
On the other hand, the "Somatic Symptoms" and
"Interpersonal" dimensions were not as expected.
Although some of the items of "Somatic Symptoms"
seemed as if they stood together, others seemed to
be scattered within other dimensions. Since the
"Interpersonal" dimension consisted of only two
items, it seemed very weak, and has taken items
from other dimensions. The four factor structure of
the scale explained 46.46% of the total variance (see
Table 4).
Confirmatory Factor Analysis (CFA)
Construct validity of the scale was calculated by
Table 4: Explanatory (EFA) and Confirmatory (CFA) Factor Analysis Results and Factor Loadings of Items for the Four Factor Model '
Item 3 Item 6 Item 9 Item 10 Item 14 Item 17 Item 18 Item 4 Item 8 Item 12 Item 16 Itemi Item 2 Item 5 Item 7 Item 11 Item 13 Item 20 Item 15 Item 19 Eigenvalues % of Variance Cumulative % Depressed Affect EFA* 0.49 0.64 0.49 0.66 0.42 0.56 0.45 0.28 0.59 -0.55 0.47 0.36 0.34 3.347 16.733 16.733
*Below 0.20 is not shown
CFA 0.57 0.86 0.75 0.79 0.93 0.80 0.95 Positive Affect EFA* CFA 0.22 0.65 0.95 0.69 0.80 0.70 0.91 0.69 0.92 -0.61 2.386 11.929 28.661 Somatic Symptoms EFA* 0.21 0.23 0.58 0.33 0.55 0.23 -0.21 0.71 0.35 0.37 0.58 2.163 10.817 39.479 CFA 0.83 0.76 0.92 0.92 -0.13 0.91 0.76 Interpersonal EFA* 0.32 0.23 0.27 0.73 0.60 0.29 0.24 1.397 6.983 46.461 CFA 0.86 0.83
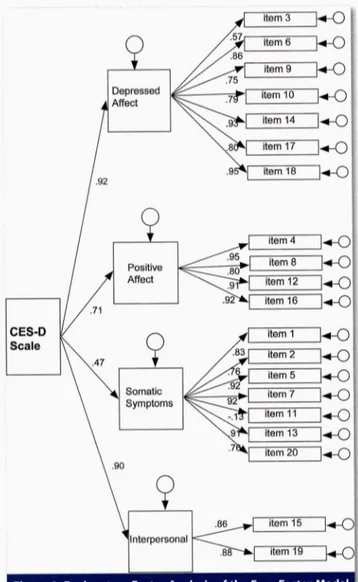
AMOS 16.0 and Confirmatory Eactor Analysis (CFA)
was applied to all participants' data by using a four
factor hierarchical model. The dimensions or the
factors of the scale as indicated in literature (9) have
been considered to be unrelated. One of the widely
used fit statistics. Goodness of Fit Index (GEI), was
used to test the four factor structure of the scale and
was 0.79, while Adjusted Goodness of Fit Index
Figure 1: Explanatory Factor Analysis of the Four Factor Model for CES-D
(AGFI) was 0.76, The Parsimony Ratio (PRATIO) was
0.92, Root Mean Square Error of Approximation
(RMSEA) was 0.11 and Root Mean Square Residual
(RMR) was 0.11 (x' (276) = 2223.37; p=0.001). The
factor loadings for each of the items calculated by
CEA are presented in Table 4 in order to compare
with the results of EFA. In addition, the fit schema of
the scale to the four factor structure is presented in
Figure 1.
Criterion Validity
In order to determine validity coefficients of the
CES-D Scale, the scale was applied to participants in
combination with the Beck Depression Inventory,
Zung Self-Rating Depression Scale, Hospital Anxiety
and Depression Scale, Automatic Thoughts
Questionnaire and Children's Depression Inventory.
Pearson Correlation Coefficients between the
CES-D Scale and the other five scales were between
0.52 and 0.74 (see Table 5).
Comparisons of the Participating Sub-Groups
In this part of the study, the differences between
the total scores of the CES-D Scale and various
demographic variables such as gender, age and
income were examined. Results showed that there
were no statistically significant differences
between average depression scores of boys and
girls (t (581)= 0.556; p=0.577), and between age
groups (F(7,575)= 1.939; p=0.061). However, there
were statistically significant differences between
average depression scores and different income
groups (F(2,574)= 6.473; p=0.002). Those who
defined themselves as low income-status had
higher average scores than those who defined
themselves as middle or high.
Table 5: Correlation Coefficients between Total Scores of CES-D Scale and Total Scores of Other Depression Scales
Beck Depression Inventory r 0.63**« n 47 ***p<0.001 Zung Self-Rating Depression Scale 0.65**» 45 Hospital Anxiety and Depression Scale
067».» 39 Automatic Thoughts Questionnaire 0.74*** 43 Children's Depression Inventory 0.52*** 91
DISCUSSION
This study which was about whether the CES-D
Scale could be used for cbildren and adolescents
has yielded similar results to previous literature,
concerning the reliahility and the validity of the
scale. The scale's internal consistency coefficient
was found to be 0.74 for the whole group, and it was
hetween 0.60 and 0.78 for different age groups in
this study. The internal consistency coefficient
increased with increasing age or decreased with
decreasing age showing that the scale was affected
significantly by age. This situation shows that the
scale loses its effectiveness in younger age groups
such as 8. However, there are various studies that
report low internal consistency for the scale (46).
Therefore, it can be claimed that different age group
applications yield different internal consistency
results.
In the first published study of the scale (7), the
test-retest reliability coefficient with a two week
interval was reported to he 0.51. Some suhsequent
studies stated that the same coefficient was hetween
0.51 and 0.67 (47,48). As for our study, the test-retest
reliability coefficient with a two week interval was
found to he 0.55. The values found in this study
show that the test-retest reliability coefficient is
similar to other studies. According to the results of
the comparison of the items one hy one in the
test-retest application, the lowest correlation (0.45) was
on item 1, and the highest correlation (0.95) was on
item 4 in one of the studies (49). As to our study, the
lowest correlation was found on item 15, and the
highest correlation was found on item 10 in the
test-retest application with a two week interval. Item 10
("I felt scared") was the item that showed the highest
correlation in the test-retest application with a two
week interval in the Turkish adaptation study of the
scale (9). It seems as if examination of the items and
their content due to changes in the time interval
between applications of the scale to different groups
might reveal interesting information ahout
depression. However, this subject appears as a
detail for this study.
In a study where items of the CES-D Scale were
examined hy Item Response Theory (IRT), items 4,
7,8,13,15, and 19were reported aslowdiscriminative
items. Items 4, 10, 16, 17, and 20 were the weakest
items in model fit (20). Also in this study items 4, 7,
and 8 were the lowest discriminative ones. However,
item 11 was even less discriminative than others in
this study. Model fit in this study seems to be an
issue that should be especially considered. In IRT,
besides item difficulty and discrimination there is a
third parameter, i.e. the factor of "answering by
chance". However, for this study answering the
scale and the other measuring instruments
randomly was not a problem, so this parameter was
not used, i.e. a two parameter model was used
instead of a three parameter model. The items of the
scale in this study have no right or wrong answers
that could be answered by chance. However, the fit
of the items of the scale to the 2PLM was found low.
There is the possibility that the items of the scale
were not fully understood by some of tbe
participating children and adolescents, and that
they answered randomly. This kind of answering
tendency has decreased the model fit. However, a
three parameter model cannot be used due to the
type of questions of the scale; this is an inevitahle
consequence for the group studied. It can be stated
tbat the most convenient way to eliminate this
prohlem is to develop a scale that includes questions
this age group can fully understand instead of a
general scale. In this study, while items 2,3,5, and 8
had model fit, other items did not show model fit. It
seems that some of the participants have answered
items, other than those specified, randomly For this
reason, it might be mentioned tbat the point
specified above is the weakest point of this study
investigating the suitability of the scale for children
and adolescents.
The results of the EFAand CFAstudies conducted
for the items of CES-D Scale in this study are similar
to the results of the adult sample (9). The four
factor structure of the scale explained 46.46% of
the total variance. This ratio is 49.90% in the adult
sample (9). The four factor structure of the scale
measuring "Positive Affect" and "Depressive
Symptom" dimensions has emerged distinctively
in the EFA. As for "Somatic Symptoms" and
"Interpersonal" dimensions, they have emerged
less distinctively, taking and giving items of other
dimensions. It is to be mentioned that the scale has
not a distinct and widespread factor structure and
many research studies do not take these
suh-dimension into account; thus, the results of this
analysis are given just for the purpose of
comparison with some other literature findings.
The EFA is affected by the participating groups.
Many of the items grouped together in the
sub-dimensions are considered as a sign of the factor
structure of the scale (9). For this reason, the CFA is
often preferred instead of the EFA in the studies
using the CES-D Scale (8,16,50-57). These studies
have examined the four factor structure of the
scale using the CFA's hierarchical model and the
GFI has heen reported to change between
coefficients of 0.89 and 0.95. In this study the GFI
was found to be slightly lower (0.79) than other
studies. However, the adjusted GFI coefficient,
reported to be between 0.56 and 0.88 in other
studies, was found to be 0.76 in this study. The Root
Mean Square Error of Approximation (RMSEA)
coefficient was heen found to be 0.11. Even though
the results in this study are not very satisfactory,
they are quite similar to the results reported in the
literature and to the values ohtained from the
Turkish adult application of the scale. These similar
results may be accepted as a sign that the factor
structure is not very strong and that the factors
originate from the scale not from the sample.
The criterion validity coefficients that various
studies have reported between the CES-D Scale
and other scales are as follows: 0.58 for MMPI-II
Depression Scale (58), 0.82 for Hamilton
Depression Inventory (46), 0.73 for Zung
Self-Rating Depression Scale (59), 0.77 for Depression
Adjective Check List (60), and between 0.67 and
0.81 for Beck Depression Inventory (11,58,61,62).
As for this current study, the lowest correlation
coefficient was ohserved for the Children's
Depression Inventory (0.52), the correlation
coefficient for Beck Depression Inventory was
0.63, for Zung Self-Rating Depression Scale was
0.65, for Hospital Anxiety and Depression Scale
was 0.67, and the highest correlation coefficient
was 0.74 for Automatic Thoughts Questionnaire.
The results of this study are not significantly
different from the results of other studies in the
literature; on the contrary they are quite similar.
However, there is a point to he considered. All the
scales used in this study, except one, have been
developed for adults. Due to the lack of scale
especially developed for children in Turkish, adult
scales have heen used to assess criterion validity.
There were two ways to assess criterion validity of
this study; one was to use just one measuring
instrument and the other although not very
suitahle, to use several measuring instruments. For
the purpose of providing more information, adult
forms of the previously mentioned measuring
instruments have heen used as criteria in the study.
The results presented above should be assessed in
this context.
The comparison of groups in this study showed
no differences in gender and age in terms of CES-D
total scores. In previous studies, hesides the studies
that reported age and gender differences in
depression levels, there were others that did not
report any differences (6,63-66). However,
differences have been observed in economic status,
and average depression scores were found higher in
low income students than in students who described
themselves as in middle and high income groups.
Many studies have stated that those in lower income
groups are at risk, and show higher rates of
depressive symptoms or have higher depression
score averages (66-72). The result is just general
information, which is in accordance with the
information ahove.
The validity and reliability studies, when
considered as a whole, demonstrate that the Turkish
form of the scale is almost as effective in children as
in adults. Unlike similar measuring instrument, the
scale's being available for free use and its being
suitable for screening purposes can be considered
as an important advantage. However, the scale
needs to he tested in different groups by validity
studies. If we summarize the results of this study,
even though the CES-D Scale is not very effective for
the purpose of measuring depression in children
and adolescents, it can he used as an alternative
measuring instrument.
References:
1. Mein DN, Dougherty LR, Olino TM.Toward guidelines for evidence-based assessment of depression in children and adolescents. J Clin Child Adolesc Psychol 2005;34(3):412-32. 2. World Health Organization. The global burden of disease.
Geneva (CE): WHO Press. 1996.
3. Kovacs M. Next step for research on child and adolescent depression prevention. Am J Prev Med 2006;31(6 Suppl 1):S184-S5.
4. Weiler EB, Weiler RA. Mood disorders. In: Lewis M ed. Child and Adolescent Psychiatry, Williams and Wilkins, Baltimore, USA, 1991: 646-664.
5. Kashani JH, Carlson GA, Beck NC, Hoeper EW, Corcoran CM, McAllister JA, and et al. Depression, depressive symptoms and depressive mood among a community sample of adolescents. Am J Psychiatry 1987;144(7):931-4.
6. Takakura M, Sakihara S. Gender differences in the association between psychosocial factors and depressive symptoms in Japanese junior high school students. J Epidemiol 2000;10(6):383-91.
7. Radloff LS. The CES-D scale: A self-report depression scale for research in the general population. Appl Psych Meas 1977:1:385-401.
8. Sheehan TJ, Fifield J, Reisine S, Tennen H. The measurement structure of the Center for Epidemiologie Studies Depression Scale. J Pers Assess 1995;64(3):507-21.
9. Tatar A, Saltukoglu G. The adaptation of the CES-Depression scale into Turkish through the use of confirmatory factor analysis and item response theory and the examination of psychometric characteristic. Klinik Psikofarmakoioji Bulteni-Bulletin of Clinical Psychopharmacology 2010;20(3):213-27. (Turkish)
10. Gonçalves B, Fagulha T. The Portuguese Version of the Center for Epidemiologie Studies Depression Scale (CES-D). Eur J Psychol Assess 2004;20(4):339-48.
11. Orme JG, Reis J, Herz EJ. Factorial and discriminant validity of the Center for Epidemiological Studies Depression (CESD) Scale. J Clin Psychol 1986;42(l):28-33.
12. Santor DA, Zuroff DC, Ramsay JO, Cervantes P, Palacios J. Examining scale discriminability in the BDJ and CES-D as a function of depressive severity. Psychol Assessment 1995;7:131-9.
13. Hubley AM, Hemingway D, Michalos AC. A comparison of older informal caregivers and caregivers living in non-metropolitan areas. Soc Jndic Res 2003;61(3):241-58. 14. Carpenter JS, Andrykowski MA, Wilson J, Hall LA, Rayens
MK, Sachs B, Cunningham LL. Psychometrics for two short forms of the Center for Epidemiologie Studies-Depression Scale. Issues Ment Health Nurs 1998;19(5):481-94.
15. Andresen EM, Malmgren JA, Carter WB, Patrick DL. Screening for depression in well older adults: evaluation of a short form of the CES-D (Center for Epidemiologie Studies Depression Scale). Am J Prev Med 1994;10(2):77-84.
16. Cole JC, Rabin AS, Smith TL, Kaufman AS. Development and Validation of a Rasch-Derived CES-D Short Form. Psychol Assessment 2004;16(4):360-72.
17. Irwin M, Artin KH, Oxman MN. Screening for depression in the older adult: criterion validity of the 10-item Center for Epidemiological Studies Depression Scale (CES-D). Arch Intern Med 1999;159(15):1701-4.
18. Kohout FJ, Berkman LF, Evans DA, Cornoni-Huntley J. Two shorter forms of the CES-D depression symptoms index. J Aging Health 1993;5(2):179-93.
19. Santor DA, Coyne JC. Shortening the CES-D to improve its ability to detect cases of depression. Psychol Assessment 1997;9(3):233-43.
20. Edelen MO, Reeve BB. Applying item response theory (IRT) modeling to questionnaire development, evaluation, and refinement. Qual Life Res 2007;16(Suppl 1):5-18.
21. Fendrich M, Weissman MM, Warner V. Screening for depressive disorder in children and adolescents: validating the Center for Epidemiologie Studies Depression Scale for Children. Am J Epidemiol 1990;131(3):538-551.
22. Mathet F, Martin-Guehl C, Maurice-Tison S, Bouvard MP. Prevalence of depressive disorders in children and adolescents attending primary care. A survey with the Aquitaine Sentinelle Network. Encéphale 2003;29(5):391-400.
23. Fichman L, Koestner R, Zuroff DC. Depressive Styles in Adolescence: Assessment, Relation to Social Functioning, and Developmental Trends. J Youth Adolescence 1994;23(3):315-30.
24. Garrison CZ, Addy CL, Jackson KLAB, McKeown RE, Waller JLBS. The CES-D as a screen for depression and other psychiatric disorders in adolescents. J Am Acad Child Psy 1991;30(4):636-41.
25. Roberts RE, Andrews JA, Lewinsohn PM, Hops H. Assessment of depression in adolescents using the Center for Epidemiologie Studies Depression Scale. Psychological Assessment: J Consult Clin Psych 1990;2(2):122-8.
26. Faulstich ME, Carey MP, Ruggiero L, Enyart P, Gresham F. Assessment of depression in childhood and adolescence: An evaluation of the Center for Epidemiologies Studies Depression Scale for Children (CES-DC). Am J Psychiat 1986; 143:1024-7.
27. Wehner JS, Stoner SC. Tools and Techniques for Evaluating. J Pharm Pract 2001;14(6):448-52.
28. Ceyhun B. Psychological Assessments of Depression, Duygu Durum Dizisi 2001;4:192-7. (Turkish)
29. Hisli N. A study of the vaUdity of the Beck Depression Inventory. Turk Psikol Derg 1988;6(22):118-26. (Turkish) 30. Hisli N. The validity, reliability of the Beck Depression
Inventoryfor college students. TurkPsikol Derg 1989;7(23):3-13. (Turkish)
31. Thurber S, Snow M, Honts CR. The Zung Self-Rating Depression Scale: Convergent Validity and Diagnostic Discrimination. Assessment 2002;9(4):401-5.
32. Ceyhun B, Akca, F. Zung Depression Scale validity and a study on the reliahility. VIII. National Psychology Congress Scientific Studies, Turkish Psychological Association Publications, Izmir, 1996. (Turkish)
33. Zigmond AS, Snaith RP. The Hospital Anxiety and Depression Scale. Acta Psychiatrica Scandinavica 1983;67(6);361-70. 34. Aydemir O. The hospital anxiety and depression scale
Turkish validity and reliahility study. Turk Psikiyatri Derg 1997;8(4):280-7. (Turkish)
35. Clarke D, Coosen T. The mediating effects of coping strategies in the relationship between automatic negative thoughts and depression in a clinical sample of diabetes patients. Pers Indiv Differ 2009;46:460-4.
36. Aydin G, Aydin O. Automatic thoughts questionnaire validity and reliability. Turk Psikol Derg 1990;7(24):51-5.
37. Oner N. Examples of Psychological Tests Used in Turkey: A Reference Source (Expanded 2'"' Edition). Bogazici University Press, Istanbul 2008: 468-71. (Turkish)
38. MacDonald P, Paunonen SV. A Monte Carlo comparison of item and person statistics based on item response theory versus classical test theory. Educ Psychol Meas 2002;62(6):921-43.
39. Hambleton RK, Robin F, Xing D. Item response models for the analysis of educational and psychological test data. In. HEA Tinsley ve SD Brown (Ed.), Handbook of Applied Multivariate Statistics and Mathematical Modeling. San Diego: Academic Press 2000: 553-81.
40. Collins w e , Raju NS, Edwards IE. Assessing differential functioning in a satisfaction scale. J Appl Psychol 2000;85(3):451-62.
41. Raju NS, Laffitte LJ, Byrne BM. Measurement equivalance: a comparison of methods based on confirmatory factor analysis and item response theory. I Appl Psychol 2002;87(3):517-29.
42. Reise SP, Waller NG. How many IRT parameters does it take to model psychopathology items? Psychol Methods 2003;8(2):164-84.
43. Somer O. Scale comparisons between groups investigation of equivalence: Item and test functions differentiation. Turk Psikol Derg 2004;19(53):69-82. (Turkish)
44. Du Toit M (Ed.). IRT from SSI: BILOG-MG, MULTILOG, PARSCALE, TESTFACT. Lincolnwood (IL): Scientific Software International 2003.
45. Rouse SV, Finger MS, Butcher JN. Advances in clinical personality measurement: An item response theory analysis of the MMPI-2 PSY-5 Scales. J Pers Assess 1999:72:282-307. 46. Dozois DJA. The Psychometric Characteristics of the
Hamilton Depression. J Pers Assess 2003;80(1):31-40.
47. Hann D, Winter K, lacobsen P. Measurement of depressive symptoms in cancer patients: Evaluation of the Center for Epidemiological Studies Depression scale (CES-D). J Psychosom Res 1999;46(5):437-43.
48. Cook IM, Elhai ID, Areán PA. Psychometric properties of the PTSD Checklist with older primary care patients. J Trauma Stress 2005;18(3):371-6.
49. Fountoulakis K, Iacovides A, Kleanthous S, et al. Reliability, validity, and psychometric properties of the Greek translation of the Center for Epidemiological Studies-Depression (CES-D) Scale. BMC Psychiatry 2001;l(3):l-20.
50. Perreira KM, Deeb-Sossa N, Haris KM, Bollen K. What Are We Measuring? An Evaluation of the CES-D Across Race/Ethnicity and Immigrant Generation. Soc Forces 2005;83(4):1567-602.
51. Jennifer AB, McCreary DR, Wright KD, Asmundson GIG. Factorial validity of the center for epidemiologic studies-depression (CES-D) scale in military peacekeepers. Depress Anxiety 2003;17(l):19-25.
52. Knight RG, Williams S, McGee R, Olaman S. Psychometric properties of the centre for epidemiologic studies depression scale (CES-D) in a sample of women in middle life. Behav Res Ther 1997;35(4):373-80.
53. Crockett LI, Randall BA, Shen Y, Russell ST, DriscoU AK. Measurement equivalence of the Center for EpidemiologicaJ Studies Depression scale for Latino and Anglo adolescents: A national study. J Consult Clin Psych 2005;73(l):47-58. 54. Wong YI. Measurement Properties of the Center for
Epidemiologic Studies-Depression Scale in a Homeless Poptüation. Psychol Assessment 2000; 12(2):69-76.
55. Thomas IL, BrantJey PJ. Factor Structure of the Center for Epidemiologic Studies Depression Scale in Low-Income Women Attending Primary Care Clinics. Eur J PsychoJ Assess 2004;20(2):106-15.
56. Helmes E, Nielson WR. An examination of the internal structure of the Center for Epidemiologicai Studies Depression scale in two medical samples. Pers Indiv Differ 1998:25:735-43.
57. Hertzog C, TUstine JV, Usala PD, Hultsch DF, Dixon R. Measurement Properties of the Center for Epidemiologicai Studies Depression Scale (CES-D) in Older Populations. Psychological Assessment: J Consult Clin Psych 1990;2(l):64-72.
58. Bush BA, Novack TA, Schneider JJ, Madan A. Depression Following Traumatic Brain Injury: The Validity of the CES-D as a Brief Screening Device. J Clin Psychoi Med S 2004;ll(3):195-201.
59. Yasuda T, Lubin B, Kim J, Wliitlock RV. The Japanese version of the Multiple Affect Adjective Check List-Revised: Development and Validation. J Clin Psychol 2003;59(l):93-109.
60. Lubin B, Roth AV, Dean LM, Hornstra RK. Correlates of depressive mood among normals. J Clin Psychol 1978;34(3):650-3.
61. Bonilla J, Bernal G, Santos A, Santos D. A Revised Spanish Version of the Beck Depression Inventory: Psychometric Properties with a Puerto Rican Sample of College Students. J Clin Psychol 2004;60(l):l 19-30.
62. Spielberger CD, Ritterband LM, Reheiser EC, Brunner TM. The nature and measurement of depression. IJCHP 2003;3(2):209-34.
63. Cuijpers P, Smit F. Excess mortality in depression: A meta-analysis of community studies. J Affect Disorders 2002;72(3):227-36.
64. Van't Veer-Tazelaar PJ, van Marwijk HWJ, Jansen APD, et al. Depression in old age (75+), the PIKO study. J Affect Disorders 2008;106(3):295-9.
65. Manson SM, Ackerson LM, Dick RW, Baron AE, Fleming CM. Depressive symptoms among American Indian adolescents: Psychometric characteristics of the Center for Epidemiologie Studies Depression Scales (CES-D). Psychol Assessment: J Consult Clin Psych 1990;2(3):231-7.
66. van der Wurff FB, Beekman ATF, Dijkshoorn H, Spijker JA, Smits CHM, Stek ML, Verhoeff A. Prevalence and risk-factors for depression in elderly Turkish and Moroccan migrants in the Netherlands. J Affect Disorders 2004;83(l):33-41. 67. Uckardes Y, Ozmert EN, Unal E, Yurdakok K. Children of low
socioeconomic level primary effect of zinc supplementation Hacettepe Psychological Adjustment Scale scores. Çocuk Saghgi ve Hastaliklari Dergisi 2009;52:53-9. (Turkish) 68. Maral I, Asian S, IUian MN, Yildirim A, Candansayar S, Bumin
MA. Prevalence and risk factors of depression: a comparative study of elderly people living in nursing homes and at home. Turk Psikiyatri Derg 2001;12(4):251-9. (Turkish)
69. Ozmen D, Dundar PE, Cetinkaya AC, Taskin O, Ozmen E. Factors affecting the level of despair and hopelessness among high school students. Anadolu Psikiyatri Derg 2008;9:8-15. (Turkish)
70. Levecque K, Lodewyckx I, Vranken J. Depression and generalised anxiety in the general population in Belgium: A comparison between native and immigrant groups. J Affect Disorders 2007;97(l-3):229-39.
71. Barefoot JC, Brummett BH, Helms MJ, Mark DB, Siegler IC, Williams RB. Depressive symptoms and survival of patients with coronary artery disease. Psychosom Med 2000;62(6):790-5.
72. Magidson JF, Gorka SM, MacPherson L, et al. Examining the effect of the life Enhancement treatment for Substance Use (LETS ACT) on residential substance abuse treatment retention. Addictive Behaviors 2011;36(6):615-23.
73. Phillips GA, Shadish WR, Murray DM, Kuhik M, Lytle LA, Birnbaum AS. The Center for Epidemiologie Studies Depression Scale with a young adolescent population: A confirmatory factor analysis and implementation of a general hierarchical model. Multivar Behav Res 2006;41(2): 147-63.
74. Pettit JW, Levnnsohn PM, Seeley JR, Roherts RE, Hibhard JH, Hurtado AV. Association between the Center for Epidemiologie Studies Depression Scale (CES-D) and mortality in a community sample: An artifact of the somatic complaints factor? IJCHP 2008;8(2):383-97.
75. Santor DA. The Centre for Epidemiologie Studies Depression Scale. A. E. Kazdin (Chief Editor) American Psychology Association Encyclopedia of Psychology. American Psychology Association Press. 2000.
76. Dick RW, Beals J, Keane EM, Manson SM. Factorial structure of the CES-D among American Indian adolescents. J Adolescence 1994;17(l):73-9.