Journal of istanbul Kültür University
2006/4 pp.285-290
A STUDY ON SPECTRAL AND STATISTICAL ANALYSIS OF
NOISY SIGNALS FOR PHYSICAL PROCESSES
Tayfun KA YNAsi, Serhat SEKER2
Abstract:
In this study, it is considered a sinusoidal signal with its third harmonic as well as the fundamenta! frequency adding the noise term, which is produced using a Gaussian random number generator. Hence spectral and statistical properties of this signal are examined and Signal-to-Noise Ratio (SNR) is computed comparing with the probability density nmetion of the noisy signa1.
Keywords: Power Speetrum, Statistieal Parameters, Harmonies, Gaussian Noise.
i.
INTRODUCTIONin most physical processes, to define the system properties and its behavior, there are needs to various signal characteristics. For this purpose, different approaches are used in the framework of the signal analysis techniques. But, in this manner, the most popular one is the spectral analysis approach to extract the useful information in the frequency domain [1, 2]. Hence the signal content is represented with these frequency components as a resu1t of the spectral analysis. In addition to this approach, the other one is the statistical analysis approach. With this way, the statistical properties are represented by its parametric values. These parametric values specially mean value, standard deviation, skewness and kurtosis. The mean value and standard deviation measure the central tendeneyand deviation from the central value respectively. These are the fundamental parameters. The last two are, namely parameters of the skewness and kurtosis, are related to the measure of the symmetry and the
sharpness of the peak of the probability density function considered for the noise term
respectively. Hence the various complex signals, which are considered by the noise term and harmonies, used to simulate the physical system behavior are analyzed to extract the usefuI information. In this sense, this study reflects the various spectral and statisticaI aspects of these kinds of the complex signaIs as a powerful hybrid approach.
2. SPECTRAL DOMAIN ANAL YSIS
A common approach for extracting the information about the frequency features of a random signal is to transform the signal to the frequency domain by computing the discrete Fourier transform. For a block of data oflength N sampIes the transform at frequency mLlfis given by
N-I
X(m!'1f) = Lx(k!'1t)
exp[-
j2nkml
N](L) k=üwhere LIf is the frequency resolution and LIt is the data-sampling interval. The auto-power spectral density (APSD) ofx(t) is estimated as
lVoeational School of Business Istanbul Kültür University, 34191 Sirinevler 2Eleetrieal Engineering Department Istanbul Teehnical University, 34469 Maslak
The cross power spectral density (CPSD) between x(t) andy(t) is similady estimated. The statistical accuracy of the estimate in eq. (2) increases as the number of data points or the number ofblocks of data increases [3].
3. BASIC STATISTICAL PARAMETERS FOR DATA ANAL YSIS
Several statistical parameters, calculated in the time domain, are generally used to define average properties of macliinery data. The two basic parameters are the mean value,
il
and the standard deviation, cr. For a given data set {Xi} these are defined as follows:where Nis the number of the data points.
For the Gaussian (normal) probability distribution, two parameters that reflect the departure
from the normal distribution are skewness (s) and kurtosis (k). These are calculated as
follows:
[1/NI:/Xi-IlY] (6)
k= 4
(J
For a perfect normal distribution, s is equal to zero. A negative value is due to skewness towards lower values while a positive value indicates non-symmetry towards higher values. For small data sets, one often gets value s that differ from zero. The kurtosis or flatness k is very close to unity for a normal distribution. These statistical parameters may be use d to perform a quick check of the changes in the statistical behavior of a signal [4, 5].
A Study On Spectral And Statistical Analysis Of Noisy Signals For Physical Processes
with the unit standard deviation and zero mean value like N(O, 1), noisy signal can be
defined. In this manner, the simulated noisy signal with its harmoni c can be shown as below.
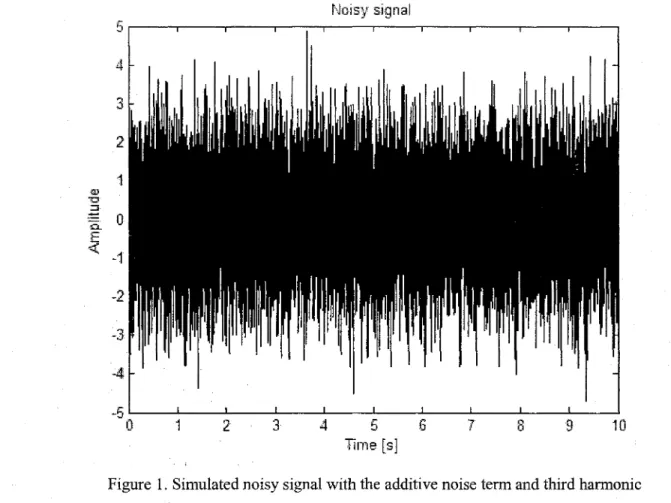
Noisy signal 5 4 3 2 1 -2 -3 -5 o. 1 2
3
41)6 Time ls] 8 9 10Figure 1. Simulated noisy signal with the additive noise term and third harmoni c in this signal, the noise term is highly dominant, therefore the useful information, which are represented at the 50 Hz and 150 Hz, is hidden information. The main goal of this study is to extract this useful information and show the statistical properties of the noisy signal according to the noise leveL.
5. APPLICATION
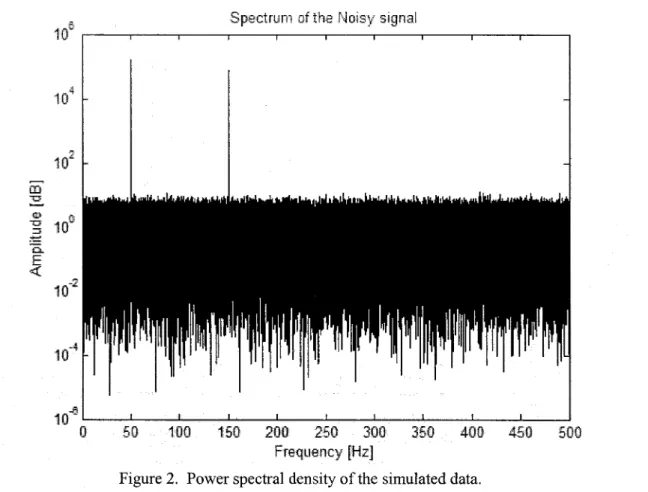
If the power spectrum, which is defined in the section 2, is applied to the simulated signal, the sinusoidal components of the noisy signal can be extracted. However, when the noise part is dominant over the deterministic parts, to show them at the specific frequencies is very difficult. For this reason, to prevent this situation semi-logarithmic scale is used. As a resuIt the simulated data like Figure 1 can be represented by the following figure 2.
SpectrUn1 of the Noisy signal cl.. E <::( ~ 10 (i 50100 150 200 250 300 350 400 450 500 Frequency [Hz]
Figure 2. Power spectral density of the simulated data.
As seen from the Figure 2, two sinusoidal components, which are given at 50 Hz and 150 Hz, are fundamental frequencyand its third harmonic respectively.
Here, to determine· the effect of the noise term if we compute the statistical parameters of the simulated data as defined in section 3. These computed parameters can be given by table 1.
Table 1. Computed statistical parameters.
Statistical Skewness (s)StandardMeanKurtosis (k)(pt)
Parameters Deviation
(u)
0.0018
1.3201 2.0040e-0042.7303
A Study On Spectral And Statistical Analysis Of Noisy Signals For Physical Processes
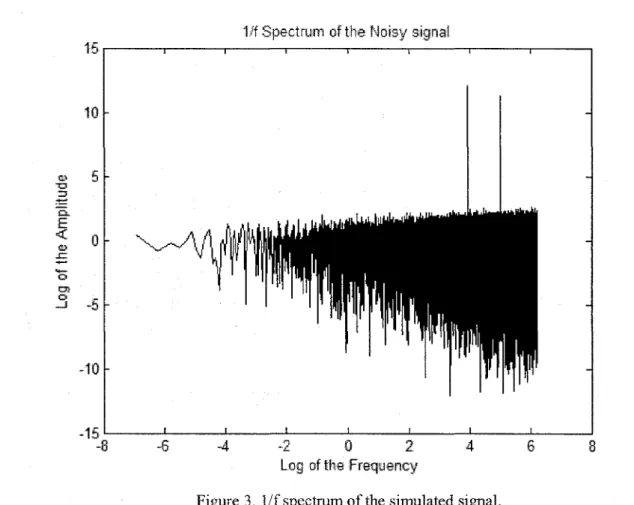
Where the signal or Noise power can be indicated by the variance of the signals for this re ason ifit is computed, the SNR can be given by -1.2741. This result is a small number and it denotes that the Gaussian noise is dominant in the simulated data. Also this property can be shown by the variation of the 1/f-spectrum.
1/f Spectrum of the Nais,:! signal
15 10 G...\ 5 "o1» .•...<:(.!::
ci
-
-
:::iE o: ci i::i) ci -5 ...J -10-t5
-8 -o -2 O 2Log of the Frequency
4
Figure 3. 1/f spectrum of the simulated signaL.
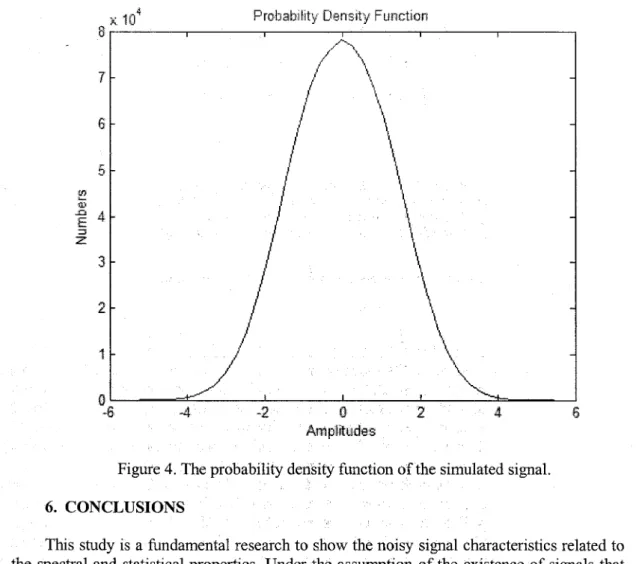
in figure 3, the high frequency region indicates the Gaussian noise as well as sinusoidal components at SO and ISO Hz. Also, the probability density function of the simulated data,
which is defined by the statistical parameters computed in Table 1, is shown by the
Probability Det1sity Functian i) Arnplitudes /'--...
li '\
i
'j .'/
\
i \i -2 7 o -6 x 8 2 3 5 1 :~ <l)E
4
::iz
Figure 4. The probability deiisity function of the simulated signa1.
6. CONCLUSIONS
This study is a fundamental research to show the noisy signal characteristics related to the spectral and statistical properties. Under the assumption of the existence of signals that refiect the basic properties of special physical processes, this signal analysis application was realized for both of the spectral and statistical techniques. in this -sense, most interesting view-point of this study is lif spectrum because itcombinesthe properties of the spectral and statistical quantities. At the same time it shows the fiat noise spectrum, which denotes the white noise. Also, in the probabilistic manner, Figure 4 shows the bell-shaped variation of the analyzed signal as a highly symrnetrical distribution function
REFERENCES
[1] Zwingelstein G. "Statecof-tbe-Artof Maintenance and Diagnostic Metbods for Fossil Fired Power Plants"
Maintenance and Reliability Conference Proceedings (MARCON'98), Tennessee, Knoxville, USA, 1998, p.34.01-34.18.
[2] Seker S, Ayaz E., "A study on condition monitoring for induction motors under the accelerated aging processes", IEEE Power Engineering Review 2002; 22/7: 35-37.