Cumhuriyet Science Journal
CSJ
e-ISSN: 2587-246X
ISSN: 2587-2680 Cumhuriyet Sci. J., Vol.38-1(2018) 23-33
* Corresponding author. Email address: denizbingol1@gmail.com, deniz.bingol@kocaeli.edu.tr
http://dergipark.gov.tr/csj ©2016 Faculty of Science, Cumhuriyet University
Chemometric Evaluation of the Heavy Metal Contents in Surface Soils
from the Dilovası Region (Kocaeli/Turkey)
Deniz BINGOL1*, Seda KARAYUNLU BOZBAS1, Umit AY1, Nevin UZGOREN2
1Kocaeli University, Department of Chemistry, Kocaeli, TURKEY
2Dumlupınar University, Faculty of Economics and Administrative Sciences, Kütahya, TURKEY
Received: 02.11.2017; Accepted: 11.01.2018 http://dx.doi.org/10.17776/csj.348921
Abstract: Chemometric methods were used to assess the contamination of heavy metals (As, Cd, Co, Cr, Cu, Hg, Mn, Ni, Pb and Zn) and to classify the contents of heavy metals of surface soil samples taken from 10 locations in Dilovasi region. The data were subjected to chemometric assessment to determine the relationship among the heavy metals and to classify the soil samples. The heavy metals were detected using inductively coupled plasma-mass spectrometry (ICP-MS). Analytical data were analyzed using correlation analysis, principle component analysis (PCA) and cluster analysis (CA) to assess whether there is an association among heavy metals in soil samples. The soil samples were separated into 4 groups by a group very similar to both PCA and CA. PCA and CA techniques have proven to be useful approaches for soil characterization in terms of their heavy metal contents.
Keywords: Chemometrics, cluster analysis, heavy metals, principal component analysis, soil samples
Dilovası (Kocaeli/Türkiye) Bölgesinden Alınan Yüzey Topraklarındaki
Ağır Metal İçeriklerinin Kemometrik Değerlendirilmesi
Özet:Kemometrik yöntemler, Dilovası bölgesindeki 10 lokasyondan alınan yüzey toprak numunelerinin ağır metal (As, Cd, Co, Cr, Cu, Hg, Mn, Ni, Pb ve Zn) kirliliğini değerlendirmek ve ağır metal içeriğini sınıflandırmak için kullanıldı. Veriler, ağır metaller arasındaki ilişkiyi anlamak ve toprak numuneleri sınıflandırmak için kemometrik değerlendirmeye tabi tutuldu. Toprak numunelerindeki ağır metaller, indüktif eşleşmiş plazma-kütle spektrometresi (ICP-MS) kullanılarak belirlendi. Toprak numunelerinden elde edilen analitik veriler, toprak örneklerinde ağır metaller arasında herhangi bir ilişki olup olmadığını değerlendirmek için korelasyon analizi, temel bileşen analizi (PCA) ve kümeleme analizi (CA) kullanılarak sınıflandırıldı. Toprak örnekleri hem PCA hem de CA için çok benzer bir gruplandırma ile 4 gruba ayrıldı. PCA ve CA tekniklerinin ağır metal içerikleri açısından toprak karakterizasyonu için yararlı yaklaşımlar olduğu kanıtlandı.
Anahtar Kelimeler: Kemometri, kümeleme analizi, ağır metaller, temel bileşen analizi, toprak örnekleri
1. INTRODUCTION
Metal contamination in soils is a problem that the multi-element. Soil pollution are emphasized more increasingly by many environmental protection
agencies and communications due to industrialization and urbanization. However, soil is less noticeable compared to other forms of pollution such as food, water and atmospheric
pollution. Extremely high levels of pollutants can be found in many industrial areas and around the population-intensive cities [1].
With a population of 50.000, the town of Dilovası of Kocaeli is the symbol of the uncontrolled industrialization of Turkey. The Dilovası organized industrial zone located in the center of the topographic structure like a bowl has a total of 185 companies including metal, chemistry and energy in 45 sectors. For this reason, the region has caused serious environmental problems such as soil, air and water pollution [2].
It has been proposed different analytical techniques such as atomic fluorescence (AFS), X-ray fluorescence spectrometry (XRF), neutron activation analysis (NAA), atomic absorption spectrometry (AAS), inductively coupled plasma mass optical emission spectrometry (ICP-OES), inductively coupled plasma mass spectrometry (ICP-MS) for analysis of heavy metal content in soil matrix [3]. ICP-MS is the most commonly used technique providing a high sensitivity, wide dynamic range, isotope ratio information and sample entry using alternative devices such as electrothermal evaporation (ETV) and laser ablation (LA), it’s as well as multiple element capabilities [4].
In recent years, chemometric techniques have been widely used to investigate heavy metal concentration and distribution in soils. The most commonly used multivariate methods are correlation analysis, principal component analysis (PCA), and cluster analysis (CA) for the identification of pollutant sources. These methods are also used to indicate the variability of soil properties and the related controlling factor(s).
For overview of the heavy metals and polycyclic aromatic hydrocarbons (PAHs) distribution pattern in former manufactured gas plant (MGP) site soils, Principal component analysis (PCA) was used by Thavamani and Megharaj [5]. Nanos and Martin were used factorial kriging with a principal component analysis (PCA) for seven heavy metal concentrations in the agricultural topsoil of the
Duero basin (N Spain) to analyses spatial variation and covariation and to identify their sources [6]. In 2014, a group of scientists were used principal component analyses (PCA) to identify common groupings of chemical elements in 54 New York City community garden soils [7]. Multivariate and geostatistical analysis approaches were used by Yuan et al. [8] to determine the anthropogenic and natural components of total heavy metal concentrations in the top soils of a closed steel smelter in China. And this study showed that to characterize spatial distribution of heavy metals and to determine their sources can be represented by the combination of environmental mapping and multivariate geostatistical analysis. Examination of the heavy metal concentration of soils of the Tiexi Industrial District, east of Shenyang in China was performed by Li et al. [9]. Their studies main subject was to assess the concentration and distribution patterns of heavy metals in urban soil, and to identify the relationship between urban land use and the heavy metal contamination of urban soil by using PCA. Correlation matrix and multivariate analyses including principal component analysis (PCA) and cluster analysis (CA) were used for identified the possible sources of heavy metals on surface soils, which intense industrialization in the Pearl River Delta of Guangdong [10].
Qislaqi et al. [11] used the selected multivariate statistical methods like as multivariate analysis of variance, discriminant analysis, principal component analysis and geostatistical techniques for determined soil pollution status in arable lands of the Angouran region, NW Iran [11]. Since soil data sets normally contain a large number of objects and many features, analysis with univariate statistical methods is complex and generally insufficient. Alternatively, multivariate statistical methods give more information about the properties of a soil, considering many variables at the same time. Multivariate statistical methods give more information about the soil by considering many variables simultaneously than univariate statistical methods [11]. For clustering the soil samples with a similar heavy metal content, CA
was applied. It was done according to Ward-algorithmic method [12].
The purpose of this study was to determine similarities in the contents of their heavy metals (As, Cd, Co, Cr, Cu, Hg, Mn, Ni, Pb, and Zn) applying correlation analysis, main component analysis (PCA) and cluster analysis (CA) as chemometric techniques to the results of 10 soil samples obtained from inductive double plasma-mass spectrometry (ICP-MS).
2. MATERIALS and METHOD 2.1. Instrumentation
The heavy metals (As, Cd, Co, Cr, Cu, Hg, Mn, Ni, Pb, and Zn) amounts in the soil samples were determined by an inductively coupled plasma-mass spectrometry (ICP-MS) instrument (Perkin Elmer DRC-e/Cetax ADX-500) after acid digestion using microwave digestion system (Milestone Ethos-D).
2.2. Sample Collection and Preparation
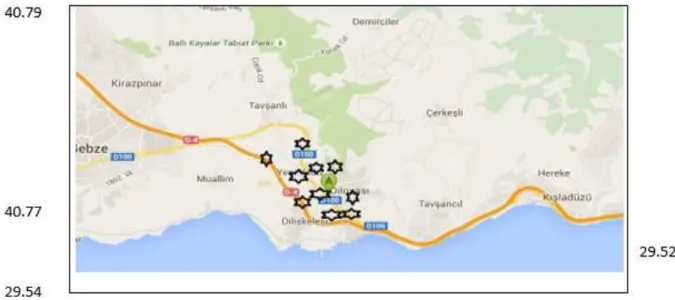
A total of 10 sampling sites in the Dilovası Region shown in Figure 1 (October, 2016) were selected for sampling. Soil samples given Table 2, namely t1- Assan Aluminum factory, t2- TOS Steel, t3- On the way between Diler-Unilever, t4- DYO Paint Factory, t5- Organized industrial area as well as settlement, t6- On the road across from Izocam, t7- Solventaş side first entry, t8- Solventaş port facilities final exit, t9- Mobel Chemical Industry Factory, t10- Nuh Cement, were solved in microwave acid digestion unit. Contents of 10 heavy metals (As, Cd, Co, Cr, Cu, Hg, Mn, Ni, Pb, and Zn) in soil samples were measured using ICP-MS. The results are mean values for three parallel experiments.
Table 1. Sampling sites.
Sampling code Sampling sites Location
t1 (soil) Assan Aluminum factory 40.781754; 29.536879
t2 (sediment) TOS Steel 40.794708; 29.529669
t3 (soil) On the way between Diler-Unilever 40,4659; 29.3142 t4 (sediment) DYO Paint Factory 40.786891; 29.528950 t5 (soil) Organized industrial area as well as settlement 40.772945; 29.547020 t6 (soil) On the road across from İzocam 40.786458; 29.518043 t7 (soil) Solventaş side first entry 40.4615; 29.3234 t8 (soil) Solventaş port facilities final exit 40.7708; 29.5428 t9 (soil) Mobel Chemical Industry Factory 40.792918; 29.532063
Figure 1. Sampling sites in the Dilovası Region.
2.3. Statistical Analysis
Pearson's correlation coefficient analysis, principal component analysis (PCA) and cluster analysis (CA) are used to identify the relationship between the heavy metals and soil samples. In this study, the descriptive statistical parameters were calculated by the PASW Statistics 18 and Minitab 16 software.
PCA is used to reduce the original factors and to extract a smaller number of latent factors to analyze relationships between the observed variables [5]. The aims of PCA are to come to decision about close relation knowledge from multivariate raw data [13]. PCA is a thing coming out from methods that simply visualize all the knowledge in a data set. This method also helps to identifies similarities and differences between samples and find out which variables most effects to difference [2].
In this study, PCA was performed to study the correlations among heavy metals in soil samples and properties and their grouping into a few factors.
p values less than 0.05 were considered significant
in statistical test results. A principal component analysis was done to evaluate separately the structure of the data, with principal components having eigenvalues greater than one kept and dependent to a varimax orthogonal rotation. For
minimize the number of heavy metals and properties with a high loading on each soil and facilitates the interpretation of results, CA were used. Specifically, principal component scores are used by CA. And CA is used for to Organize a set of group/variable observations and determine whether the observed characteristics are shared. CA and PCA were used together to control data and for grouping individual parameters and variables. The CA is complementary to PCA. For given the results in a regular form a Dendrogram method is used for hierarchical clustering [14]. Hierarchical cluster analysis uses an algorithm which begins with each variable in a separate cluster and combines clusters until only one is left, that helps identify homogeneous variable groups [15]. The measurement similarities of the objects which are going to be clustered based on unsupervised classification procedure. For determining the relationship between contents of heavy metals and soil examples correlation matrix (CM) was used. Ward-algorithmic method was used for CA for clustering the samples with a similar heavy metal content [12]. PASW Statistics 18 and Minitab 16 software was used for statistical analysis of data.
For classified or clustered a given multidimensional data set with m number of variables and n number of samples with PCA model is given as:
A = T × B + EA (1) where A = n × m original data matrix,
T = n × h score vectors matrix or principal component scores matrix,
B = h × m loading vectors matrix EA = n × m residuals and
h = the number of principal
From the eqn. 1, PCA is formed two smaller matrices from original data matrix which name scores and loadings [16].
3 RESULTS and DISCUSSION
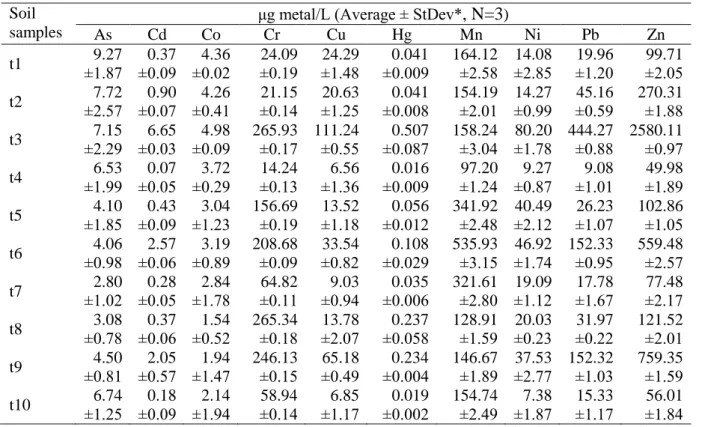
Data analysis was done using chemometrics such as correlation analysis, PCA and CA.The average of the three repetition results obtained from ICP-MS for ten metals on ten soil samples is shown in Table 2 together with standard deviations. Considering the data in Table 2, soil samples and heavy metals were classified by means of correlation analysis, principle component analysis and cluster analysis.
Table 2. Analysis data concerning soil samples.
Soil samples
μg metal/L (Average ± StDev*
, N=3
)As Cd Co Cr Cu Hg Mn Ni Pb Zn t1 ±1.87 9.27 ±0.09 0.37 ±0.02 4.36 ±0.19 24.09 ±1.48 24.29 ±0.009 0.041 164.12 ±2.58 ±2.85 14.08 ±1.20 19.96 ±2.05 99.71 t2 ±2.57 7.72 ±0.07 0.90 ±0.41 4.26 ±0.14 21.15 ±1.25 20.63 ±0.008 0.041 154.19 ±2.01 ±0.99 14.27 ±0.59 45.16 270.31 ±1.88 t3 ±2.29 7.15 ±0.03 6.65 ±0.09 4.98 265.93 ±0.17 111.24 ±0.55 ±0.087 0.507 158.24 ±3.04 ±1.78 80.20 444.27 ±0.88 2580.11 ±0.97 t4 ±1.99 6.53 ±0.05 0.07 ±0.29 3.72 ±0.13 14.24 ±1.36 6.56 ±0.009 0.016 ±1.24 97.20 ±0.87 9.27 ±1.01 9.08 ±1.89 49.98 t5 ±1.85 4.10 ±0.09 0.43 ±1.23 3.04 156.69 ±0.19 ±1.18 13.52 ±0.012 0.056 341.92 ±2.48 ±2.12 40.49 ±1.07 26.23 102.86 ±1.05 t6 ±0.98 4.06 ±0.06 2.57 ±0.89 3.19 208.68 ±0.09 ±0.82 33.54 ±0.029 0.108 535.93 ±3.15 ±1.74 46.92 152.33 ±0.95 559.48 ±2.57 t7 ±1.02 2.80 ±0.05 0.28 ±1.78 2.84 ±0.11 64.82 ±0.94 9.03 ±0.006 0.035 321.61 ±2.80 ±1.12 19.09 ±1.67 17.78 ±2.17 77.48 t8 ±0.78 3.08 ±0.06 0.37 ±0.52 1.54 265.34 ±0.18 ±2.07 13.78 ±0.058 0.237 128.91 ±1.59 ±0.23 20.03 ±0.22 31.97 121.52 ±2.01 t9 ±0.81 4.50 ±0.57 2.05 ±1.47 1.94 246.13 ±0.15 ±0.49 65.18 ±0.004 0.234 146.67 ±1.89 ±2.77 37.53 152.32 ±1.03 759.35 ±1.59 t10 ±1.25 6.74 ±0.09 0.18 ±1.94 2.14 ±0.14 58.94 ±1.17 6.85 ±0.002 0.019 154.74 ±2.49 ±1.87 7.38 ±1.17 15.33 ±1.84 56.01 * StDev: Standard deviation
3.1. Descriptive Statistics
At the present study; as the first stage, the descriptive statistics of the selected variables were
calculated and the obtained findings were evaluated (Table 3).
Table 3. Descriptive Statistics for As, Cd, Co, Cr, Cu, Hg, Mn, Ni, Pb, and Zn.
Variable Mean StDev Minimum Median Maximum Range Skewness Kurtosis
As 5.595 2.174 2.800 5.515 9.270 6.470 0.26 -1.17 Cd 1.382 2.031 0.0700 0.400 6.650 6.580 2.32 5.70 Co 3.201 1.132 1.540 3.115 4.980 3.440 0.07 -1.07 Cr 132.6 106.9 14.2 110.8 265.9 251.7 0.18 -2.06 Cu 30.5 33.4 6.56 17.2 111.2 104.7 1.95 3.58 Hg 0.1294 0.1565 0.0160 0.0485 0.5070 0.4910 1.84 3.34 Mn 220.4 137.1 97.2 156.5 535.9 438.7 1.63 2.22 Ni 28.93 22.66 7.38 19.56 80.20 72.82 1.40 1.88 Pb 91.4 135.4 9.08 29.1 444.3 435.2 2.35 5.86 Zn 468 780 50.0 112 2580 2530 2.66 7.47
When the descriptive statistics for the 10 variable data sets are examined, it is seen that positive and strong asymmetry (skewness > 0.5) exist in Mn, Ni, Cu, Zn, Cd, Pb and Hg variables (elements). That is, the observational values tend to converge at fairly small values. It is seen that Cr and As variables have weak and positive asymmetry, and Co variable is shown an approximately symmetric distribution. This means that the observation values in these variables are collected in fairly close values to the average. When the kurtosis values are examined, it is understood that the series are sharp compared to normal, except for Cr, Co and As elements. Particularly, for the Cu, Zn, Cd, Pb and Hg variables, the density of collecting at fairly small values is higher than normal. When the asymmetry and kurtosis values of the series are evaluated together, it is understood that the normal distribution is not suitable for the variables used in the analysis. It is also seen that the standard deviation values for many variables (Cr, Mn, Co, Ni and As) are very close to the corresponding mean values and is even higher in a few (Cu, Zn, Cd, Pb and Hg). In this case, it implies that the observed values are significantly different from the mean value, that is, the variability is very high. This means that the soils taken from different locations
shows different characterization characteristics in terms of these elements (variables).
When the units of measure and variability of the variables involved in multivariate statistical analyzes are different, the statistical analyzes should be done over the standardized data instead of the original data. Since the standard deviations of the variables of the study are quite different from each other, they are standardized by the original data matrix 𝑧 = (𝑥 − 𝜇) 𝜎⁄ approach, and the subsequent analyzes are based on the standardized data matrix.
3.2. Pearson's Correlation Coefficient Analysis As the second stage, correlation analysis was used to determine if the principal component analysis was appropriate for the standardized data set (Table 4).
Table 4. Pearson’s correlations matrix for heavy metal contents in soil samples. Cr Mn Co Ni Cu Zn As Cd Pb Mn 0.183 Co -0.306 -0.039 Ni 0.739* 0.312 0.332 Cu 0.626 -0.093 0.392 0.863** Zn 0.580 -0.066 0.472 0.884** 0.961** As -0.499 -0.474 0.694* -0.121 0.179 0.177 Cd 0.608 0.078 0.470 0.916** 0.947** 0.986** 0,136 Pb 0.632 0.030 0.429 0.913** 0.962** 0.992** 0.119 0.997** Hg 0.800** -0.177 0.169 0.821** 0.899** 0.905** -0.045 0.876** 0.901** Cell Contents: Pearson correlation
**Correlation is significant at the 0.01 level (2-tailed) * Correlation is significant at the 0.05 level (2-tailed)
In our example, 10 variables related to 10 soil samples were examined. When Table 4 was examined, it was seen that there were very high and statistically significant correlations between the variables. This situation violated the rule of independence between variables. For this reason, it was meaningful to apply PCA to the data set to remove the dependency structure and/or to reduce the size. Thus, p variables shown interdependence structure turned into 𝑘(𝑘 ≤ 𝑝) new variable that is linear, orthogonal, and interdependent [17].
3.3. Principal Component Analysis (PCA) According to correlation analysis, there were significant correlations between the variables (heavy metals). Therefore, the principal component analysis was appropriate as the third stage. Table 5
shows the results of the analysis of the principal components. Since the standard deviation values of the variables are very different from each other, the standardized data are used in the analysis. The correlation matrix is used in the PCA since standardized data is used.
It was seen that the number of basic components with eigenvalues greater than one was three and that the first three components explained 96.2% of the total change in the data set. The first component accounts for 62.5% of the total variance, the second component for 22.5% and the third component for 11.2%. It was seen that the second component was determined by Cr and Mn and the third component by Mn and Co variables. All the coefficients of the first component had a negative sign. Such factors were called bipolar factor (di polar).
Table 5. PCA results.
Heavy Metals Component
1 2 3 As -0.026358 -0.632056 -0.027190 Cd -0.393762 -0.052489 0.093928 Co -0.154453 -0.513619 0.417367 Cr -0.281341 0.423298 -0.202382 Cu -0.386849 -0.070566 -0.086415 Hg -0.373468 0.072096 -0.288210 Mn -0.012363 0.344443 0.796659 Ni -0.375076 0.124616 0.220482 Pb -0.396288 -0.041474 0.032382 Zn -0.392733 -0.093253 -0.020643 Eigenvalue 6.2510 2.2508 1.1217 Explained variance (%) 62.5 22.5 11.2 Cumulative (%) 62.5 85.0 96.2
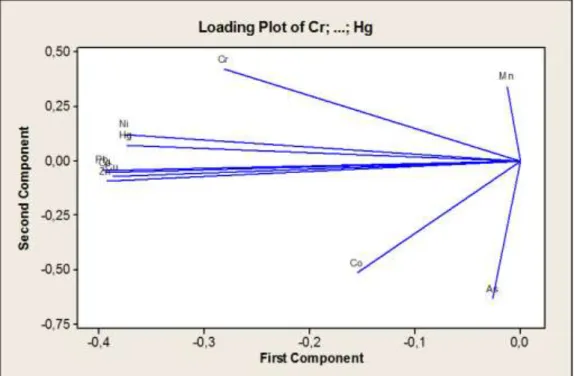
Figure 2 shows PC1 and PC2 score vectors obtained by PCA and Figure 2 shows graphs of PC1 and PC2 loading vectors against each other.
The first two components described 85% of the total change in the data set. Only 15% of the total change was neglected.
Figure 2. Score plot of PCA.
When Figure 2 and Figure 3 were evaluated together, it was seen that t8, t5 and t7 to t10, t4, t2 and t1 form a cluster, but it did not characterize any element (variable). It was seen that the formation of the soil sample defined by t6 is predominantly influenced by Mn element, and at t9 by Cr element. In the definition of t3, it was seen that Cu, Zn, Cd and Pb elements were effective. Co and As elements were not effective factors in soil characterization.
3.4. Cluster Analysis (CA)
At this stage of the study, it was aimed to classify the soil samples obtained from different locations
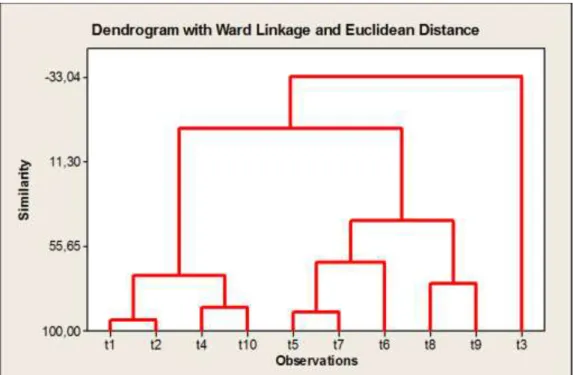
with hierarchical clustering analysis (HCA) and to compare the obtained findings with the results obtained with PCA. HCA was applied to score vectors derived from PCA. The score vectors of the first three basic components describing 96.2% of the total change in the analysis were used. The measurement is based on the squared Euclidean distance. In this study, Ward linkage method was used as a clustering method. Figure 4 shows the dendrogram obtained from the Ward linkage method.
Figure 4. Dendrogram results obtained Ward linkage method.
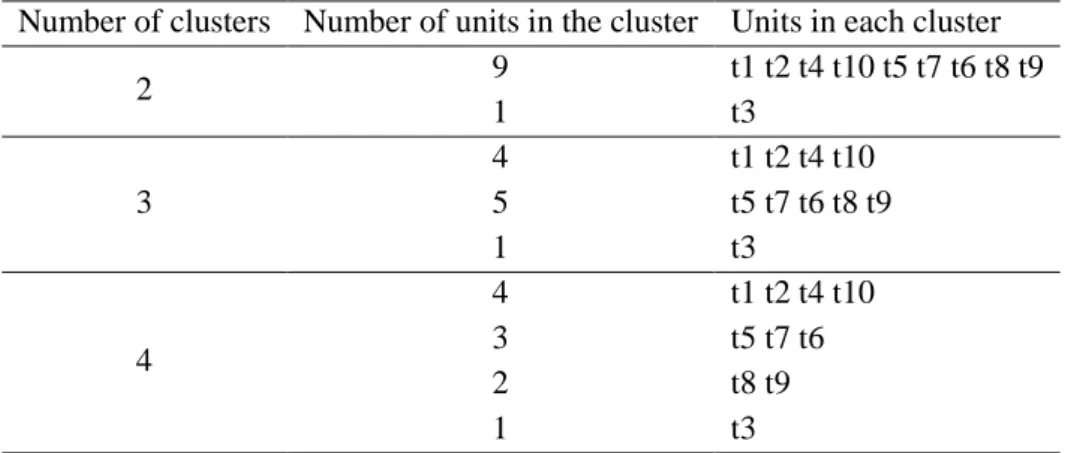
The clusters generated for different cluster numbers according to the obtained dendrogram are as follows:
Table 6. Cluster analysis results.
Number of clusters Number of units in the cluster Units in each cluster
2 9 t1 t2 t4 t10 t5 t7 t6 t8 t9 1 t3 3 4 t1 t2 t4 t10 5 t5 t7 t6 t8 t9 1 t3 4 4 t1 t2 t4 t10 3 t5 t7 t6 2 t8 t9 1 t3
Clustering analysis results appear to be approximately similar to PCA results. When the cluster number is 4, it is observed similar to PCA that t3 alone forms a cluster and t1, t2, t4 and t10 soil samples are again in the same cluster. Unlike PCA, t5 t7 and t6 to t8 and t9 form a cluster.
4. CONCLUSIONS
Surface soil samples taken from Dilovası region were classified according to heavy metal (As, Cd, Co, Cr, Cu, Hg, Mn, Ni, Pb, and Zn) contents by chemometric techniques, such as principal component analysis (PCA) and cluster analysis (CA). PCA and CA techniques were utilized to define grouping of different soil samples based on heavy metal contents. The results of PCA and CA were also found to be similar, but CA slightly different, grouping. The results suggested that the soil samples taken from different locations showed different characterization characteristics in terms of heavy metal contents. Although both methods yield approximately similar results, the advantage of PCA is that it allows the size reduction in order to remove the dependency structure altogether and can show the factors (heavy metals) that influence the characterization of the units (soil, water) as well as the cluster. PCA and CA were useful tools for assessing soil samples for the similarity of heavy metal contents.
REFERENCES
[1]. Yılmaz F., Yılmaz Z.Y., Engin M., Erkal A.Y., Müftüoğlu A.E., Karakelle B., Heavy metal concentrations in surface soils of Izmit gulf region Turkey. J Trace Microprobe Techn 21 (2003) 523-531.
[2]. Bingöl D., Ay Ü., Bozbaş K.S., Uzgören N., Chemometric evaluation of heavy metals distribution in waters from the Dilovası region in Kocaeli, Turkey. Mar Pollut Bull 68 (2013) 134-139.
[3]. Soodan, R.K., Pakade, Y.B., Nagpal, A., & Katnoria, J.K., Analytical techniques for estimation of heavy metals in soil ecosystem: a tabulated review. Talanta 125 (2014) 405-410.
[4]. de Carvalho R. M. Jr., dos Santos J.A., Silva J.A., do Prado T.G., da Fonseca A.F., Chaves E.S., Frescura V.L., Determination of metals in Brazilian soils by inductively coupled plasma mass spectrometry. Environ Monit Assess 187 (2015) 535.
[5]. Thavamani P., Megharaj M., Multivariate analysis of mixed contaminants (PAHs and heavy metals) at manufactured gas plant site soils. Environ Monit Assess 184 (2012) 3875-3885.
[6]. Nanos N., Martín J.A.R., Multiscale analysis of heavy metal contents in soils: Spatial variability in the Duero river basin (Spain). Geoderma 189-190 (2012) 554-562.
[7]. Mitchell R.G., Spliethoff H.M., Ribaudo L.N., Lopp D.M., Shayler H.A., Marquez-Bravo L.G., Lambert V.T., Ferenz G.S., Russell-Anelli J.M., Stone E.B., McBride M. B., Lead (Pb) and other metals in New York City community garden soils: Factors influencing contaminant distributions. Environ Pollut., 187 (2014) 162-169.
[8]. Yuan G.-L., Sun T.-H., Han P., Li J., Environmental geochemical mapping and multivariate geostatistical analysis of heavy metals in topsoils of a closed steel smelter: Capital Iron & Steel Factory, Beijing, China J Geochem Explor., 130 ( 2013) 15-21. [9]. Li X., Liu L., Wang Y., Luo G., Chen X.,
Yang X., Hall M.H.P., Guo R., Wang H., Cui J., He X., Heavy metal contamination of urban soil in an old industrial city (Shenyang) in Northeast China. Geoderma, 192 (2013) 50-58.
[10]. Hu Y., Liu X., Bai J., Shih K., Zeng E.Y., Cheng H., Assessing heavy metal pollution in the surface soils of a region that had undergone three decades of intense industrialization and urbanization. Environ Sci Pollut Res., 20 (2013) 6150-6159.
[11]. Qishlaqi A., Moore F., Forghani G., Characterization of metal pollution in soils under two landuse patterns in the Angouran region, NW Iran; a study based on
multivariate data analysis. J Hazard Mater , 172 (2009) 374-384.
[12]. Micó C., Recatalá L., Peris M., Sánchez J., Assessing heavy metal sources in agricultural soils of an European Mediterranean area by multivariate analysis. Chemosphere, 65 (2006) 863-872.
[13]. Brereton R.G., Applied Chemometrics for Scientists. John Wiley & Sons Ltd., England, 2007.
[14]. Lu X., Wang L., Li L.Y., Lei K., Huang L., Kang D., Multivarite staistical analysis of heavy metals in street dust of Baoji. NW China. J Hazard Mater, 173 (2010) 744-749. [15]. Yongming H., Peixuan D., Junji C.,
Posmentier E.S., Multivariate analysis of heavy metal contamination in urban dusts of Xi'an, Central China. Sci Total Environ, 355-1,3 176-186.
[16]. Kucukbay F.Z., Kuyumcu E., Karaca I., Ozdemir D., Determination of minerals and trace elements in soils and the relation with its concentrations in sugar beets. Asian J Chem., 22-5 (2010) 3691-3704.
[17]. Ersungur Ş.M., Kızıltan A. & Polat Ö., Türkiye’de bölgelerin sosyo-ekonomik gelişmişlik sıralaması: Temel bileşenler analizi, Atatürk Üniversitesi İktisadi ve İdari Bilimler Fakültesi Dergisi, Erzurum, 2007.

