12 The relative efficiency of the
public manufacturing industry
in Turkey
An interte1nporal analysis using
paran1etric and non-paran1etric
production function frontiers
Osman Zaim and Fatma Taskin
Introduction
The wave of privatization in both developed and developing coumries initiated a number of research projccts which fiKused on the analysis of pcrfonnance of public and private enterprises using the criterion of productive efficiency. The theoretical arguments which explain the relatively poor performam:e of public entcrprises compared to their private counterparts bascd thcir approach on the incenrivc and monitoring strnnmes faced by their respective man�,gers. In their study, Domberger and Piggott ( 1986) claim that the inccntives and the consrraints provided by the markct promote.: productive and techniGll efficiency in the private.: sector whereas the public sector may face.: a diftcrcnt set of incentive structures which may not be compatible with the pursuit of efticicncy in production. A related argument is prcsentcd in thc propcrty rights lirerarurc which ties the inhcrcnt dfo.:iency diftcrenees to the.: very nature.: of the ownership strucrure and its eftccts on monitoring the managers. In his pioneering work Alchian ( 1965) argucs that whilc the broadly dispased and non-tr;111sforablc owncrship rights of public cnterpriscs reduccs the.: incentive of the public owners (voters or taxpayers) to monitor the performance of the public sector manager, the more co11cenrrated a11d transferable ow11ership strncture of the private sector ge11erates i11ce11tives for shareholders to mo11itor m.rnagerial perfimn.,nce.
The purpose of this study is twofold. Onc objc1:tive is to show that two alter-11arivc approaches in rhc produnion frontic.:r literature, commonly rdcrrcd to as the.: 11011-paramctric non-stochastic produnion fronricrs a11d rhc.: stochastic production frontiers yield consistent and complcmc11tary rc.:sults. The seco11d aim is to evaluate and compare the performa11ce ofrhc public and priv,ltc manu fanuring senors i11 Turkey by using these competing mcrhod�. Spe,ifically, we will start with a non-parametric nOJVitochasti<.: prndu<.:tion frontier methodology to establish a manufacturing sector frontier for Turkey for each ycar benvee11 1974 and 1991 based on d.na 011 twenty-c.:ight subscctors whcrc public and priv,ll'c sccrors arc registcred scpar,1tcly. Once these frontiers arc <.:onsrrncted,
'171c public 1n1w1tjhctttri11J7 industry in 'litr/(cy 275
then ..:xamination of each subscctor's distance to the f
rontier at each year for
both ownership types will show the developments in dfa:ic111.:y rthrough time.
The results obtained from rhis approach can further be examined by rwo other
model specifications, namely the time-varying stochastic production f
rontier and
the efficiency dfrcrs model, borh utilizing panel data. While the first specifi
cation allows one to determine how efliciency varies in time, the latter model
will test whether there arc statistically significant diftcrcm:cs between average
n.:elmical dfo.:icn<.:y levels of public and privarc se<.:tors.
The cl1aptcr is organized as follows. The following section of the study gives
a brief summary of the developments in Turkish manufacruring industry cmpha·
sizing the role of the public sector and summarizing the rcsulits of previous
empirical studies. The model specification arc presented in the following section,
afrcr which there is a discussion of data source and results.
The role of the public sector in Turkish manufacturing
industry
Prior to the 1980s, the main ti:atllrc of the development strategics pursued by
successive Turkish governments was their reliance on strong interventionist
policies. During the early 1920s the strong sentiment against foreign business
afrcr the War of Independcn<.:c lc'd the government ro provide suhsrnnti,tl incen
tives for the creation of a local enm.:preneuri.tl class. However, the disruption of
agriculrural export markets during the Great Depression and the ensuing foreign
exchange shortages accelcr.trcd industrial import substitution and proved to be
.1dccisivc factor in the country's turn towards statism. Hence, starting f
rom the
mid-193():; the state assumcd thc role of thc cntrepreneur class through the
creation of public enterpriscs in a broad range of manufacturing activities. The
statl' m;ti11tairn:d its role .1s an ;\gem of industrialization even after t:hc emcrgencc
of the private sector in the late 1940s and with the introduction of central
planning during the 1960s, its intervention on the economy as a whole reached
peak level.
The industrialization policy of the import substitution period, charac
terized by heavy protectionbt measures created a favomable environment for
manufacturing investment.' The growth of output averaging 7 .5 per cent
during the 1965-80 period, increased the share of manuf:.tcturing in gross
domestic product (GDJ>) from 14. l per cent in 1963 to 19.1 per cent in
1979. In the same period, an increased public sector activity in capital
intensive sc<.:tors such as basic mctals, ti.:rtilizcr, paper and pctrochemic,tls
resulted in a structmal shift from the production of consumption goods
towards the production of intermediate and capital goods. With these devel
opments, thc share of valuc addcd generated by the public scctor enterprises
in the large manufactming industry increased to levels as high as 35 per cent
towards the end of J 980s.2 The increased importance of public production is
also rdlccrcd in its share of employment and investment in the total largc
manufacturing sector (sec Table 12. l ).
276
Omui11.
%aim and fntma 'ins/tin
'liibfr 12. l Share of rhc public; �cc;1or in brgc m,rnufa..:rurin!!, l'c:rc,:nt slmr,· ofp11/Jlic 1976 1981 1986 s.:ctor in 11111111(/i1cturi11.11 Valu..: addcd
29
46 40 Employmcnr35
3429
illl'CSIJllClll32
27
32
/9')/32
.,�
_:-,9
Soun:c:: ,rn11pu1cd li'om various issuc:s of /111111111/ M11m�fiict11rillJJ J11d11.,·tr.v St11-1i,-1it:s, Sratc: 1 nsl ii 111<: of Staris1ic;s (Turkey).
By
the late1970s,
Turkey's inward-oriented policies and conrinued reliance 011 rhe public sector as the engine of development caused growing fiscal and current ,\Ccount deficits. These shortfalls led ro unsustainable levels of debt whkh resulted in the announcement of the1980
stabilization am! adjust111c11t program111e. The 111arket-orienred adjustment programme, with an outward looking dcvelop111ent strategy, had the objective of liberalizing the economy. In this fr.1111ework, autonomy given to public enterprises in price setting improved their tinam:ial position for a short period. However, this did not decrease their reliance on the government's budget. The initial guidelines for the reform programme stared that the government would abstain from exp,mding the public sector and hence, with this objc;ctive at hand, public invcstments were c;hannelled away from manufacturing industry towards infrastnH.:tural sectors such as communic.ition, transportation and eneq,ry. With the intention of allevi ating the pressures on the government's budget, public; enterprises in the manufa<.:turing se<.:tor were dire<:red towards <.:ommercial channels to borrow for their day-to-day financing requiremems. This, in<.:reasing the debt service requirements of the public sc;<.:tor, led ro even lower levels of investments in an ,lttcmpt to reduce the public enterprise borrowing requirements.The poor record of public sector investment was not compcnsarc;d by the private sector. As one <.:an follow from Table 12 .2, total manufacturing investment reached its peak level prior to the debt crisis of
1977 and fi-0111 then
on it dcreriorarcd significantly. Private-public breakdown of this declining total m,rnufacturing invc;stmcnr shows that public manufacturing invest111c11r dc<.:reased faster than private sector invest111ent. The reasons behind the decline in private investment were increasing interest rates, which resulted from financial liberalization and the crowding-out effecr of govc;mmenit borrowing. rurrhcnnore, heavy real currency depreci;1tio11 and macroeconomic instability prevented private sector i11vest111e11t from sustaining the levels it r,cached during thc; previous decade, which had tcarurc;<l a heavy reliance on foreign borrowing. The rc;cent debates on privatization c;oupled with the poor tinan<.:ial pcrfor-111ancc of public enterprises initiated an academic <.:uriosity 011 the sources of growth in the Turkish 111anufacturing sector, which resulted in a series of works on total factor productivity growth.Earlier studies, inspired by the virtues of rhe outward oriented growth srraregy of the liberalization episodes, arre111ptcd both to cst.1blish the links
'J he public 11uumfncturing inrlmtry in Titrhcy
277 '/ii/,fr 12.2 Index nu Ill hers for m:111ufonuring invcsrlllents (1988 prices, I 980� 100)'li1tnl J>ri1,11tc l'rtblic
1111in 1tjiictu ri11JJ 111n.111�fiict1trill .. 1J 111am�fiict1tri1t .. 1J il111cst111c11 ts in11cst111cnts i1111cst111m ts
1974 88 125 49 1975 122 153 89 1976 134 174 92 1977 138 175 97 1978 1 16 155
74
1979 105 1 14 95 1980 100 100 100 1981 92 96 88 1982 82 95 68 1983 74 90 57 1984 70 92 47 1985 75 95 54 1986 75 104 44 1987 63 95 29 1988 59 94 23 1989 54 89 17 1990 84 146 19 1991 82 157 3S0l1rcc.:: c:ompurc.:d from various issues of ,l;foi11 far11111111i, Indicntors: Turk<.:)', Star, Pl.111ning Org,111izatio11 (Turkish Rqiublic Prime Ministr)').
between total factor productivity :md trade regimes and also ro evaluate relative performance of the public sector. In this respect one can cite the studies by Krueger and Tunccr ( 1982) and Nishimuzu and Robinson ( 1984 ). These studies, concentrating on the period from the mid- l 960s t<> mid-l 970s, reported significant trade policy dfrcts 011 roral factor productivity performance with the positive impact of export expansion and the negative impact of import tightening (Celasun 1994 ). rurthermore, Nishimuzu and Robinson, by comparing growth rates of total factor productivity in manufacturing for the period 1963-76 in Japan, Korea, Turkey and Yugoslavia found that they were lower in Turkey than in Korea and Japan but higher than in Yugoslavia (Nishinrnzu and Robinson 1984 ). In addition, contrary to their expect.uions, Krueger and Tunc.:er ( 1982) detected relatively higher roral facror produc.:tivity growth in the public sc.:c.:tor, which is a finding supported by Yildirim (1989) and Uygur ( 1990) for approximately the same period.
The <lrawbac.:k of the total factor productivity methodology used in these studies is that, in this approach cac.:h economic.: identity (firm, sector or country) is c.:ompared to only itself in previous periods and not to an explic.:it common bench1m1rk which makes it difficult to conduct direct multilateral comparisons. One other ddicicnc.:y of the methodology is its inability to distinguish between rcchnologic.:al progress and improvements in technical efticicnc.:y. The techniques used in this chapter, which arc the subject of the next section, will provide alternative approaches.
278 Osman Zaim and Fatma 'Jhshiu
Model
To investigate the inrertemporal efficiern.:y v.1riations in Tmkish rnanufactming
industry in gene ml and the comparative position of the stare in particular we will
employ both non-parametric nrn1-srochastic and stochastic techniques. Among
the various approad1es, we will particularly utilize:
• The r,\rrcll output-based measure of tedrnical efficiency
• The Time-varying Efficiency model of Bartese and Coelli ( 1992) and
• The Technical Efficiency Etlccrs model of Battese and Coelli
( 1995 ).
While the first modd is a non-parametric non-stochastic technique, the other
two arc the applications of the stochastic production frontiers that use panel
data. An appealing tcatme of using alternative specifi<.:ations is rhc convenience
it provides in checking for the robustness of the results and also in exrr.1<.:ting
complcmcmary knowledge about the nature of the inefficiencies in public and
private manufacturing sectors.
The foundations of the first methodology go back ro rarrcll ( 1957), where
he showed how one can measure prodm:tive efticiency and its components
allocative and tcdrnical efticiencies within a theoretically meaningful framework.
His initial approach has been adopted and extended by rarrcll and Fieldhouse
( 1962), Seitz ( 1970) and Afriat ( 1972 ). The methodology is based on the;
concept of output distance which is due to Shephard ( 1970) and is defined
relative to the prodw.:tion tcdrnology
s,
(
s,
=
I
(X
1,Y1):
X' can produce YI}) as
[fc
1 ( X, Y)=
min
f
0
:
( X', Y11$ E S
1) I.
Here yt refers to the vector of outputs
and X
1refers to the vector of inputs at period t. In other words, the distance
function measures the reciprocal of the maximal r:iy expansion of the observed
outputs (Y) given inputs (X). One advantage of the output distance ti.mction is
its ability to provide rarrcll measure of technical efficiency directly. Specifically:
D{
1=
min/0 : (X', Pie) E St I
= (max !0 : ( X
1,Y'IB) ES' 1 1-1
= l/F{
1(X
1,Y1)
( l)
where F[
1(X', Y1) is the rarrcll output-based measme of tcchnic.11 efficiency.
The output based productivity index may be computed by solving a linear
programming problem for each year. Suppose that for each t, there arc fl =
1,
... , J(O observations on inputs, Xk,
t= (X11,1
, ... , Xi,,
N) and outputs Yl-,t=
(11,
1, ... ,Yf.M)· By imposing constant returns to scale and strong disposability
on the technology, for observation ll
1we compute:
'11,c Jmb/ic 1min1tjizctttrin,_11 indmtry in 'litrltcy
279
K"L,.%"
Yz..
111 �0 Y£,
111m = 1 , ... ,M
L-- I I("L,.%
l
·
Xt.
11 �eXL,
11 m = 1 , ... ,N
k .. I ZJ.,;?:() k = I , ... ,KO
(LPI)where ZJ.o is an inrc.:nsity variable. This linear programming prohlc.:m mc.:asurc.:s the.: output basc.:d rarrc.:11 rc.:dmical c.:ftit:ic.:ncy of observation It' rc.:larivc ro the constant returns to scale reference technology of the same period, namely period t. However, by imposing additional restrictions on the intensity variable zk one can construct prodtu.:tion frontiers that satisfy diflcrcnt scale assumptions. ror
example, the additional constraint, f(tl
Lh
"' 1
k · Iif imposed on the line.1r programming problem ( LP I ), will yield efficiency srnrcs relative to a variable return to scale production frontier.
One important pitfall of this mc.:thod is that it assumes all the tkviations from the.: frontier arc.: due ro inefficiency alone.:. Howc.:vc.:r, if any noise i:s present ( e.g. due to measurement error, weather, strikes and so 011) then this may influence the placement of the production frontier and may result in exaggerated ineffi ciency scores. Nevertheless with the introduction of the stochastic production frontier approach, which is independently proposed by Aigner, Lovell and Schmidt ( 1977) and Mccuscn and van den Brocck ( 1977) these deficiencies arc alleviated. In this approach, the error structure that is assumed to be composed of two diftcrc.:nt components, one which captures the variation in output due to the factors which arc not under the rnmrol of the tirm and the other which represents the pure technical dliciency, provided a means to isolate the impact of random factors. The stochastic production frontiers, which arc initiaJly introduced for estimation of technical efficiency using cross section tirm data, have been extended in various ways regarding both specification and estimation (sec Greene
1993
for a rcccm smvcy of the frontier model literature). Particularly, realizing the potential advantages of panel data over a single cross section data in stochastic frontier estimation, Pitt and Lee (198 1 )
specified a panel data version of the Aigner, Lovell and Schmidt ( 1977) model. The initial pane.:! spc<.:itication, which is built 011 the assumption of fixed ind}icicncics over time, is ti.,rthcr extended by Cornwell, Schmidt and Sickles (1990),
Kumbh:1kar280 Osman ?-aim and fatma 'liisl1in
incorporate varying technical efficiency over time. Among the rime-varying
cfticicncy models we will employ Battcsc and Coe Iii ( 1992, 1995) specifications.
The time-varying model of Batt<.:s<.: and C:oclli ( 1992) is defined by:
and
Y;,
= /'fx;,; 13 )c(V;,-U,,J
U;, = ·11;,U; = jc
l·11''-111J U;, r E :3(i); i
=l, 2, .... ,N
(2)
where
Y;,
represents the production for rhc i'rh producing unit ar rhc t'rh obser
vation period; J(x;,;
/3)
is a suitable function of a vector x;, of factor inputs
associatcd wi rh thc production of thc i 'th producing unit in thc t'trh obscrvation
period; and /3 a vcctor of unknown parameters. The V;/s arc assumed to i.i.d
with N(O,o�. ); U/s arc also assum<.:d to be i.i.d. bur non-negative rruncation of
rhc distribution N(p,a2) where 17 is an unknown parameter to be estimated.
finally 3 r<.:prcs<.:nts rhc scr of T; rime periods among rhc T periods involved for
which obscrvations for the i'th producing unit arc obraincd. This model is
constructcd such that thc non-ncgativc observation spcc.:ific cfti:ct:s U;, dccrcasc,
remain constant or incrcasc .,s
tirn.:rcascs, if r, > 0, 17= 0 or 17 < 0 respectively.
That is, with the exponential character of rhc model technical cfticicncy must
either incrcasc at a decreasing rate (T/ > 0), dccrcasc at an increasing ratc (T'/ < 0)
or remain constant (T/ = 0).
Thc tcdrnical cffa:icncy dkcts mod cl of B.mesc .rnd Coclli ( 1995) is similar
in character to equation (2), except that thc U;, arc assumed to be random vari
ables which arc independently distributed as truncations ar zcro of a normal
distribution with mean m;, and variance a
7,
where m;, = g( z;"
o).
Hcrc z;, is a
vector of v.1riables which may influence thc cfticicncy of a producing unit; o is a
vccror of paramctcrs to be cstim.ucd; and g(.) is a suitable functional form
usu,1lly assumcd to be linear.
Data model specification and results
The methods outlined arc applicd to construct manufacturing sc.:ctor f
rontiers
for Turkey for the period 1974 - 9 1 using data on twcnry-cight subscctors
(ddincd at three digits according to International Standard Industrial
Classification) whcrc public and privatc sectors arc registered separately. In all
the applications, one has to n.:call that the best practice is a c.:ommon manufac.:
turing scc.:ror frontier whic.:h is defined over subsecrors in rhc manufacturing
industry. Note however th.1t, while c.:onstruc.:ting the bcst prac.:ticc f
rontier, public
and private production in cac.:h subscctor arc c.:onsidercd as scp.1rarc observations.
The implicit assumption that all industries utilize the same produc.:tion f
rontier
'J'hc public m,mufactiiri,JtT industry in 'for/i
cy281
simihir in nature with ones employed by Caves ( 1992) ,Ind Torri and Caves
(
1 992). In their approad1 to find rhc prodtu.:tivity difti.:rcntials between t-h<.:
subsc(tors of rwo (Ollntrics, the observations on outputs and inpms of
su bsci.:rors of these countries arc used together while constn11:ti11g a stod1asti(
produ(tion fronrier.3 A similar approad1 ar a difti.:rcm .1ggregation level is
employed by Fare et al. ( I 994) where a common bcst-practi<.:c world
(production) f
rontier is constructed using the inputs
(
aggrega
t
e
·
capit.11 and
hibour ) and outputs (GDP) of seventeen Organization of Economic
Cooperation and Development (OECD) countries in the sample.
The data arc rnmpiled f
rom Anmuil M1m1tji1cturing lmiwtry Stmistics (State
l nstitutc of Statistics 1974-91 ) whid1 cover all establishments in the public
scnor and those establishments with ten or more employees engaged in the
private sector. All three digit industries, except IS1 C:390 ( other manufacturing
industry) arc indudcd in the analysis. A nice feature of the data is that, except in
few c1scs, both government and private activity coexist in all subsectors allowing
for a (omprehcnsivc analysis of relative efficiency between public and private
enterprises during the period 1974-91.-1 Table l2A.l gives the list and the ddi
nition of these sectors indudcd in the model.
Our measure of the aggregate output of a subscctor is the real value of the
output of the industry.5 The three input proxies chosen arc: number of indi
viduals engaged in prodtu.:rion, real value of the raw materials, fi.tel and
elccrri(ity, and rota) capacity of power cquipmcnr installed at the c nd of the year
in terms of horse power.<> The usual difficulties ass<)(iatcd with computation of
the capital stocks at this disaggregate level forced us to use total capacity of
power equipment installed as a proxy for the c1pital Stc)(k.
hrst a non-parametric non-stochastic f
rontier methodology is employed and
linear programming problem ( I .P l ) is solved to construct a manuEKt'llring
sector f
rontier for all the years between 1 974 and 1991 under constant returns
to scale (CRS) and variable rct'llrns to scale (VRS) assumptions. Then, geometric
averages of the output distance fonctions arc computed for each year adoss all
rhc sc(rors and for ditfrrcm ownership types. These .wcragcs, whid1 ,Ktu.,lly
show rhc cfti(icncy levels, arc shown in rigures 1 2. l and 12.2.
On the basis of these figures it is evident that tcchnil:al efficiency in the
Turkish manufacturing industry is in a declining trcnd.7 Note th.1t borh
diagrams show the same rrend with higher efficiency scores in the VRS c1sc
rnmparcd ro the CRS case. This is theoretically expected since the CRS f
rontier
envelops the data most loosely of all scale .,ssumptions and hence results in lower
efficiency (higher incfti(icncy) s(orcs compared ro other scale .,ssumptions. With
rcspci:t to the level of technical efficiency for ditkrcnt ownership types, both
diagrams arc in agreement that there arc two distini:r periods: before and .,fi:cr
1982. Note that while until 1982 the public sector performed better than the
private sc(tor, the reverse is the case for the years after 1982 rcsul ting in almost
equal average efficiency scores when the entire sampling period is taken into
accounr.
8282
Osmnn :/.,iim ,wd fntma 'fos/1i1t 0.8 0.7 0.6 0.5 0.4 0.3 0.2 0.1 0Fig11r�
12.1
Gcomctric mcans of th.: dfo:icncy scor.:s obrain.:d from non- parametric, 11011 ·stod1asti<.: methodology ( CRS)can be further verified by stochastic specifications. The smchastic production frontier for the panel data on the three digit subsectors of the Turkish manufac turing industry is defined by
log Y;, =
/3
0 +/3
1 log( ltib;,) + {32log( rn111;,) +/J
3log( cap;,) +/3.d
log(lnb;,) J2 +/J
5[log( raw;,) J2 + /361 log( cnp;) j2 • {37log(/1ib;,)log( mp;,)whae: 0.8 0.7 0.6 0.5 0.4 0.3 0.2 0.1 0
+
/J
8log(/ab;,)log( riiJ11;1) + /3,Jlog( cnp;,)log( rrtJll;1)+
/J
rnrlog(/nb;,) +/3
1 1tlog(cnp;,) +/3
12tlog(m11•ir) + f313t + /314t1+ V;, - U;,Private age R?
g
a) 0) 0) 0) C\I (') co co 0) 0)l{fflffC
12.2
(.;.:omcrric means of rhc cfficicncy scorc� obraincd from 1101 1 -paramerric, 11011-srochasric mcrhodology (VRS)·n,c
public mmt1�fiictttri11JJ indmtry in 'forke.'Y 283Y n:pn:scnts the real value of the aggregate output of a subsccror;
raw represents the real value of raw materials fuel ;md electricity used by a su bscnor;
lab represents the number of individuals engaged in production in a
su bscctor;
cap represents a proxy variable for ,apital stock whid1 is defined ;ls the tot,ll c:1pacity of power equipment installed at the end of the year in terms of horse power; and
V and U arc random variables whose properties we defined ,earlier fo,' two alternative model specifications, namely the time-varying efficiency model of Battcse and Coelli (
1992)
and the tcdrnical cftkiency effrcts model of Battesc and Coelli (1995 ).
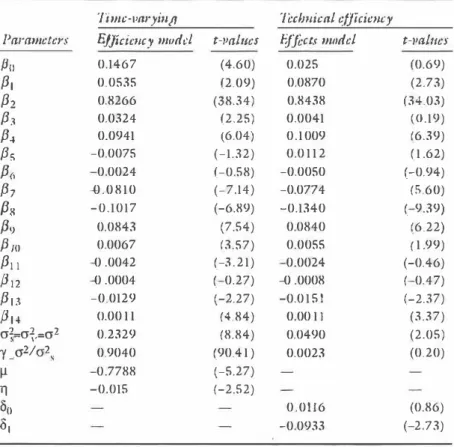
The maximum likelihood estimates of the parameters of both the models arc presented in Table l 2.3. The first column shows the parameter estimates of the time-varying efficiency model and the second column is reserved for the para meter estimates of the technical efficiency effects model.
Table 12.3 Parameter estimates
Timc-11arying Technical efficiency
Parameters Ejffricncy model t-palues Effects model t-1mlttes
/Jo 0.1467 (4.60) 0.025 (0.69) /31 0.0535 (2.09) 0.0870 (2.73) /32 0.8266 (38.34) 0.8438 (34.03) /33 0.0324 (2.25) 0.0041 (0.19) /3.i 0.0941 (6.04) 0.1009 (6.39) /35 -0.0075 (-1.32) 0.0112 ( 1 .62)
/3
<, - 0.0024 (-0.58) -0.0050 (-0.94) /37 -0.0810 (-7.14) -0.0774 (5.60)/3s
-0.1017 (-6.89) -0.1340 ( -9.39) /39 0.0843 (7.54) 0.0840 (6.22)/3 /()
0.0067 (3.57) 0.0055 ( 1 .99) /31 t - 0 .0042 (-3.21) - 0.0024 (-0.46) /J 12 - 0 .0004 ( -0.27) - 0 .0008 ( -0.47) /313 -0.0129 (-2.27) -0.0151 (-2.37) /J14 (l.00 1 1 (4.84) 0.00 1 1 (3.37) cr�=cr�.=cr2 0.2329 (8.84) 0.0490 (2.05) 'Y �cr2/ cr2 s 0.9040 (90.41 ) 0.0023 (0.20)µ
- 0.7788 (-5.27)11
-0.015 (-2.52) 60 0.0116 (0.86) 01 -0.0933 ( -2.73) .$mm:.:: author .:stimar.:s.284
Osmnn Zaim tind Ftitmti 'liisl,in
Srarring with rhe time-varying dfa:icncy model, scvcr,11 hyporhcscs arc tested to dncrminc whether rhe srn11.:tural production model and distribu tional ,\ssulllptions on the error rcrlll arc appropriate. The likelihood ratio resting pr<H:edure which simultaneously tests the signifa:ance of .1 group of cocfticicms is used. TIK structural tests include a tcsr of null hyporhesis of Hicks-neutral redrnical ch.1nge; a test of null hypothesis that rhcre is no rcd1-nical change and a tesr of null hypothesis thar the Cobb-Douglass production is rhc appropriate model. The rests 011 the distributional assumptions on the
error tcrllls included a test of the null hypothesis that the traditional average production function is a better representation of the data; that the test of the null hyporhesis rhat rime-invariant model applies; and finally a test of the null hypothesis rhar U;'s have half normal distribution. The log-likelihood function values of the restricted and that of unrestricted models together with the relevant tcsr statistics arc presented in Tabk l 2A.2. As <>nc can easily follow from this table, all null hypotheses arc n:jcctcd, leading us to conclude that translog time-varying production frontier with non-Hicks-neutral tech nical ch.rngc is the appropriate choice.
Before focusing on the cfticicncy issue, one also has to assess the cconolllic plausibility of the estimated coefficients. Thus in Tabk l 2A.3, the v.1lucs of the production elasticities of the three inputs, returns to scak and the annual change in production due ro technical change arc listed, all ev;1luarcd ,H the sampk mcans.9 Most of the production elasticities have the expected positive signs. The production elasticity for labour is 0.1 172 and for raw materials is 0.9326. The only exception is the capital elasticity which rakc:s rhc value of -0.0075, which is not significantly different from zero ar tbc 5 per cent significance levcl.10 The estimated scale elasticity of 1 .08 indicates a mildly increasing return to scale. hn.1lly the last figure in Table l 2A.3 denotes that the industry has experienced a r,ltc of technical progress over rhc sample period of 0.81 per cent per year.
Now turning our attention to the paralllctcrs associated with the incfl'i ciency error term U;,, namely y, JI and T) listed towards the bottom of the second colullln in Table 12.3, we sec that all with r-ratios brgcr than 1 .96 in absolute value arc statistically significant. These significant r-ratios arc nor surprising, given the conclmions of the likelihood ratio test lllcntioncd earlier. While validating the conclusions reached from the non-sroclrnstir non-parametric methodology, a parameter which is of p.1rricular interest' is 17. Since the estimated value of 17 (-0.01 S) is negative and signilicrnt, this indi c.ncs that technical efficiency in the Turkish manufacturing industry decreases at an increasing rate. Then, one can easily conclude that both non-parametric non-stochastic and stochastic production frontier models arc in coherence in showing that the rcchnic.11 efficiency is in a declining trend in the Tu1·kish m.rnufacturing industry.
To show rhc association between the efficiency estimates of the non-par.1-mctric non-stochastic methodology .1nd the tilllc-varying efti<.:icncy lllodcl, the cfticicncy rankings obtained from alternative models .ire co Ill pared. for
'l11c piiblic m,rnufiictztrinlf ind11str_y in 'Ji,rllcy 285 the rime-varying dfo.:icrn.;y model, given rhc specification of truncated normal distribution of the error term n:hiting to inefficiency, technical effi ciencies of each subscctor arc estimated using a panel variant of Jondrow et til.'s (1982) formula for all the years between 1974 and 1991. Then, Spearman 's Rank Correlation of the efficiency scores derived from non-para metric non-stochastic model and timc-v.uying efficiency model arc computed and reported in Table 12.4. A conclusion that emerges from rank correlations is that both methods arc nor only in coherence in showing the general trends bur arc also in agreement while ranking individual efficiency scores of ditkrenr subsectors.1 1
The technical efficiency cffocr model is specifically formulated to incor porate the factors that influence the cfficic m:y of the producing units and to test their significance. In this study the emphasis is on the efficiency effect of ownership structure in Turkish manufacturing industry. A dummy variable is introduced (whid1 rakes the value of l if the production rakes place at the srare-opcratcd enterprises and ;r,cro othcrwisc) as a subscctor specific variable in an attempt to idcntity thc difforcnccs in predicted efficiencies between the subsccrors of the manufacturing industry and the results arc rcportcd in the second column in Table 12.3. 12
This model specification, as described in the model section, permits certain sector spccitic factors to shift the me.in of the tcchnic.11 inefficiency error term U;,. l:or example the negative (and significant) sign of the coefficient related to rht· dummy variable (d1� -0.0933) whicl, represents stare production, indican:s that the change in rhc ownership from private to state production will result in a decrease in the value of technical inefficiency dkcr and hence an incrc;1se in rcchnical efficiency. However, a test of null hyporhcsis '{ = d0 = d1 = 0 if failed to be rejected would mean that stochastic production function is nor statistically different from an avcrage response function where U;, is omitted. Thus a test of hypothesis that '{ = d0 = d1 = 0 is conduercd and the likelihood ratio test statistic is calculated to be 0.6423 which is less than rhc x� critical value of 9.49. This means that all the observations arc equally effi cient and the deviations from the average response function can only be attributed to random effects implying that government ownership docs not
'fob/,: /2.4 Spcannan's rank corn.:lation cocfticicnts '/ 1wc-11nryin.[J N1m-p,1,-a111ctric 111m·stiich11stic 11111dcl
cjficic11cy model Vm·i,iblc rct11rm t11 scale Cm1st1111t rct111·1ts tt> sctilc
1977
1986
/991
1977 0.614
1986 0.661
1991 0.614
Note: all values an: signific.uir .1r rhc 0.05 level. Source: aurhors' compur.uions.
1977
1986
1991
0.5290.636
286 Osm,m 7.nim nnd Fatnui Tnsl,in
<:ontribute ro ineffi,kn<:y on the average. Note further that this <:onclusio11 is also <:onsistcnt with the findings obtained from the non-stochasti<: non-para mctri<: methodology where almost equal eftkicncy scores arc obtained for both ownership sizes when averaged over time.
Conclusion
This study by using stochastic and non-srrn.:hastic non-par.rn1ctric t<.:<.:hniqucs of production frontier litcr.nurc focused on issues such as how efficiency in the m.rnufacturing sector changes in time and if public and private enterprises show different performances in their pursuit of cftkicrn:y. A non-parametric non-stocl1astic frontier methodology employed led to tl1c condusio'n that tcchnirnl efficiency in the Turkish manufacturing sector is in a dcdining trend and that public and private enterprises, by differing in efti<:icncy levels before and after 1982, averaged around the s.1mc efti.ciency level over the entire .
sampling period. This empirical result is re-examined by stochastic spcdtka tions, namely by time-varying efticicn<:y model and cffidcncy cftccts model. The conclusion from the time varying efficiency model is that the tedrnical cftkiency of the Turkish manufacturing industry decreases at an increasing rate. However, the impact of government ownership on the average efficiency
-tevcl is not found statistically significant in the technical efficiency effects model, mainly because of the relative poor performance of the private sector prior to 1982 which was compensated for in the years following when the private sc<:tor performance was superior relative to the public sector.
Notes
We wish to rlrnnk the editor and the p.1rrn:1pa11ts of the ERr worikshop on 'The Changing Size and Role of the St:ll'c-Owned Enterprise Sector' held at Amman, Jordan, M.iy 1996 for their helpful co111111e11ts ,111d suggestions.
The policies ensued c:1rried typical clemenrs, such ;is ovuvalued exchange rare under ;i system of stricr exch;inge r;ire comrol, strict import controls through rar ifts, tJll,llHitative restrictions, gu,uamee deposits on imports ,1nd gcnerous tax and credir incemives for manufacturing invesrmems.
2 Large m,111ufacturing industry covers all establishments in the public secror and esrnblishmenrs with ten or more employees engaged in the private sector.
3 Compared ro these studies our approach is appn:ciably less restrictive in th.: s.:nsc that we neith.:r use ,1 tightly-specified functional form such as Cohb-Douglass nor l<m:e marched industries from another .:ountry to share the s,1111c common pro· ducrion frontier. furthermore, the alternative sm1tegy of estimating production frontiers separately for each subscctor using micro level data, tlmt is, firm d.ita, would have made within industry-comparisons possibk at the expense of inrer industq• comparisons. In this e,1se this ,1pproach would sufti.:r from the s,1me shortcomings of the Total Factor Productivity approach where cach indusrry is evaluated ;1<.:cording to its own perfonn:111ce in the past without al.lowing for imer industry comparisons.
4 No );\OVernment activity exists in the following sectors: manufacture of products of leather and learher substirnres ISIC:(323), manufacture of furniture and fixtures
The public manufacttffing industry i1i Tiirflcy
287
1SIC(332), manufocrure of rubber products 1SIC(355), manufacrure of plastic: prodm:ts not elsewhere dassified 1SIC(356), nwnufocrure of gl:lss .111d glass prod· ucts ISIC(362), m.111ufacrnrc of professional and scientific equipment not elsewhere classified 1SIC(385). Also, in our darn set, no private activity exists forpetroleum rdinerics 1SIC(353). This provides :i balanced panel data with forty· nine observ;1tions for each year.
S All 11ollli11;1I figures arc detl.m:d using two-digit manufanuring price index anJ arc expressed in 1988 pri<.:cs.
6 Since there is no price index for pun.:hased inputs, nomin,11 values arc deflated by
two-digit manufocrnring price index.
7 The mc:illations around the trend may be parrly due to deflating both inputs and outputs by the same two-digit manufacturing price index. ror example, the sharp drop in cftic:icn<.:y from 1984 to 1985 seems to be the result of deflating inputs
(especially imported raw materials) with ,1 pri<.:c dcthror which underscores the efli:cr of real currency depredation that exist during that period. Since this will ovcrstan: the real <.:osl of raw lllatcri:ds, it will refle<.:t itself as im:rea!'.ed ineftkicncy in our indexes. Also, one should note that the declining trend in thc levels of tc<.:h · nical cffo:icncy docs not necessarily illlply a declining trend in productivity growth. Ncvcrrheless, it will have a d:impening cffoct on the productivity growth that stems from technological progress. We thank Professor Merih Ccbsun who brought these points to our attention.
8 Geometric average of efficiency scores :icross all the years arc 0.67 for the private st:ctor and 0.68 for the public st:ctor for the variable returns to scale case. The con· st,un returns to scale frontier resulted in an almost equal cfl-kicncy score of 0.55 for both ownc.:rship types.
9 I n empirical srndics it is common to express variables as deviations :1round their means bccaus.:: of the convenience it provides in obtaining output clasticiti.::s at the mean level ofinpms. In estimating the parameters of the translog production fron tier we also adopted such a strategy. Hcn<.:c
/3
1 +/3
wt for cx;rn1plc directly provides
Jabour elasticity.10 This may h:1vc stemmed from using total capacity of power equipment installed as a proxy for the capital stock. During a period where energy prices arc increasing, rhc energy-saving policies adopted by firms may have caused a low variation in power equipment installed in the time component of the panel dat:i.
1 1 To giv.:: an example, both the time-varying efficiency model and the CRS non-sro· chastic non-parametric model arc in <.:ohcn.:ncc in depicting nine subscctors out of most successful tiftccn .subscctors <.:<>nsistcntly in 1974. The sccmrs which arc found among the most efficient fifteen subsc<.:tors by both models in 1974 arc: pri· v:Hc m.111ufacrnn: of basic industrial chemicals (!SIC 351 ), private manufacture of other chemical products (!SIC 352), private manufacture of perroleulll and coal derivatives (ISIC:,354 ), both public :rnd private manufacture of portcry china and earth ware (!SIC, 361 ), public beverage industries, (ISIC 3 1 3 ), pltblic tobacco manufactures (!SIC, 314), public pctrokum refineries (!SIC 353) and public iron and steel basic industries (!SIC 371 ). A very similar ranking :1pplks for the year I 991. ror the y.:ar 1991 both models arc in compktt: agreement in depicting ten out of fifteen most successful sectors. All subscctors that arc listed as the most suc· c.:cssful scc.:rors in l 974 arc also found among the most su<.:ccssful sectors in 1991 with the exception of public iron ,111d steel basic.: industries (!SIC 371 ). However private beverage industries ( ISIC 313) and private manufacture of electrical machinery appararns (ISIC 383) :m: included among the su<.:ccssfol s.:ctors by both models.
12 The maximum likelihood cstimatt:s of the stochastic production fro1nicr have been
tested for all possible structural restrictions ;1nd the translog form with the non
288 Osman ;,:,iim and Fatnui 'f'asflin
Appendix
'J'n.b/,: I 2A. I I ksniption of lnternation;1I Standard lndt1stri,1I Classitkarion codes
3 1 1 l'ood m.11wf:u:turing
3 1 2 Manufacrun: of food producrs not elsewhere classilicd 3 1 3 Beverage indusrries
3 1 4 Tobacco m;rnufactures 321 Manufanure of texrilcs
322 Manufacture of wearing apparel (except footwcar)
323 Manufac:turc of lcarhcr and lc,uhcr produc:ts ( except foorwe.1r and
wearing apparel)
324 Manufacrure of footwear
331 Manufacllm: of products im:luding, furniture
332 M,1nufat:tme of h1rniture and tixrures
341 Manufac:turc of paper and paper products 342 Priming, publishing and allied industries 351 Manufac:rure of basic industrial d1emic:1ls 352 Manufauure of other chemirnl produt:ts 353 l'etrolct1111 rcfinerics
354 Manufacture of petroleum and coal derivatives 355 Manufacture of rubber products
356 Manufacture of plasric products nor elsewhere classified 361 Manufacture of porrcry chin., and e,1rrhware
362 Manufacture of gl:1ss and gl.1ss products
369 Manufacmre of other non-metallic: mineral products 371 Iron and stec.:l basic: industries
372 Non-ferrous mc.:tal basic industries
381 Manufacture of fabri<.:ared mc.:tal products
382 Manufacture.: of machinery ( c.:xc:c.:pt electrical)
383 Manufacture of electrical mad1inc.:ry apparatus, appliam:c.:s and supplics
384 Manufacture of trnnsporr equipmc.:m
385 M,111ufacturc of professional ,111d sci<.:mifk and measuring .rnd comrolling equipmenr not clsewhcrc classified
'Iii!,/,: I 2A.2 Hypothesis tests on timc.:-varying cffkiellc)' model
/l,:strictiou Mad,:l
/.,,.,,.
x2
Critiml I Ji:ci.ric111 /i/1diho11d 11,i/11,: (5%)None rrnnslog 325.76
/J11F/J11=/J12= 0 tr,111slog 315.26 2 1 .00 7.81 R.ejc.:<.:r H0
(hicks-neutral)
/J11r/J 11�/Ju� translog 292.70 66.12 1 1 .07 Rejeu /-/11
/3
1.143,.,�
o
(110-tcd1. chwg.:)/J.r/3
.s=/J
(,�
Cobb-Douglas 265.35 120.82 18.31 Rc.:jc.:cr H11/J
UF/J
IIa/J
11�/Ju�/J,.,� 0
,-f.1=1/= () translog 76.95 497.62 7.81 Reject Ha (01.S) Jl=r,-0 320.04 1 1 .44 5.99 Rc.:j.:.:t H11 p::.<) 323. 1 5 5.22 3.84 Rc.:je<.:r H0 11=0 322.54 6.44 3.84 Reje<.:r H11The p11blic man11fact1trin_11 industry in 'for/1cy 289
'f'ri[J/c J
2A.3
Key estimates derived from time-v,wying dfo.:iency model1 ),:scripti1m Labour ebsridty Capital elasticity lbw material elasticity Returns ro scale Teehnic;al diange Estimate 0.1 172 (0.0214) -0.0075 (0.0 1 1 6) 0.9329 (0.0166) 1.08 0.008 I Note: numbers in parentheses arc smndard errors. Soun.:..:: authors' <:sri1natcs.
Bibliography
Afriat, S. N. ( 1972) 'Etfo:ieney estimation of produc;tion func:tions', l11ten11iti111111l
EcoHomic ReJ1ie1JJ, vol. 13: 568-98.
Aigner D. J ., Lovell, C. A. K. and Sc:hmidt, P. J. 1977. 'rormuhuion and estimation of stochastic; produc:tion func;tion mmkls', Jo11m11J ,f Jico1111111etrics, vol. 6: 21-37. Alc;hi,rn, A. A. ( I 965) 'Some ec;onomic;s of property rights', Ill l'olitico, vol. 30: 8 1 6 - 29. Battese, G. E. :ind Coelli, T. J. ( 1992) 'Frontier production functions, technical cftic.:ienc;y and panel data: with an application ro paddyformers in India', Jo11mnl ,f l'rod11ctiJ1ity A1111�vsis, vol. 3: 1 5 3 -59.
- - ( 1995) 'A model for technical inefficiency efti.:cts in :1 stoc;hastic frontier produc:tion hmction for p,rncl data', ftupiricnl Ec1111m11ics, vol. 20: 325- 32.
C.wcs, R. E. 1992) 'lkterminants of n:drnic;,,I dliciem:y in Australia', in R. E. Caves ( ed.), b11lustri11l lijjicimcy i11 Six Nntiom, Cambridge, Mass.: MIT Press: 241 - 71 ). C:elastm, M ( 1994) 'Trade and industrialization in Turkey: initial conditions, policy and
performanc.:e in the 1980s', in G. K. Hcllcinc;r ( ed.), 'frnd.: 1'11/ic.1< 111111 Ind11stril1.liz11ti1111 i11 ·1;1,·b1i/e11t Ti111cs, London and New York: Routledge: 453-84.
Cornwell, C., Schmidt, P. and Sickles, R. C. ( 1990) 'Produc.:tion frontiers with cross-section:11 and time-series variation in eflicienc.:y level', J1111m11l
,!f'
l!.cm111111etrics, vol. 46: l 8 :i -200. Domberger, S. and Piggon, J. ( 1986) 'l'rivatiz.irion policies and public emerprise: asurvey', Eco1111111ic Record, vol. 62: I 4:i-62.
Fare, R., Grosskopt� S., Norris, M. and Zhang, Z. ( 1994) 'l'roduc;tiviry growth, rcc.:hnic.:al progress and cftic.:icnc;y c;h,rngc in industrialized c;ounrries', A 111erica11 r.c11n1mtic ReJJiL-11', vol. 84: 66-83.
Farrell, M. J. ( l 9S7) 'The measmement of productive eftic:ic.:nc;y', f 011n1t1! ,f 1/J,: no_w,L St11tistics Society, vol. A I , no. 2:i: 258 - 8 1 .
Farrell, M . J . and Vieldhouse, M. ( 1962) 'Estimating efticient produc.:tio11 foncrion under non-inneasing returns ro scale', J1111mnl ,f the l{oynl Statistical Soci,:t_'Y, vol. A 12:i: 2 S 2 -67.
<_;recne, W. H. ( 1993) 'The ec;onomctric.: approac.:h ro cfticicnc.:y :malysis', in H. 0. rried, C. A. K. L ovell and S. S. Schmidt (eds), '/7Je Me11sure111i:11t ,f J>r11d11ctfre rJ-)1cie11cy: 'frc/111iq11,:s t1111i Applicnti,ms, Oxford: Oxford University Press: 68-119.
Jondrow, J., l.ovell, C. A. K., Matcrov, I. S. and Sc.:hmidt, I'. (1982) 'On estimation of technic::11 efticiency in the sto..:hasric; produc.:tion function model', Jomwrl ,f Ec111111111i:trics, vol. 9: 279-86.
290
Osman Zaim and Fatma 'fas/tin
Krueger, A. 0. and Tum:er, ll. ( 1982) '(.irowrh of factor productivity in Turkish manu l\1cruri11g industries', }1mn111l of /)cJ1d11pmmt fa111111mics, vol. 1 1 :
307- 25.
Kumbhakar, S. C. ( 1990) 'Production frontiers, panel data and ti111c-varying rcd111ical cflicicncy', J11ur1111l oj' fao1111111ctrics, vol. 46: 201-1 I .
I.cc, Y. 1 1. and Sd1111idt, I'. ( 1 993) 'A producrio11 fro11ticr model with tlcxililc re111por;1) variation in technical cffidc11cy', in H. 0. Fried, C. A. K. Lovell and S. S. Schmidt (eds), '/11,: Mcns1/1'c111,:11t of l'r11d11Cf.il1,: lij]icicm::v, New York: Oxford University Pn:ss:
237-55.
Meeuse11, W. and v:111 den Brocck, J. ( 1977) 'Efticie11cy estima1io11 from Cobb-Douglass prodm:rion fum:rions wirh co111posed error', lut·.·nmti1111nl lic111111111ic }{,:1,ic11,, vol. 18:
435-44.
Nishimuzu, M. and Robinson, S. ( 1984) 'Trade policies and producrivity d1.111gc in semi industrialized rnumries', }1111mnl oj'DcJJclapmmt l:cmwmics, vol. I : 1 7 7 -206. Pirr, M. M. and I.cc, L.
r.
(198 1 ) 'Measuremem ;111d sources ofredrnical eflicicncy inthe lndoncsi,lll weaving i11dustry', }1111n111l of JJ,:11cl11pmwt l:conomics, vol. 9: 43-64. Seitz, W. D. ( 1970) 'The 111casurcment of cftkicn<.:y relative to a fronrier prndunion
fu11<.:tion', A111erimn Jrmmal 1f A11rirnlt11ral Ecmw111ics, vol. 9: 43-64.
Shephard, R. W. ( 1970) Theory of Cost a11d l'rod11ctio11 Frmctiom, Princeton, N.J.: l'rinceton University Press.
State Institute of Statistics ( 1974 -1991) Amm11l MamfncwrinJJ fodmtry Statistics (various issues), Turkish Republic Prime Ministry.
Srntc Pla1111i11g Organii:ttion Mai11 Hcm111mic lndicntors: '/i1rllcy, (various issues), Turkish
Republic Prime Ministry.
Torri A. and ( :aves, R. E. ( 1992) 'Tech11il:al cftkiency in Jap:111cse and US manufaeturing industries', in R. E. Caves (ed.), llldustrirrl PJ]icic11c_y in Six Nati,ms, Cambridge, M:1ss.: MI'l' Press: 31-1 19.
Uygur, E. ( 1990) 'Policy, productivity growth and employment in Turkey, 1960-89', MIES 90/4, Geneva: lmcrnational IA1bm1r Otfo.:e.
Yildirim, E. ( 1989) 'Total factor productivit)' growth in Turkish ma11ufa<.:turing industry between 1963-1983: an analysis',