INVESTIGATING THE QUALITY OF DURUM WHEAT
LANDRACES AND DETERMINATION OF PARENTS TO USE IN
BREEDING PROGRAMS
KENDAL,E.1*–E REN,A.1–DOĞAN,Y.1–O RAL,E.2–K OYUNCU,M.3 1Department of Seed Production, Kiziltepe Vocational Training High School, Mardin Artuklu University, 21500 Kızıltepe, Mardin, Turkey
2
Department of Field Crops, Faculty of Agriculture, Van Yüzüncü Yıl University, Van, Turkey 3
Department Engineering of Food, Karamanoğlu Mehmetbey University, Karaman, Turkey *Corresponding author
e-mail: [email protected] (Received 15th Feb 2019; accepted 21st Mar 2019)
Abstract. The study was conducted to evaluate the quality of durum wheat grain. For this reason, genetic
resources are crucial for the identification of parents and the enrichment of the gene pool that can be used in the development of new varieties for better nutrition of people. For this purpose, 131 populations of landraces, 9 promising line and 5 new varieties were used. The experiment was set up in randomized blocks with 7 replications, according to the augmented (increased) experimental design in 2015-2016 growing season. In the study, we examined total nitrogen content, protein ratio, CIE (Commission Internationale Eclairage) wheat color analysis (L* brightness, b* jaundice, a* redness) of 145 genotypes of durum wheat seeds. According to analysis of variance, highly significant differences (P < 0.05 or P < 0.01) were determined for total nitrogen, protein content and CIE L* value, while differences were not significant for b* value and a* value. The superiority of the genotypes was determined by the first two principal components (IPC1 (principle component) and IPC2) in order to create a two-dimensional GT biplot. The sum squares of the first two components were accounted by 45.34% (PC1) and 40.03% (PC2) for genotypes. The GT (genotype x trait) biplot indicated that 9 (nine) sectors occurred among genotypes and quality parameters. On the other hand, three groups occurred among the quality parameters based on the genotypes. The scatter plot demonstrated that there is a high correlation between b* jaundice, and a* redness. The results showed that cultivars and more landraces have general adaptability for all quality parameters, while some genotypes (G79, G78), (G22, G102), (G3) and (G121, G5) showed specific adaptation for N (nitrogen), PC (protein content) and L*, a* and b* values, respectively. According to the biplot techniques, G36 came forward with the N, P and a* value and desirable landraces, G5 for b* value, G30 stable line for all quality parameters, while (G128, G61) and the majority of promising lines (L4, L6) did not come forward with any quality parameters. The results of the study indicated that the majority of landraces can be used as parents to improve the quality of durum wheat varieties. The study indicated that GT biplot can be used to evaluate the genotypes graphically to select the best genotypes for parents to use in breeding programs.
Keywords: GT biplot, quality parameters, Southeastern Anatolia, Turkey
Introduction
Global biodiversity and plant genetic diversity compose of the genetic resources which are crucial for the identification of parents and the enrichment of the gene pool that can be used in the development of new varieties for better nutrition of people. For this reason, landraces are very important as genetic resources for identity of parents to improve gene pool and develop new quality varieties for better people's health. Nowadays, quality of durum wheat is most substantial for healthy fed in Middle East countries, because majority of people are fed from durum wheat product (bulghur,
macaroni, bread). Therefore, landraces are considerable for breeding program of durum wheat, because most people care to use the healthy-products (bulghur, macaroni, and bread) of wheat. Upon domestication, it was estimated that initial diversity was reduced by 84% in durum wheat (Jaradat, 2013).
Turkey is located at a unique position from the view point of plant genetic diversity. Due to both in terms of environmental conditions and in terms of culture is very suitable for wheat cultivation. Turkey is one of the Centers of Origin of wheat and wheat has been grown around 8.5 million ha with production of around 20 million tons annually (http://www.tuik.gov.tr/PreHaberBultenleri.do?id; Karaman, 2019). The total 50% of durum wheat is produced in Southeastern Anatolia region where is center (Karacadag) origin of durum wheat. Southeastern Anatolia region follows the Southeastern Taurus Mountains and the valley of the Tigris River. Frequency of durum wheat exceeds 60%, with a high diversity of morph types dominated by murkiness (Morgounov et al., 2016).
The nutrient content of wheat grain can vary from genetic resources (landraces population, wild wheat, the orjin of cultivars) to regions and continents. Domestication and deep selecting in breeding progression significantly influenced to the depletion of nutritional content and in minimizing the genetic diversity of crops. An analysis of the nutritional value, especially micronutrients in the CIMMYT (International Maize and Wheat Improvement Center)-developed germplasm displayed that a declining trend in the micronutrient levels of the varieties (Velu et al., 2014; Pandey et al., 2016).
Nowadays, over three billion people suffer from “malnutrition”, a locution used to define shortage of micronutrients (FAO, 2013). At the present time, nutrient shortcoming is a problem both common in developing countries, but extensive in developed countries where diet is mainly dependent on cereals. Therefore, the durum wheat program need to progressive revelation studies of nutritional in breeding. Throughout the last century, the input of high-yielding cultivars, led to the loss of genetic diversity. Wheat landraces are comprised of complex, variable, genetically dynamic and diverse populations, for both biotic, abiotic stresses in their environment and micro-macronutrient.
On the other hand, durum wheat breeding programs should have focuses on the develop of new varieties for high quality which are important for modern pasta and bulgur industry, because of changing consumption habits and undernourishment places where this is based on durum wheat. To achieve this goal, durum wheat landraces keeps its importance inside genetic diversity in Middle east and Southeastern Anatolia region. Because local durum wheat populations have adequate quality characteristics (nitrogen content, protein ratio, wheat color analysis (L* brightness, b* jaundice, a* redness) for the development of new varieties that can be used in the pasta and bulgur industries. For this reason, durum wheat breeders have recently given more importance to the durum wheat landraces in order to raise the quality criteria in durum wheat.
Among quality criteria seed quality is one of the important factor effecting plant growth, yield and nutrient uptake by the plants. For a good and healthy growing start seed quality is important. Seed quality is one of the best criteria for cereal productions and qualified seeds led to about 25 to 40 percent yield increase. During the early stage, plants meet their nutrient and energy demand from the reserves in their seeds mostly. So, huge nutrient stocks in the seeds are vitally important for plants to be able to survive their growth healthy (Erdal et al., 2017).
The aims of the present study were to assess the importance of the local durum of wheat landraces that are about to disappear in nature and constitute the source of the
gene for durum wheat in terms of quality criteria to determine the parents which can be used in durum wheat breeding programs.
Materials and methods
Plant material and experimental arrangement
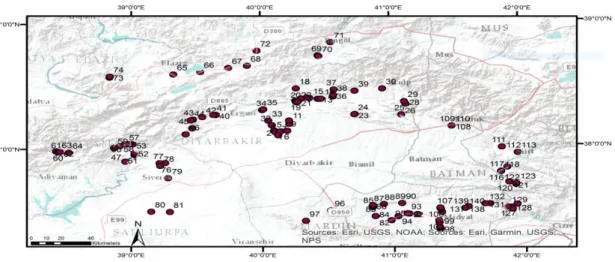
The study was conducted using a total of 131 populations of landraces; 9 promising landraces and 5 new varieties were used. The populations of landraces were collected from Southeastern Anatolia region of Turkey where is centers for origin of durum wheat. The cultivars are used registered by International Agricultural Research and Training Center during last decades. The varieties used in the study both have good quality criteria and very common cultivating in this region. The coordinate data of the used genotypes indicated in Table 1. The meteorological data showed in Figure 1. The map to overview of the areas of collected landraces of durum wheat presented in
Figure 2.
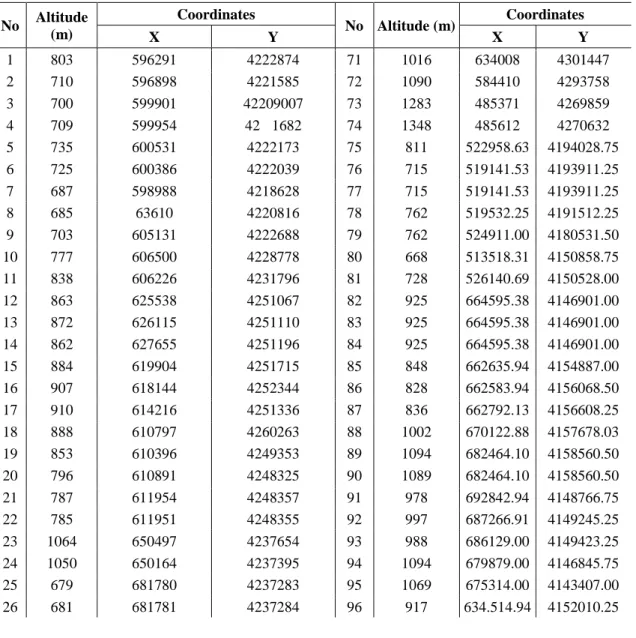
Table 1. The coordinate of landraces which collected places Shout Eastern of Anatolia
No Altitude (m) Coordinates No Altitude (m) Coordinates X Y X Y 1 803 596291 4222874 71 1016 634008 4301447 2 710 596898 4221585 72 1090 584410 4293758 3 700 599901 42209007 73 1283 485371 4269859 4 709 599954 42 1682 74 1348 485612 4270632 5 735 600531 4222173 75 811 522958.63 4194028.75 6 725 600386 4222039 76 715 519141.53 4193911.25 7 687 598988 4218628 77 715 519141.53 4193911.25 8 685 63610 4220816 78 762 519532.25 4191512.25 9 703 605131 4222688 79 762 524911.00 4180531.50 10 777 606500 4228778 80 668 513518.31 4150858.75 11 838 606226 4231796 81 728 526140.69 4150528.00 12 863 625538 4251067 82 925 664595.38 4146901.00 13 872 626115 4251110 83 925 664595.38 4146901.00 14 862 627655 4251196 84 925 664595.38 4146901.00 15 884 619904 4251715 85 848 662635.94 4154887.00 16 907 618144 4252344 86 828 662583.94 4156068.50 17 910 614216 4251336 87 836 662792.13 4156608.25 18 888 610797 4260263 88 1002 670122.88 4157678.03 19 853 610396 4249353 89 1094 682464.10 4158560.50 20 796 610891 4248325 90 1089 682464.10 4158560.50 21 787 611954 4248357 91 978 692842.94 4148766.75 22 785 611951 4248355 92 997 687266.91 4149245.25 23 1064 650497 4237654 93 988 686129.00 4149423.25 24 1050 650164 4237395 94 1094 679879.00 4146845.75 25 679 681780 4237283 95 1069 675314.00 4143407.00 26 681 681781 4237284 96 917 634.514.94 4152010.25
27 895 68456 4266685 97 1041 617647.80 4142738.75 28 895 684652 4246867 98 950 708362.06 4135393.00 29 897 683593 4249088 99 911 708190.01 4136542.20 30 853 668840 4260416 100 882 708019.88 4137244.75 31 786 594207 422878 101 921 707595.06 4141429.25 32 837 594634 42275550 102 934 707360.75 4143376.50 33 931 592344 4231601 103 965 70935.75 4150709.25 34 873 588191 4241045.50 104 986 708496.50 4153507.00 35 812 588895 4241660 105 990 708098.13 4154453.25 36 865 635665 4253198.50 106 986 708146.00 4154610.50 37 1025 636301 4259395 107 986 708146.00 4154610.50 38 890 636017 4254531.50 108 723 715642.15 4227401.15 39 876 650340.75 4258239.50 109 723 715642.15 4227401.15 40 978 556997.56 4236808.00 110 573 Unknown Unknown 41 1032 555252.81 4236790.50 111 628 749524.25 4208746.00 42 814 547904.19 4234858.50 112 970 760148.05 4204095.09 43 862 541615.56 4232495.50 113 970 760148.05 4204095.09 44 884 540057.13 4231857.50 114 496 753207.81 4191005.25 45 677 541118.75 4224902.50 115 496 753207.81 4191005.25 46 723 536671.00 4219466.00 116 462 749122.01 4187300.25 47 729 496012 4195229 117 462 749122.01 4187300.25 48 828 502219.75 4201199.50 118 461 748892.38 4186918.01 49 805 502337.59 4201143.50 119 542 747895.05 4878340.50 50 805 502337 4201143.50 120 723 754523.31 4177849.50 51 755 502776.56 4202023.50 121 723 754523.31 4177849.50 52 722 502318.59 4202746.00 122 787 759218.71 4175591.72 53 1045 500979.00 4210611.50 123 841 759326.81 4176481.75 54 925 498985.97 4210780.00 124 1003 239151.64 4170548.75 55 1025 496297.66 4210493.50 125 1202 244929.83 4173425.00 56 1032 496144.84 4210521.50 126 875 760055.31 415805.50 57 1032 496144.84 421052.50 127 1005 756303.63 4155465.75 58 1077 492395.16 4209038 128 792 756828.00 4153671.25 59 890 488445.31 4207384.00 129 730 753644.69 415549.00 60 819 449332.03 4204385.00 130 883 741775.94 4158370.25 61 835 450771.00 4203501.50 131 896 738389.38 4158352.50 62 858 452118.34 4203644.00 132 896 738389.38 4158352.50 63 858 452118.34 4203644.00 133 978 727246.69 4155708.75 64 893 458033 4203095 134 978 727246.69 4155708.75 65 867 528384 4272667 135 978 727246.69 4155708.75 66 862 546436 4274936 136 978 727246.69 4155708.75 67 857 565288 4278407 137 978 727246.69 4155708.75 68 1031 577881 4280381 138 951 724918.13 4154284.00 69 1095 625437 4289576 139 951 724918.13 4154284.00 70 1164 625998 4288948 140 951 724918.13 4154284.00 Checks: 1-Artuklu, 2-Hasanbey, 3-Hasanbey, 4-Şahinbey, 5-Zühre. All control varieties released from GAP International Research and Training Center
Figure 1. The values of meteorological data of 2015-16 season and average of long term in
research area
Figure 2. The map to overview of the areas of collected landraces of durum wheat used in the
research
The experiment was set up in randomized blocks with 7 replications, according to the augmented (increased) experimental design in Diyarbakır conditions in 2015-2016 growing season. The seeding rates were 450 seeds m-2. Plot size was 0.4 m2 (20 cm × 1 m) consisting of 2 rows spaced 20 cm apart. Sowings were made by hands. The fertilization rates for all plots were 60 kg N ha-1 and 60 kg P ha-1 with sowing time and 60 kg N ha-1 was applied to plots at the early stem elongation. Harvests were made using Hege 140 harvester.
In the study, we examined total nitrogen content, protein ratio, wheat color analysis (L* brightness, b* jaundice, a* redness) of 145 genotypes of durum wheat seeds. All analysis was done in the lab of Department Enginering Food of Karamanoğlu Mehmetbey University.
Total nitrogen content (N%)
Data were recorded for grain protein content. It was estimated from a random sample of 100 gm of hand-threshed seeds of each genotype per samples. The seeds were milled and total Nitrogen percent (N%) was determined by Kjeldahl method as described in the manual by Sertsu and Bakele (2000).
Total protein content (%)
Data were recorded for grain protein content. It was estimated from a random sample of 100 gm of hand-threshed seeds of each genotype per samples. The seeds were milled and total Nitrogen percent (N%) was determined by Total nitrogen (N) contents of the samples were measured using a nitrogen analyzer (Velp Scientifica, Dumas Nitrogen Analyzer - NDA 701, Italy) running on a Dumas incineration method (AACC Method 46-30) and protein contents calculated using a 5.7 nitrogen-protein conversion factor AACC, 2000). There is a linear relationship between protein ratio and total nitrogen (Nuttall et al., 2017).
L*, a* and b* color
Wheat samples of 300-g grain portions were cleaned and tempered overnight to 16.5% moisture and milled on a QC-109 laboratory mill into semolina as described by Petrova (1993). L* and color (a*, b*) values were measured (AACC Method 14-22) using Hunter colorimetric (Color Flex A60-1010-615, Hunter Lab, VA, USA) of samples ground using a 1 mm size sieve (AACC, 2000). Yellow pigment content of wheat, semolina and pasta disc was determined according to ICC method 152 as β-carotene from a standard curve. Semolina color was measured by the CIE 1976 (Commission Internationale de l’ Eclairage) L*a*b* color system. L* indicates lightness, a* represents redness, and b* represents yellowness of color. The colors of semolina and flours are expressed using the L* a* b* color system. L* is a measure of brightness, it can ranges from 0, completely non-reflective or black and 100, perfect white or total reflection. Bread wheat flours have reading values around 90, while semolina has lower values. The b* value is the blue-yellow chromaticity coordinate, it can go from -60, pure blue, to +60, pure yellow. Usual b* values for bread wheat flours are around 9.5. For semolina the higher the b* value the more yellowness. Good quality durum has a b* of approx. 27.3 or more. The b* value is the red-green coordinate.
Statistical analyses
The data obtained from the study related the investigated quality parameters were analyzed by using the JMP 5.0.1 statistical software package (SAS Institute, 2002), and the differences between means were compared using a least significant difference (LSD) test at the 0.05 probability level (Steel and Torrie, 1980). GT biplot analyses were carried out using GT biplot software to assess quality parameters (Yan and Thinker, 2006). In multi-traits (MT) for genotypes, biplots were constructed by plotting the first two principal components (PC1 and PC2) derived from centered quality criteria data to singular value separation. Also, with the GT biplot analysis graphs in the study: It was aimed at revealing relation among examined traits and genotypes means by scatter plot (Fig. 3), and grouped quality parameters and performance of each genotype at each trait (Fig. 4), which-won-where of sector analysis (Fig. 5), the stable and high
performance of genotypes quality parameters by ranking model (Fig. 6), compare the desirable genotypes to ideal center on parameters by comparison model (Fig. 7).
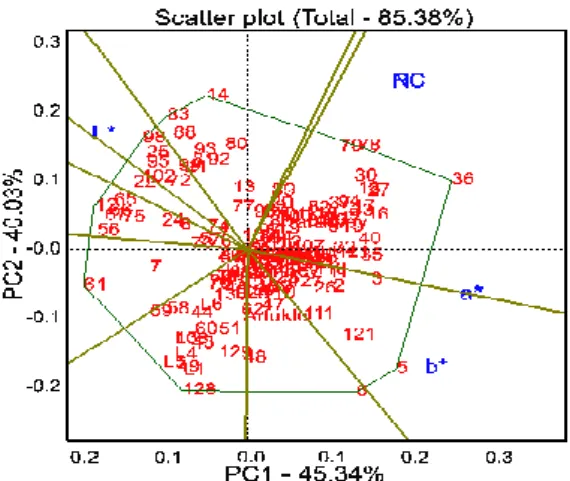
Figure 3. Relation among quality traits and genotypes. (PC: protein content, N: total nitrogen,
L*: brightness, a*: redness, b*: yellowness)
Figure 4. Sectors on genotypes and quality traits. (PC: protein content, N: total nitrogen, L*:
brightness, a*: redness, b*: yellowness)
Figure 5. Groups on genotypes and quality traits. (PC: protein content, N: total nitrogen, L*:
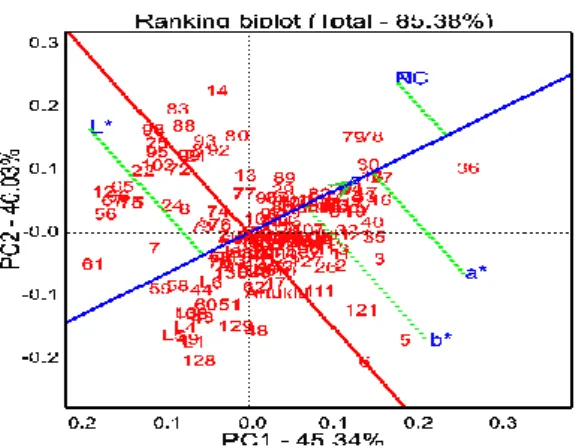
Figure 6. Ranking of genotypes on means of quality traits. (PC: protein content, N: total
nitrogen, L*: brightness, a*: redness, b*: yellowness)
Figure 7. Comparison of genotypes on means of quality traits. (PC: protein content, N: total
nitrogen, L*: brightness, a*: redness, b*: yellowness)
Results
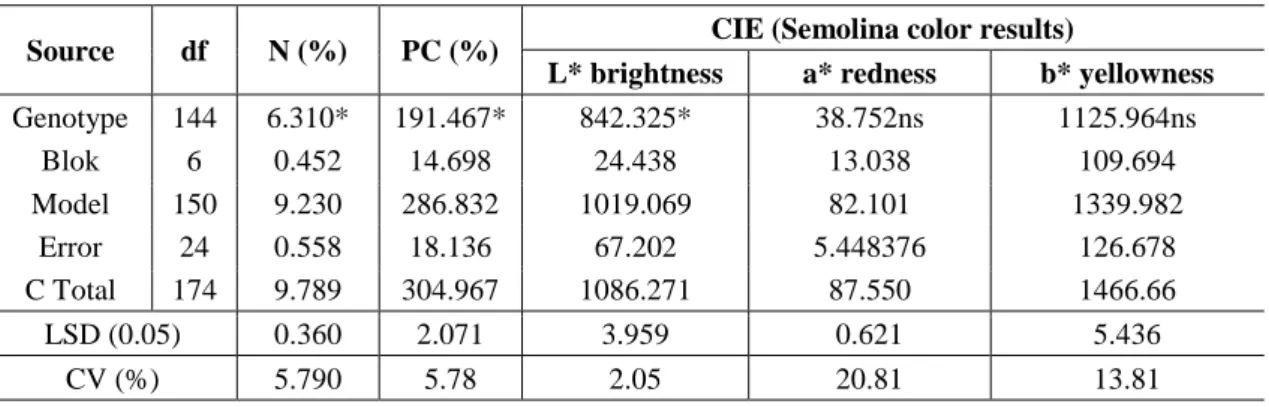
The analysis of augmented (increased) experimental design revealed highly significant differences among the 145 genotypes of durum wheat for total nitrogen percent (N %), protein content L*(lightness color of semolina) (p < 0.05), while it was not significant for a* (represents redness color of semolina) and b* (represents yellowness color of semolina), as shown in Table 2. Moreover, significant interactions among the tested genotypes indicated that the genotypes had difference genotypic structures in terms of examined quality parameters. Usually, the wheat breeders interested in the landraces with high genotypic main effect (high values than average) and with low fluctuation in examined parameters (stable). The results variance analysis of sum of squares of quality parameters showed in Table 2.
The results of the data reviewed
The total nitrogen (N) percent of genotypes ranged from 2.07% (G1) to 3.18% (G79) and the mean of total nitrogen percent of genotypes was found 2.65% (Table 4). The results of the total nitrogen percent indicated that 79 genotypes have higher values than the five standards used as the control in the study. On the other hand; Güneyyıldızı and
Zühre varieties were the best on total nitrogen percent of among standards which used in the study. The landraces which collected in same province of Southeastern Anatolia Region showed different performance on total nitrogen percent, but the landraces which collected in Diyarbakır city (Dicle, Hani and Lice province) and Siirt city (Eruh province) had good results of total nitrogen percent respectively. Moreover; the landraces (G59-G64) collected in Gerger province of Adıyaman city had low value of total nitrogen percent. The results of total nitrogen percent showed that Southeastern Anatolia Region of Turkey is one of the Centers of origin of durum wheat showed a unique position from the view point of genetic diversity of durum wheat by landraces. Therefore, it is possible to can select the best landraces which have the best results in the study to improve the total of nitrogen and enrich the gene pool and develop quality varieties.
Table 2. The variance analysis of sum of squares of quality parameters
Source df N (%) PC (%) CIE (Semolina color results)
L* brightness a* redness b* yellowness
Genotype 144 6.310* 191.467* 842.325* 38.752ns 1125.964ns Blok 6 0.452 14.698 24.438 13.038 109.694 Model 150 9.230 286.832 1019.069 82.101 1339.982 Error 24 0.558 18.136 67.202 5.448376 126.678 C Total 174 9.789 304.967 1086.271 87.550 1466.66 LSD (0.05) 0.360 2.071 3.959 0.621 5.436 CV (%) 5.790 5.78 2.05 20.81 13.81
LSD: least significant effect, CV: Coefficient of variation, d.f.: degree of freedom *: Value significant at 0.05 probability level, ns: not significant, N (%): total nitrogen, PC (%): Protein content
The protein content of 145 genotypes varied from 12.22% (G77) to 18.11% (G79)
and the average of the genotypes was found 15.14% and nearly 80 genotypes (all of them are landraces) had high value of protein content% (Table 3). The consequence of protein content showed that more than half of landraces have high protein content results than 5 varieties which used in the study as check. However, Güneyyıldızı and Zühre varieties were the best on protein content of among standards. These two varieties registries (2010) the last time in the region and they are used in farming area, because of high quality parameters. There was diversity on protein content among landraces which collected in same province, but the landraces showed good performance which collected in Şanlıurfa (Siverek) Diyarbakır city (Dicle, Hani and Lice province) and Siirt city (Eruh province) on protein content respectively. Moreover; the landraces (G61-G64) collected in Sincik province of Adıyaman city had low value of crude protein content. The outcome of protein content indicated that Centers of Origin of durum wheat (Southeastern Anatolia Region of Turkey) is one of the unique positions from the view point of genetic diversity of durum wheat by landraces. On the other hand the study showed that there is high and positive correlation (Fig. 3) between protein content and total nitrogen percent of genotypes. Range of protein contents defined in this study was in accordance to that reported by Simmonds (1989), reported that average protein content of durum wheat may vary from 9-18%. Matsuo and Irvine (1970) reported that wheat with 13% or higher protein content made a satisfactory
pasta, whereas a protein content lower than 11% gave a pasta with poor cooking quality. The results of our study showed that majority of landraces had high value of protein content that made a satisfactory pasta (= and >13%).
Table 3. The result of correlation analysis among quality parameters
N (T. Nitr.) P. content L* brightness a* redness
C
IE
L* brightness 0.13ns -0.25ns
a* redness 0.19* 0.17** -0.47**
b* yellowness -0.08ns -0.25ns -0.58** 0.69** **: Value significiant at 0.01, *: Value significant at 0.05 probability level, ns: not significant, N %: total nitrogen
L* value, brightness of semolina color of 145 genotypes ranged from 71.11 (G122)
to 89.12 (G13) and the average of the genotypes was found 81.29 value and nearly 30 landraces had high value on CIE L* brightness of semolina color than the best variety which used in the study as control% (Table 4). On the other hand, the results demonstrated that Güneyyıldızı and Zühre varieties were the best on L* brightness of semolina color of among standards. These two varieties released last time, because of high value L* brightness of semolina color. The results indicated that there is high diversity among local populations collected in the region. Especially, the landraces which collected in the Hani, Lice provinces which located the north of Diyarbakır city where consist of Karacadağ mountain which Centers of Origin of durum wheat were the best among genotypes with regard to L* semolina color. Furthermore, the first genotypes (landraces) which collected in around Diyarbakır city plain places and the genotypes which collected in Kulp province were very poor on L* semolina color. The result of study showed that there was high genetic heterogeneity among durum wheat landraces and it can be support to improve genetic pool for breeder of durum wheat.
a* value, redness of semolina color of 145 genotypes varied from 0.35 (G13) to 3.85
(G41) and the average of the genotypes was found 2.32 value. The results indicated that there is high negative correlation (-0.47**) between a* redness of semolina color and L* brightness of semolina color (Table 3 and Fig. 3).
b* value, yellowness of semolina color of 145 genotypes ranged from 6.76 (G13) to
22.13 (G6) and the average of the genotypes was found 16.44 value (Table 4). The results indicated that there is high negative correlation between b* and L* and high positive correlation between b* and a* semolina colors (Table 3 and Fig. 3).
Graphically the association between genotypes and quality parameters
Principal component analysis was used to show the distribution of genotypes based on quality traits. The two dimensional PCA score plot, derived from multi-traits and accounted for 85.38% (45.34% and 40.03% for PC1 and PC2, respectively) of the total variation (Figs. 3-7). The scatter plot showed that three groups were occurred among quality traits and genotypes showed a wide distribution on traits, and also it was showed high correlation between b* jaundice, a* redness (Fig. 3). The results showed that cultivars and more landraces have general adaptability for all quality parameters (Fig. 4), while some genotypes (79, 78, etc.), (22, 102, etc.), (3..) and 121, 5, etc.) showed specific adaptation for N, PC, L*, a* and b* respectively (Figs. 5 and 6).
According to the biplot techniques, G36 came forward with the N, P and a* and desirable landraces, G5 for b*, 30 stable line for all quality parameters, while (128, 61, etc.) and majority of promising lines (L4, L6) came not forward with any quality parameters (Fig. 7). The study indicated that GT biplot can be used to evaluate the genotypes as graphically to select the best genotypes for parents to use in breeding program (Oral, 2018).
Table 4. The rank and means of the quality parameters of durum wheat genotypes
Genotype Rank N (%) Rank PC (%) CIE (semolina color results) Rank L* Rank a* Rank b*
1 145 2.07 65 15.38 144 74.53 127 1.66 126 12.08 2 70 2.68 71 15.25 142 75.25 143 0.92 130 11.40 3 52 2.74 52 15.63 114 79.97 96 2.14 105 15.63 4 24 2.83 24 16.15 118 79.85 57 2.50 99 16.91 5 81 2.64 82 15.04 28 82.91 125 1.78 131 11.28 6 83 2.64 84 15.02 139 76.36 86 2.23 1 22.13 7 115 2.45 116 13.98 140 76.31 71 2.41 10 19.48 8 123 2.42 124 13.82 18 83.86 142 1.02 144 7.33 9 87 2.62 88 14.92 10 85.71 141 1.20 142 8.37 10 9 3.01 9 17.15 55 81.55 111 2.02 112 14.45 11 58 2.72 58 15.50 20 83.70 122 1.83 114 14.03 12 50 2.75 50 15.66 57 81.50 64 2.44 110 14.79 13 106 2.52 107 14.36 1 89.12 145 0.35 145 6.76 14 20 2.86 20 16.32 11 85.49 140 1.22 137 10.16 15 3 3.13 3 17.86 2 88.22 144 0.49 143 7.62 16 98 2.56 99 14.62 24 83.28 121 1.84 115 13.96 17 7 3.04 7 17.32 90 80.80 82 2.28 113 14.20 18 6 3.04 6 17.33 35 82.36 105 2.08 109 14.89 19 4 3.11 4 17.74 29 82.80 106 2.07 111 14.67 20 12 2.95 12 16.80 34 82.37 101 2.11 108 15.07 21 107 2.51 108 14.32 82 81.02 38 2.69 102 16.41 22 94 2.59 95 14.79 17 83.93 118 1.89 140 9.65 23 121 2.44 122 13.89 12 85.39 129 1.57 141 9.01 24 64 2.70 64 15.39 86 80.97 14 2.94 72 17.67 25 134 2.36 135 13.45 23 83.46 110 2.03 138 10.15 26 95 2.58 96 14.71 6 85.85 138 1.30 139 9.70 27 113 2.46 114 14.03 141 76.04 11 3.00 104 15.78 28 16 2.90 16 16.55 131 78.97 18 2.92 83 17.43 29 100 2.56 101 14.61 128 79.08 30 2.78 84 17.39 30 79 2.66 80 15.15 48 81.87 78 2.34 107 15.34 31 13 2.93 13 16.68 113 79.97 33 2.75 93 17.11 32 73 2.67 74 15.25 102 80.47 48 2.62 96 16.97 33 85 2.63 86 14.98 121 79.66 8 3.05 40 18.40 34 33 2.79 33 15.93 110 80.03 15 2.94 45 18.32 35 105 2.52 106 14.37 96 80.62 44 2.65 57 17.95 36 75 2.67 76 15.20 138 76.69 6 3.18 73 17.63
37 5 3.09 5 17.60 136 78.26 2 3.80 5 19.78 38 38 2.78 38 15.84 104 80.44 37 2.69 86 17.34 39 114 2.46 115 14.03 50 81.74 98 2.13 92 17.16 40 129 2.39 130 13.62 132 78.69 65 2.44 100 16.87 41 11 2.95 11 16.82 45 82.00 1 3.85 2 20.74 42 26 2.82 26 16.10 120 79.68 12 2.97 14 19.24 43 89 2.61 90 14.88 87 80.91 56 2.50 61 17.87 44 137 2.32 138 13.20 69 81.25 80 2.30 34 18.54 45 125 2.42 126 13.80 38 82.31 102 2.11 43 18.36 46 97 2.57 98 14.64 60 81.42 79 2.33 54 17.96 47 47 2.75 47 15.68 76 81.07 59 2.47 64 17.85 48 96 2.57 97 14.67 108 80.17 25 2.87 22 18.76 49 133 2.36 134 13.45 122 79.64 17 2.92 4 19.83 50 142 2.21 143 12.57 49 81.83 81 2.28 9 19.49 51 62 2.70 62 15.41 67 81.28 103 2.09 81 17.46 52 126 2.42 127 13.80 79 81.06 72 2.38 11 19.41 53 60 2.71 60 15.47 70 81.17 84 2.26 29 18.60 54 54 2.74 54 15.60 62 81.39 92 2.18 89 17.23 55 45 2.76 45 15.71 63 81.36 89 2.19 62 17.86 56 44 2.76 44 15.74 61 81.41 90 2.19 58 17.92 57 110 2.49 111 14.22 4 86.00 136 1.39 128 11.68 58 66 2.69 67 15.36 21 83.62 126 1.77 95 16.97 59 130 2.39 131 13.60 40 82.10 116 1.95 101 16.43 60 135 2.33 136 13.29 81 81.03 108 2.05 116 13.72 61 141 2.22 142 12.68 77 81.07 62 2.44 18 19.10 62 144 2.14 145 12.22 16 84.34 128 1.62 117 13.50 63 131 2.38 132 13.55 98 80.57 29 2.79 3 19.95 64 116 2.45 117 13.97 105 80.28 76 2.35 63 17.86 65 103 2.53 104 14.44 53 81.66 104 2.08 27 18.64 66 109 2.50 110 14.23 7 85.84 135 1.40 121 12.90 67 117 2.45 118 13.97 5 85.96 133 1.41 118 13.26 68 122 2.43 123 13.84 9 85.72 137 1.35 119 13.14 69 111 2.49 112 14.21 80 81.06 73 2.36 24 18.70 70 118 2.44 119 13.93 56 81.51 94 2.16 36 18.53 71 127 2.42 128 13.79 66 81.33 93 2.16 28 18.64 72 119 2.44 120 13.93 83 81.01 67 2.43 76 17.56 73 77 2.66 78 15.15 27 82.95 117 1.95 133 11.21 74 104 2.52 105 14.39 30 82.75 123 1.79 78 17.52 75 88 2.61 89 14.89 31 82.63 119 1.88 85 17.35 76 120 2.44 121 13.92 19 83.70 124 1.79 135 11.04 77 99 2.56 100 14.61 42 82.03 112 2.02 87 17.31 78 57 2.73 57 15.56 39 82.29 115 1.98 80 17.48 79 1 3.18 1 18.11 111 80.02 26 2.87 44 18.33 80 2 3.14 2 17.91 99 80.53 39 2.68 50 18.06 81 25 2.83 25 16.13 54 81.64 88 2.20 132 11.24 82 61 2.71 61 15.45 22 83.51 113 2.00 123 12.19
83 36 2.78 36 15.87 117 79.89 22 2.90 69 17.72 84 27 2.82 27 16.10 8 85.80 134 1.41 127 11.82 85 91 2.60 92 14.81 94 80.68 52 2.56 71 17.68 86 112 2.49 113 14.18 91 80.78 46 2.64 55 17.95 87 71 2.68 72 15.25 95 80.67 58 2.48 60 17.89 88 65 2.70 66 15.37 75 81.13 69 2.42 79 17.49 89 40 2.78 40 15.83 14 85.29 132 1.51 122 12.59 90 37 2.78 37 15.85 64 81.36 66 2.44 97 16.97 91 48 2.75 48 15.68 126 79.38 16 2.93 25 18.69 92 42 2.77 42 15.81 133 78.66 19 2.91 13 19.31 93 53 2.74 53 15.62 43 82.02 97 2.14 129 11.43 94 51 2.75 51 15.65 26 82.99 109 2.03 136 11.03 95 21 2.86 21 16.32 127 79.25 7 3.11 38 18.44 96 86 2.62 87 14.93 13 85.30 131 1.52 124 12.16 97 72 2.68 73 15.25 59 81.43 75 2.36 90 17.22 98 90 2.61 91 14.87 68 81.27 42 2.66 82 17.44 99 63 2.70 63 15.40 3 86.15 139 1.27 125 12.12 100 78 2.66 79 15.15 25 83.23 114 1.99 134 11.16 101 15 2.91 15 16.61 84 81.00 41 2.67 41 18.39 102 14 2.92 14 16.63 103 80.45 49 2.61 75 17.60 103 39 2.78 39 15.83 15 85.24 130 1.56 120 13.10 104 35 2.78 35 15.87 65 81.34 63 2.44 59 17.92 105 30 2.81 30 15.99 71 81.16 50 2.61 31 18.59 106 67 2.69 68 15.35 101 80.51 36 2.70 47 18.22 107 46 2.75 46 15.70 119 79.69 10 3.01 6 19.65 108 23 2.84 23 16.17 112 80.02 21 2.91 8 19.53 109 138 2.28 139 13.02 89 80.88 51 2.56 56 17.95 110 55 2.73 55 15.57 116 79.92 40 2.68 65 17.84 111 84 2.63 85 14.98 130 78.99 23 2.89 16 19.16 112 82 2.64 83 15.02 143 75.08 4 3.33 48 18.19 113 28 2.81 28 16.03 109 80.11 43 2.66 35 18.53 114 29 2.81 29 16.00 137 78.01 5 3.24 7 19.62 115 31 2.80 31 15.95 129 79.03 13 2.96 12 19.31 116 68 2.69 69 15.35 85 80.98 60 2.47 26 18.67 117 41 2.77 41 15.81 125 79.56 28 2.80 39 18.41 118 8 3.01 8 17.18 134 78.50 9 3.03 20 18.92 119 10 2.99 10 17.03 135 78.47 32 2.77 77 17.56 120 18 2.87 18 16.38 124 79.56 77 2.35 51 18.04 121 32 2.80 32 15.93 74 81.13 61 2.46 74 17.60 122 56 2.73 56 15.56 145 71.11 3 3.44 106 15.42 123 17 2.89 17 16.47 123 79.57 27 2.86 32 18.58 124 22 2.84 22 16.20 97 80.58 47 2.62 53 18.02 125 19 2.86 19 16.32 106 80.26 24 2.88 70 17.68 126 49 2.75 49 15.67 88 80.90 31 2.78 52 18.03 127 59 2.72 59 15.49 73 81.15 68 2.43 98 16.96 128 34 2.79 34 15.88 107 80.18 20 2.91 19 18.97
129 143 2.20 144 12.53 92 80.71 35 2.71 46 18.29 130 128 2.41 129 13.71 115 79.97 34 2.72 49 18.16 131 92 2.60 93 14.79 52 81.71 70 2.41 94 17.03 132 139 2.28 140 12.97 46 81.96 55 2.52 17 19.12 133 76 2.67 77 15.19 93 80.68 85 2.23 42 18.39 134 132 2.37 133 13.52 47 81.90 83 2.27 88 17.30 135 136 2.33 137 13.27 37 82.34 95 2.14 15 19.21 136 140 2.27 141 12.93 36 82.34 87 2.21 37 18.48 137 102 2.54 103 14.50 41 82.08 91 2.18 66 17.81 138 43 2.77 43 15.76 58 81.46 74 2.36 21 18.90 139 74 2.67 75 15.22 78 81.07 53 2.55 33 18.58 140 69 2.69 70 15.32 72 81.16 45 2.64 30 18.60 Artuklu 124 2.42 125 13.81 100 80.52 54 2.53 23 18.71 Güneyyıldızı 80 2.64 81 15.04 33 82.38 100 2.12 67 17.80 Hasanbey 101 2.56 102 14.57 51 81.73 99 2.12 68 17.74 Şahinbey 108 2.50 109 14.26 44 82.00 107 2.05 103 16.34 Zühre 93 2.59 94 14.79 32 82.47 120 1.86 91 17.20 Mean 2.65 15.14 81.29 2.32 16.44 Min. 2.07 12.22 71.11 0.35 6.76 Max. 3.18 18.11 89.12 3.85 22.13
L*: brightness, a*: Redness, b*: yellowness, N %: total nitrogen, PC: protein content
Discussion
Nowadays, a number of study have focused on nutrient shortcoming in people who are fed from durum wheat product and to improve the quality of new varieties which came from hybrids made genetic resources in successful breeding programs (Akcura, 2011; Aktas, 2016; Mohammed et al., 2011; Pandey et al., 2016; Kendal and Sener, 2016). For this purposes the durum wheat landraces is very important and these days, they have been largely replaced, in their centers of diversity by monocultures of pure genotypes. This genetic erosion resulted in significant loss of valuable genetic diversity for quality traits (Jaradat, 2013). To improve the quality of new durum varieties, landraces keeps its importance inside genetic diversity in Middle east and Southeastern Anatolia region. Because landraces have adequate quality characteristics for the development of new varieties that can be used in the pasta and bulgur industries. For this reason, durum wheat breeders have recently given more importance to the durum wheat landraces in order to raise the quality criteria in durum wheat (Tekdal et al., 2014; Kilic et al., 2012).
The genotypes used in the research showed high variability in the maintenance of all the quality parameters examined. The still prefer of some wheat landraces shows that they have more competitive advantage on quality parameters relative to modern varieties and it is very imported that modern durum wheat cultivars are superior among cereals to providing high quality protein for billions of people around the world (Jaradat, 2013). Therefore, the need is urgent to improve nutritive quality (Koshgoftarmanesh et al., 2010). The wide variation of genotypes of durum wheat quality parameters were described by more researchers (Tekdal et al., 2014; Kiliç et al., 2012; Kendal and Sener, 2016). The researchers working on durum wheat in different
years and places have provided some results in support of our study on the quality of durum wheat. To summarize of these studies; as in most grain quality traits in wheat, protein content is known to be affected by genetic and environment mainly location (Bement et al., 2003). However, durum wheat is richer in protein, as this is crucial for pasta making (Nuttal et al., 2017), in Mediterranean areas, durum wheat has a significantly higher average grain N concentration under the same climatic conditions (Cossani et al., 2011). As a result of the study, grain color and protein content that are durum wheat quality traits were related with bulgur quality properties. Therefore both quality properties can be used indirect selection criterion to develop high quality bulgur genotypes (Tekdal et al., 2014). Durum wheat is a good source of protein and grain protein content of 13% for durum is a standard in quality throughout the grain industry (Riley et al., 1998). On the other hand; in the pasta industry, high protein content are required to process semolina into a suitable final product because the protein content is responsible for the cooking quality of pasta products (Reddecliffe, 2001). Durum wheat is used in bulgur sector, because it has bright yellow color and contains more protein than other wheat varieties (Bayram, 2000).
Color content has to be increased to avoid artificial coloration, which is reported to be a major problem for pasta and bulgur consumers and industrialists with pasta wheat breeding programs (Schulthess, 2013). In recent years, efforts to obtain yellow bulgur and pasta in the direction of consumers’ demands mechanical annealing operations were introduced (Oner, 2002). The color of pasta and bulgur is a result of the relative proportions of pigments in the wheat grain. The color of durum wheat and flour came from the carotenoid pigments (Reddecliffe, 2001). The color of pasta and bulgur is the most important factor that consumers associate with quality and consumers believe that pasta and bulgur with a golden appearance has higher quality than sallow pasta. High yellow pigment content is desirable to ensure that the pasta has an intense amber color (Clarke et al., 1998; Tekdal et al., 2014). The L* value gives an idea of the yellow color and value the brightness of the product in durum wheat, and is considered as an important quality criterion (Sahin et al., 2006). Genotypes with high b* and L* values indicate that the quality of durum wheat increases and studies have shown that the yellow b* value is 86.6% and the L* value is under the genotype effect of 12.6% (Coşkun et al., 2010; Hailu and Mereker, 2008). Yellow pigment concentration in durum wheat is determining particularly in the commercial and nutritional quality of end-products and very important criterion in the assessment of semolina quality (Digesu et al., 2009). The semolina yellow pigment concentration is defining factor for amber color of the commercial value of durum wheat pasta (Blanco et al., 2011). Pasta quality was assessed by determining color (L*, a* and b* values) furosine, and quaking quality (stickiness, bulkiness, firmness (Marconi et al., 2002). The colour relationship between wheat fractions were that in all groups, the flour colour values (CIE L*, a*, b*) were well defined by those of the whole-meal fraction, and this was attributed to the predominance of the flour fraction in the wheat grain. It is, therefore, possible to extrapolate colour values from the easily accessible, whole-meal samples, to those of the flour fraction, which is the main portion consumed (Humphires et al., 2004).
Principal component analysis (GT Biplot) graphically showed that there is high correlation between genotypes and quality parameters and also relation among quality parameters (Figs. 3-7). The GT biplot mainly allows the visualization of any crossover GT interaction, which is very important for the breeding program (Goyal et al., 2011; Kendal and Sener, 2015; Sayar and Han, 2015). The GT (genotype-trait) biplot provides
an excellent tool for visualizing genotype × trait data (Adjabi et al., 2014). In the biplot, a vector was drawn from the biplot centered to each marker of the traits to facilitate visualization of the relationships between genotypes and traits, and the angle of vectors among traits. If the angle of the vector was less than 90°, there was a positive correlation between genotypes and traits. If the angle was equal to 90°, they were not correlated. There was a negative correlation if the angle was less than 90° (Yan and Kang, 2003). In this study, there was a positive correlation between CIE a* and CIE b*, and total N and PC, while negative correlations among CIE a*, b* and L* (Fig. 3 and
Table 3). Nuttall et al. (2017) reported that there is linear correlation between total
nitrogen and protein content, Tekdal et al. (2014) reported that there is negative correlation between CIE L* and CIE a* values and positive correlation between CIE a* and CIE b* values. On the other hand, there was high and special correlation among some genotype and quality traits. We can select the G6, G5 and G121 for CIE b* and G3 for b* and G25, G98 for L*and G78, G79 for total N and PC (Fig. 4). Kendal et al. (2016), The GGE biplot also ranks the traits for their ability to discriminate among genotypes. Sectors of the biplot formed COI groups based on the winning genotypes in each group of traits. So in the study, the features which examined were in four sectors and located in three different mega-traits. CIE a*, CIE b* located in sector 1 and total N and PC located in sector 2, while CIE L* only located in sector 3 (Fig. 5). On the other hand, CIE a*, CIE b* located in group 1 and CIE L* only located in group 2, total N and PC located in group 3 (Fig. 5). The GT biplot method provides considerable flexibility, allowing plant breeders to simultaneously select genotypes for quality and stability (Sabaghnia et al., 2013). Haile et al. (2007), the main goals of breeding programs is one of that producing durum wheat genotypes with high and stable grain protein content in Principal component analysis. In the study showed that G30 is stable genotype for all quality parameters, while G5, G14, G61 and majority of other genotypes were not stable for quality parameters (Fig. 6). Yan and Tinker (2006), the GGE biplot was accurate in interpreting the comparing genotypes and traits. The genotype with both high mean performance and high stability for all of the traits was called an ideal genotype (Kendal and Sayar, 2016; Karaman, 2019). Therefore the center of the concentric circles (i.e., ideal genotype) was the AEA in the positive direction. Genotypes located closer to the ideal genotype were more desirable than others. In the study, G36 located the center of ideal circle, it means that this genotype is ideal and desirable for all quality parameters (Fig. 7). On the other hand, G61 and G128 located under means line and far from center of circle, it means that these genotype are undesirable for all parameters. The results of the study indicated that majority of landraces can be used as parents to improve the quality of durum wheat varieties.
Conclusion
The study showed that durum wheat landraces still is very importance to raise the quality criteria in durum wheat for breeding programs. The results showed that cultivars and more landraces have general adaptability for all quality parameters, while some genotypes showed special adaptation and G79, G78, for N and PC, G22, G102 for L*, G3 for a* and G121, G5 for b*. Moreover, G30 was stable and G36 was ideal for all quality parameters. According to the biplot techniques indicated that there is high correlation between CIE a* value and CIE b* value and between N and PC, while negative correlation with these traits to CIE L* Therefore the study showed that
majority of landraces can be used as parents to improve the quality of durum wheat varieties on special or general quality parameters.
Acknowledgements. This research was supported by Mardin Artuklu University
(MAU-BAP-17-KMYO-15). We want thanks to GAP International Agricultural Research Center, Department of wheat breeding program and Karamanoğlu Mehmetbey University, Department Engineering of Food for project contributions and support.
REFERENCES
[1] Adjabi, A., Bouzerzour, A., Benmahammed, A. (2014): Stability analysis of durum wheat (Triticum durum desf.). – Grain Yield J. of Agr. 13(3): 131-139.
[2] Akçura, M. (2011): The relationships of some traits in Turkish winter bread wheat landraces. – Turkish Journal Agriculture 35(2): 115-125.
[3] Aktaş, H. (2016). Drought tolerance indices of selected landraces and bread wheat (Triticum aestivum L.) genotypes derived from synthetic wheats. – Applied Ecology and Environmental Research 14(4): 177-189.
[4] Bayram, M. (2000): Bulgur around the world. – Cereal Foods World 45(2): 80-82. [5] Bement, G., Ameha, Y., Alemayehu, Z., Jemanesh, K., Tekalign, T., Bekele, M. (2003):
Fertilizer N effects on yield and grain quality of durum wheat. – Trop. Agric. (Trinidad) 80: 146–151.
[6] Blanco, A., Colasuonno, P., Gadaleta, A., Mangini, G., Schiavulli, A., Simeone, R., Digesù, A. M., Vita, P. D., Mastrangelo, A. M., Cattivelli, L. (2011): Quantitative trait loci for yellow pigment concentration and individual carotenoid compounds in durum wheat. – Journal of Cereal Science 54: 255-264.
[7] Clarke, J. M., Marchylo, B. A., Kovacs, M. I. P., Noll, J. S., McCaig, T. N., Howes, N. K. (1998): Breeding Durum Wheat for Pasta Quality in Canada. – In: Braun, H. J., Altay, F., Kronstad, W. E., Beniwal, S. P. S., McNab, A. (eds.) Wheat: Prospects for Global Improvements. –Kluwer Academic Publishers, Boston, pp. 229-236.
[8] Cossani, C. M., Slafer, G. A., Savin, R. (2011): Do barley and wheat (bread and durum) differ in grain weight stability through seasons and water-nitrogen treatments in a Mediterranean location? – Field Crops Research 121: 240–247.
[9] Digesu, A. M., Platani, C., Cattivelli, L., Mangini, G., Blanco, A. (2009): Genetic variability in yellow pigment components in cultivated and wild tetraploid wheats. – Journal of Cereal Science 50: 210–218.
[10] Erdal, I., Küçükyumuk, Z., Kurt, S. S, Değirmenci, M. (2017): Effects of seed weights on plant growth and mineral nutrition of wheat and bean plants. – Suleyman Demirel University, Journal of Natural and Applied Sciences 21(3): 749-755.
[11] FAOSTAT (2013): http://faostat.fao.org/. – FAO, Rome.
[12] Goyal, A., Beres, B. L., Randhawa, H. S., Navabi, A., Salmon, D. F., Eudes, F. (2011): Yield stability analysis of broadly adaptive triticale germplasm in southern and central Alberta. – Canadian J. Plant Sci. 91: 125-135.
[13] Haile, J. K., Sarial, A. K., Assefa, S. (2007): AMMI analysis for stability and locations effect on grain protein content of durum wheat genotypes. – Cereal Research Communications 35(4): 1661–1673.
[14] Hailu, F., Mereker, A. (2008): Variation in gluten strength yellow pigment in Etiopian tetraplaid wheat germplasm. – Genetic Resources and Crop Evolution 55: 277-285. [15] Humphries, J. M., Graham, R. D., Mares, D. J. (2004): Application of reflectance colour
measurement to the estimation of carotene and lutein content in wheat and triticale. – Journal of Cereal Science 40(2): 151-159.
[16] Jaradat, A. A. (2013): Wheat landraces: wheat landraces: a mini review. – Emir. J. Food Agric. 25(1): 20-29.
[17] Karaman, M. (2019). Evaluation of bread wheat genotypes in irrigated and rainfed conditions using biplot analysis. – Applied Ecology and Environmental Research 17(1): 1431-1450.
[18] Kendal, E., Sayar, M. S. (2016): The stability of some spring triticale genotypes using biplot analysis. – The Journal of Animal & Plant Sciences 26(3): 754-765.
[19] Kendal, E., Sener, O. (2015): Examination of genotype × environment interactions by GGE biplot analysis in spring durum wheat. – Indian J. Gen. & Plant Breed. 75(3): 341-348.
[20] Kendal, E., Sayar, M. S., Tekdal, S., Aktas, H., Karaman, M. (2016): Assessment of the impact of ecological factors on yield and quality parameters in triticale using GGE biplot and AMMI analysis. – Pak. J. Bot 48(5): 1903-1913.
[21] Kilic, H., Tekdal, S., Kendal, E., Aktas, H. (2012): Evaluation of advanced triticum wheat (Triticum turgidum ssp durum) Lines based on augmented trial design with biplot analysis method. – Kahramanmaras Sutcu Imam University, Natural Science Journal 15(4): 18-25.
[22] Marconi, E., Carcea, M., Schivone, M., Cubadda, R. (2002): Spelt (Triticum spelta L.) pasta quality: Combined effect of flour properties and drying conditions. – Cereal Chemistry 79(5): 634.
[23] Matsuo, R. R., Irvine, G. N. (1970): Effect of gluten on the cooking quality of spaghetti. – Cereal Chemistry 47: 173-176.
[24] Mohammed, A., Geremew, B., Amsalu, A. (2011): Variation and associations of quality in ethiopian durum wheat (Triticum turgidum L. var. durum) genotypes. – International Journal Breeding and Genetics. DOI: 1039223/ijpbg.2011.
[25] Morgounov, A., Keser, M., Kan, M., Küçükçongar, M., Özdemir, F., N Gummadov., Muminjanov, H., Zuev, E., Qualset, C. O. (2016): Wheat landraces currently grown in Turkey: distribution, diversity and use. – Crop Sci. 56: 3112–3124.
[26] Nuttall, J. G., O’Leary, G. J., Panozzo, J. F., Walker, C. K., Barlow, K. M., Fitzgerald, G. J. (2017). Models of grain quality in wheat—a review. – Field Crops Research 202: 136-145.
[27] Oner, M. D. (2002): Bulgur industry, problems and solution proposal. – Grain Products Technology Congress and Exhibition, Gaziantep, Turkey, pp.39-48.
[28] Oral, E. (2018): Effect of nitrogen fertilization levels on grain yield and yield components in triticale based on AMMI and GGE biplot analysis. – Applied Ecology and Environmental Research 16(4): 4865-4878.
[29] Pandey, A., Khan, M. K., Hakki, E. E., Thomas, G., Hamurcu, M., Gezgin, S., Gizlenci, O., Akkaya, A. S. (2016): Assessment of genetic variability for grain nutrients from diverse regions: potential for wheat improvement. – SpringerPlus 5: 1912.
[30] Reddecliffe, T. M. (2001): Optimizing durum wheat yield and quality. – Master of Science Digital Thesis, Lincoln University, Lincoln New Zealand.
[31] Riley, E. A., Thompson, T. L., White, S. A., Ottman, M. J. (1998): Late Season Tissue Tests for Critical grain Protein Content in Durum, Maricopa. – In: Ottman, M. (ed.) Forage and Grain. A college of Agriculture Report Series. University of Arizona, Tucson, Arizona, pp. 43-50.
[32] Sabaghnia, N., Karimizadeh, R., Mohammadi, M. (2013): GGL biplot analysis of durum wheat yield in multi-environment trials. – Bulgarian J. Agri. Sci. 19(4): 756-765.
[33] Sahin, M., Akcura, M., Gocmen, Aydogan, S. (2006): Assessment of parameters measured by color spectrophotometer in durum wheat breeding. – Botanical Research Journal 2: 17-21.
[34] Sayar, M. S., Han, Y. (2015): Determination of seed yield and yield components of grass pea (Lathyrus sativus L.) lines and evaluations using GGE biplot analysis method. – Tarım Bilimleri Dergisi- J. Agri. Sci. 21(1): 78-92.
[35] Simmonds, D. H. (1989): Inherent Quality Factors in Wheat. Wheat and Wheat Quality in Australia. – CSIRO, Australia, pp. 31–61.
[36] Stehno, Z. (2000): Evaluation of Durum Wheat in the Czech Gene Bank: Quality Parameters. – In: Royo, C., Nachit, M., Di Fonzo, N., Araus, J. L. (eds.) Durum Wheat Improvement in the Mediterranean Region: New Challenges. CIHEAM, Zaragoza, pp. 173-176.
[37] Tekdal, S., Kendal, E., Aktas, H., Ayana, B., Bayram, M., Kilic, H., Yildirim, M. (2014): Status Screening of Wheat Varieties With Some of the Lines in the Local Population and Advanced Level Results in Terms of Quality in Turkey. – TUBITAK-1001, Project No: 111O246.
[38] Velu, G., Ortiz-Monasterio, I., Cakmak, I., Hao, Y., Singh, R. P. (2014): Biofortification strategies to increase grain zinc and iron concentrations in wheat. – J Cereal Sci 59(3): 365–372.
[39] Yan, W., Kang, M. S. (2003): GGE Biplot Analysis: A graphical Tool for Breeders, Geneticists and Agronomists. – CRC Press, Boca Raton.