T.C.
SELÇUK UNIVERSITY
GRADUATE SCHOOL OF NATURAL AND APPLIED SCIENCE
THE STRUCTURAL ANALYSES AND DEVELOPMENT OPPORTUNITIES OF PLUM PRODUCTION IN GRADACAC
PROVINCE, BOSNIA AND HERZEGOVINA
Sumedina SPAHIC - VUKOJEVIC DOCTORAL THESIS
Department of Agricultural Economics
+
July -2019 KONYA
i ABSTRACT Ph.D. THESIS
THE STRUCTURAL ANALYSES AND DEVELOPMENT OPPORTUNITIES OF PLUM PRODUCTION IN GRADACAC PROVINCE, BOSNIA AND
HERZEGOVINA
Sumedina SPAHIC – VUKOJEVIC
THE GRADUATE SCHOOL OF NATURAL AND APPLIED SCIENCE OF SELÇUK UNIVERSITY
THE DEGREE DOCTOR OF PHILOSOPHY IN AGRICULTURAL ECONOMICS
Advisor: Asst. Prof.Dr. Mithat DIREK 2019, 242 Pages
Jury
Asst. Prof.Dr. Mithat DIREK Prof.Dr. Cennet OGUZ Prof.Dr. Burhan OZKAN Prof.Dr. Kenan PEKER
Assoc. Prof.Dr. Ferhan KUCUKBASMACI SABIR
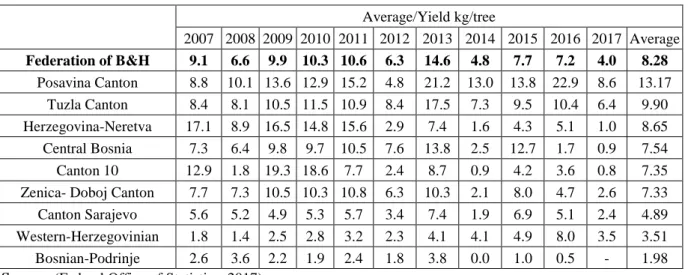
Plum production in Bosnia and Herzegovina is an agricultural activity which has an important economic significance. Bosnia and Herzegovina has a remarkable position concerning plum production. Plum is a domestic product and it is consumed domestically and exported as dry and fresh both in Europe and in the world. Gradacac province is a municipality and part of the Tuzla Canton. Gradacac has rugged terrain which allows not only plum production but also the production of other types of fruits successfully. In this respect, Gradacac province takes the leading position in Bosnia and Herzegovina fruit production. There is a very long tradition in the production of plums in Gradacac province but high yield levels which Gradacac deserves cannot be reached due to lack of fruit growing investment. Plum covers half of the fruit production in Gradacac. 6,167 tonnes of plums was produced in 2017 and the plums yield per tree in Gradacac province was only 4.5 kg. This indicates a low level of productivity. There are lots of reasons for the low level of productivity. Plum cultivation techniques are not performed by modern conditions, the continuation of the traditional structure, the application of traditional varieties and techniques instead of modern techniques, low product prices, inadequate processing facilities are obstacles of the production.
The study aimed to analyze the state of production of plum in Gradacac province; to determine current production technologies and socio-economic structures of the plum production; to analyze economic results of plum production at farms. Accordingly, it was determined that the production of one kg of plum costs 1.89 KM, compared to 0.73 KM sales price. It is seen that farmers do not have any gain from plum production and therefore production continues in traditional dimensions. Therefore, measures should be taken to turn plum production into a lucrative production activity in the province. Otherwise, it is not possible to invest in the establishment of new plum orchards and existing gardens do not seem to be
ii
able to perform adequate and modern maintenance practices. Besides, SWOT (Strengths, Weaknesses, Opportunities, Threats) analysis was conducted with the current production model of plum production, and infrastructure of strategic transformation of the future or plum trademark was established. With the SOR (strategic orientation) analysis, important information was presented to policymakers.
In the study, as well as secondary sources data, data gathered from 65 farms which were randomly selected around the Gradacac province were used. The average annual gross production value of plum farmers was 17,366.41 KM.The average total costs at the surveyed farms is 17,743.79 KM, gross margin was 9,925.27 KM, the net product was 3,370.63 KM and agricultural income was 5,266.25 KM. Producers sold their plums mostly (94.98%) as fresh, (3.01%) as dried plums, and the rest (2.01%) were returned to local drink.
In light of the information obtained, producers should be encouraged to modern production methods and supported to develop plum production. In particular, the plum processing facilities should be constructed and the sales price/cost balance should be established and producers should benefit from this production activity. So, the Gradacac plum could be transformed into a trademark. This will contribute to the worldwide recognition of the province, which is very suitable for plum production, and farmers will be able to earn more and more.
Key Words: Plum production, gross production value, gross margin, production cost, total cost, SWOT analysis, SOR analysis, Bosnia and Herzegovina.
iii ÖZET
DOKTORA TEZİ
BOSNA-HERSEK GRADAÇAÇ BÖLGESİNDE ERİK ÜRETİMİ YAPAN İŞLETMELERİN YAPISAL ANALİZİ VE GELİŞTİRME İMKÂNLARI
Sumedina SPAHIC – VUKOJEVIC
SELÇUK ÜNİVERSİTESİ FEN BİLİMLERİ ENSTİTÜSÜ TARIM EKONOMİSİ ANABİLİM DALI
Danışman: Dr. Öğr. Üy. Mithat DIREK
2019, 242 Sayfa Jüri
Dr. Öğr. Üye. Mithat DIREK Prof. Dr. Cennet OĞUZ Prof. Dr. Burhan ÖZKAN Prof. Dr. Kenan PEKER
Doç. Dr. Ferhan KÜÇÜKBASMACI SABIR
Erik üretimi Bosna ve Hersek'te önemli bir ekonomik öneme sahip bir tarımsal faaliyettir. Ülke erik üretimi konusunda Dünyaca tanınan bir konuma sahiptir. Ülkede üretilen erik, iç piyasa yanında önemli miktarda taze ve kuru olarak gerek Avrupa gerekse Dünyada diğer birçok ülkeye ihraç edilmektedir. Bosna Hersek’te Gradacac Bölgesi iklim ve diğer koşullar nedeniyle erik üretimini çok uygun bir ekoloji sunmaktadır. Yöre ülke içinde Tuzla Kantonuna bağlı belediyelik bir yerleşim bölgesi statüsündedir. Yörenin engebeli yapısı sadece erik değil, diğer birçok meyve türünün de başarıyla yetiştirilebilmesine fırsatlar sunmaktadır. Bu bakımdan Gradacac bölgesi Bosna Hersek’te meyve üretimi bakımından lider bir konuma sahiptir. Yörede erik üretimi çok eski dönemlere dayalı bir tarımsal faaliyet olsa da meyveciliğe olan yatırımların yetersiz olması nedeniyle hak ettiği yüksek üretim düzeylerine ulaşamamaktadır. Gradacac bölgesinde yetiştirilen meyvelerin yarıya yakını erik üretimine aittir. 2017 yılında Gradacac ilinde 6.167 ton erik üretilmiş, ağaç başına ortalama verim 4,5 kg olmuştur. Bu durum düşük bir verimlilik düzeyini göstermektedir. Düşük verimlik düzeylerinin birçok nedeni vardır. Erik yetiştirme tekniklerinin modern koşullara uygun yapılmaması, hala geleneksel yapının devam etmesi, üreticilerin modern teknikler yerine geleneksel çeşit ve teknikleri uygulaması yanında, düşük ürün fiyatları, yetersiz işleme tesisleri ile birlikte üretimin önündeki engellerdir.
Bu çalışma ile Gradacac bölgesinde erik üretiminin analiz edilmesi, mevcut erik üretim tekniklerinin ve üreticilerin sosyo-ekonomik yapılarının belirlenmesi sağlanmış, erik üretiminin ekonomik analizi yapılmıştır. Buna göre bir kg erik üretiminin0,73 KM satış fiyatına karşılık, 1,89 KM maliyeti olduğu belirlenmiştir. Çiftçilerin erik üretiminden bir kazançlarının olmadığı bu nedenle üretimin geleneksel boyutlarda devam ettiği görülmektedir. Dolayısıyla erik üretiminin yörede kazançlı bir üretim faaliyeti şekline getirilebilmesi için önlemler alınmalıdır. Aksi durumda yeni erik bahçeleri kurulmasına
iv
yönelik yatırım yapılmadığı gibi mevcut bahçelerin de yeterli ve modern bakım uygulamalarını yapması mümkün görünmemektedir. Ayrıca erik üretiminin mevcut üretim şekli ile SWOT (Güçlü Yönler, Zayıf Yönler, Fırsatlar, Tehditler) analizi yapılmış, gelecekte yapılabilecek stratejik dönüşümün ya da erik üretiminde markalaşmanın yapılabilmesinin altyapısı oluşturulmuştur. Buna uygun olarak yapılan SOR (stratejik yönelim) analizi ile politika yapıcılara önemli bilgiler sunulmuştur.
Araştırmada Gradacac bölgesinden rastgele seçilen 65 işletmeden alınan veriler yanında ikincil kaynaklardan alınan veriler de kullanılmıştır. Erik üretimi yapan çiftçilerin bir yıllık ortalama gayrisafi üretim değeri 17.366,41 KM olarak hesaplanmıştır. İşletmelerde ortalama işletme masrafları 17.743,79 KM, brüt kar 9.925,27 saf hasıla 3.370,63 tarımsal gelir 5.266,25 olarak bulunmuştur. Üreticilerin bahçelerinden elde ettikleri erikleri en çok taze olarak (%94,98), kalanını kuru erik (%3,01) olarak sattıkları, kalan kısımlarını ise yerel olarak içkiye (%2,01) döndürdükleri tespit edilmiştir.
Elde edilen bilgiler ışığında, üreticiler modern üretim yöntemleri konusunda teşvik edilmeli ve erik üretiminin geliştirilmesi yönünde desteklenmelidir. Özellikle erik işleme tesislerinin yapılası ile satış fiyatı/maliyet dengesinin kurulması ve üreticilerin bu üretim faaliyetinden kazanç sağlaması gerekmektedir. Böylece Gradacac eriğinin marka haline getirilmesi gerçekleşebilir. Bu durum erik üretimine çok uygun olan yörenin dünyaca çapında tanınır hale gelmesine katkı yapacak, çiftçiler daha fazla kazanç ve gelir elde edebileceklerdir.
Anahtar Kelimeler: Erik üretimi, gayrisafi üretim değeri, gayrisafi hâsıla, üretim maliyeti, toplam maliyet, SWOT analizi, SOR analizi, Bosna Hersek.
v
ACKNOWLEDGEMENTS
Looking back two years from now, I remember very well the first steps I undertook for this study. Personally, those two years have been intellectually challenging and extremely enriching. At the heart of this extraordinary experience were the people who accompanied my way. I am grateful for all the people who assisted me and gave me information and ideas starting from the initial stage of this study. A special thanks goes to my supervisor Dr. Mithat Direk for his constructive comments and suggestion. I also wish to thank Prof. Dr. Cennet Oğuz on help at every stage of writing this study. Also I would like to thank to all professors from the Agricultur Economics Department who helped me in any way to finish my PhD thesis.
Finally, and most importantly, my thanks go to my family. I want to express my greatest gratitude to my husband, Armin Vukojevic, for support, patience and understanding for my frequent absence during the research study and writing the PhD thesis, for all these years. Also I want to express special gratitude to my sister and mother for moral support and understanding during this time.
Sumedina SPAHIC - VUKOJEVIC KONYA - 2019
vi CONTENTS ABSTRACT………. i ACKNOWLEDGEMENTS……… v CONTENTS………. vi TABLES……… x FIGURES……… xvi PICTURES………... xix ABBREVIATION……… xx 1. INTRODUCTION………... 1
1.1. The Goal of the Study……… 1
1.2. Significance of the Study ………. 2
2. LITERATURE REVIEW………... 9
3. MATERIAL AND METHOD……….. 16
3.1. Material……….. 16
3.2. Method……… 17
3.2.1. Method used while selecting the reserach area ……… 17
3.2.1.1. The method use to determine the sample size ………. 17
3.2.2. Method Applied in Survey Stage ………. 19
3.2.3. Method applied in the socio-economic analysis of enterprises………. 20
3.2.3.1. Active and passive capital elements ……… 20
3.2.3.1.1. Active Capital……….... 21
3.2.3.1.2. Enterprises capital……….. 22
3.2.3.2. Socio-economic indicators……… 22
3.2.3.2.1. Population and Labor Force………... 22
3.2.3.2.2. Gross production value (GPV)……….. 23
3.2.3.2.3. Value increase of productive stock ……….. 23
3.2.3.2.4. Gross product……… 24 3.2.3.2.5. Total cost……….. 24 3.2.3.2.6. Net product ………... 25 3.2.3.2.7. Gross margin ………. 25 3.2.3.2.8. Production Costs……… 26 3.2.3.2.9. Agricultural income………... 26
vii
3.2.3.2.11. Fnancial ratios ………. 26
3.2.3.2.12. The unit cost of plum ……….. 27
3.2.4. Method Applied in SWOT and Method of Strategic Orientation Phase…... 27
3.2.4.1. Swot Analysis in Strategic Management……….. 28
3.2.4.2. Strategic options………... 29
3.2.4.3. SWOT Matrix and Strategies to be Applied………. 30
3.2.5. Method Applied in Strategic Menagement Stage ………. 31
4. GENERAL INFORMATION ABOUT THE RESEARCH AREA ……... 32
4.1. Geological characteristics ……… 34
4.2. Demographic characteristics ……… 37
4.3. Climate ………. 38
4.4. Agricultural production in the area Gradacac province ……… 40
4.5. Production of fruit at Gradacac province ……….. 43
4.6. The redemption and export of Gradacac’s plum……… 52
5. PLUM PRODUCTION IN THE WORLD, EUROPE AND BOSNIA & HERZEGOVINA………... 54 5.1. The Agriculture……….. 54
5.2. Fruit farming……….. 55
5.3. The situation of production of plum in the World………. 58
5.3.1. Import and export of plum in the World……… 69
5.4. Plum production in Bosnia and Herzegovina ………... 76
5.4.1. Import and export of plum in B&H……….. 92
6. RESEARCH RESULTS AND DISCUSSION……… 113
6.1. Socio – Economic characteristics at the surveyed farms………... 113
6.1.1. Land use distribution ………... 113
6.1.2. Population and labor force in farms………... 114
6.1.3. Capital Structure in the farms……… 117
6.1.3.1. Active capital………... 117
6.1.3.1.1. Land capital ……… 117
6.1.3.1.2. Building capital ……….. 118
6.1.3.1.3. Plant capital ……… 119
viii
6.1.3.2. Fixed enterprises capital………. 122
6.1.3.2.1. Livestock capital ………. 122
6.1.3.2.2. Capital of tools and machines ………. 125
6.1.3.3. Distribution (KM) and ratios (%) of active capital ……… 128
6.1.4. Results of economic activities of farms………. 129
6.1.4.1. Gross production value (GPV)………. 129
6.1.4.2. Gross product ………... 131 6.1.4.3. Cost analysis ………. 131 6.1.4.4. Net product ………... 138 6.1.4.5. Gross margin ……… 138 6.1.4.6. Agricultural income ………. 139 6.1.4.7. Family income ……….. ….. 140
6.1.4.8. Financial and Economical Profitability ……… 140
6.1.5. Plum Production Cost in the Research Area……….. 142
6.1.6. Technical Structural Status……… 145
6.1.6.1. Cultivated plum varieties and satisfied producers ………... 145
6.1.6.2. The location of supply for sapling of plum………... 151
6.1.6.3. Monitoring of the plant diseases and pests in the orchard, and way of choosing a plant protection products……… 153 6.1.6.4. Analysis of soil and leaves in the orchard………. 159
6.1.6.5. The fertilization of plum orchard………... 161
6.1.6.6. Criterion for determination for the period of harvesting of the Plums…. 163 6.1.6.7. The irrigation of a plum orchard………... 166
6.1.6.8. The presence of bees in the orchard………... 168
6.1.6.9. Pruning in the orchard……….. 170
6.1.6.10. Protection of the orchard from the cold……… 172
6.1.6.11. The market……… 174 6.1.6.12. Subsidies in an agricultural production in the region of Federation
of B&H……….. 177
6.1.6.13. The level of information regarding on integral, organic production and GlobalGAP standard………..
178
6.1.6.14. The meetings of agricultural producers with experts, services for information, representatives of the ministry or representatives of media….
ix
6.1.7. Results of SWOT and SOR analysis……….. 186
7. CONCLUSIONS AND RECOMMENDATIONS ……….... 194
7.1. Conclusions ………... 194
7.2. Recommendations ………. 197
REFERENCES ………... 203
BIOGRAPHY………... 213
x TABLES
Table 3.1. The total area of fruit and area of plum in Gradacac………. 19
Table 3.2. Coefficients used to convert population into male labor unit……… 22
Table 3.3. SWOT analysis………. 29
Table 3.4. The matrix of swot synthesis and discussion questions………. 30
Table 3.5. SWOT Matrix and Strategies to be Followed……… 30
Table 4.1. Representation of individual types of soil in the Gradacac province…… 34
Table 4.2. Total balance by ratings and agrozone……….. 35
Table 4.3. Age structure of the population in Gradacac, 2013………... 37
Table 4.4. Average monthly and average annual air temperatures (°C) in 2016…... 38
Table 4.5. Absolute Maximum Air Temperature (°C) in 2016 year……….. 38
Table 4.6. Absolute minimum air temperatures (°C) in 2016……… 39
Table 4.7. Average monthly and annual amount of rainfall in 2016 year (l/m^2)…. 39 Table 4.8. The monthly and annual maximum peak height of the snow cover (cm).. 39
Table 4.9. The average monthly and annual relative humidity (%)……… 39
Table 4.10. Representation of basic categories of land use……… 40
Table 4.11. The total area of sown agricultural cultures for the period 2011-2017 at the area of Gradacac province……….... 41 Table 4.12. The realized yield of crops (tonnes) in the period 2011-2017………… 42
Table 4.13. Total yield (tonnes) of fruit production in the period 2007-2017……… 43
Table 4.14. Production in kg per tree in the period 2007-2017……….. 44
Table 4.15. The total production, processing and for nutrition of consumed plum and grape in 2016 year……… 45 Table 4.16. The quantity of fruit and grapes sold at the Gradacac province in 2016 year………. 46 Table 4.17. Processing of fruit and grapes in the area of Gradacac province in 2016 46 Table 5.1. The Regions or zones of fruit trees in the F.B&H………. 57
Table 5.2. The regions of berry's fruits in the F.B&H……… 57 Table 5.3. The countries with the largest share in the total world area under the
plum for the period 2007-2016 year (area in 000 ha)……… 59
Table 5.4. The total area of planted plum’s regions for period 2007-2016 year (area in 000 ha)………..
xi
Table 5.5. The total area under plum in the European Union for the period 2007- 2016 year (area in 000 ha)……….
62
Table 5.6. The total area under plum in the Balkans for the period 2007 – 2016 year (area in 000 ha)………..
63
Table 5.7. Production of the plums in the World for the period 2007 – 2016 year (in 000 tonnes)………...
64
Table 5.8. The total amount produced of plum in the Balkan countries for the period 2007-2016 year (in 000 tonnes)………...
66
Table 5.9. Production of plum in the world, Europe, the EU and Bosnia and Herzegovina for the period 2007-2016 year (in 000 tonnes)………...
68
Table 5.10. The percentage of production of plum in the world, Europe and the EU for the period 2007-2016 year………
69
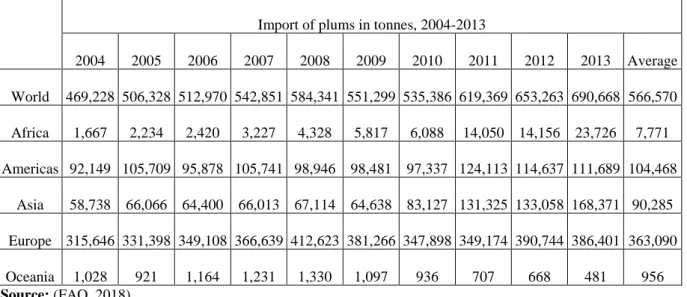
Table 5.11. Import of plum in the world and the regions for the period 2004-2013 yaer ………...
69
Table 5.12. Export of plum in the world and regions for the period 2004-2013…… 71 Table 5.13. The largest importers in the world for the period 2004-2013 (tonnes)… 72 Table 5.14. The largest exporters of fresh plum in the world for the period 2004-
2013 year (tonnes)………... 73
Table 5.15. The largest exporters of dry plum in the world for the period 2004- 2013 year ……….
74
Table 5.16. The largest importers of dry plum in the world for the period 2004- 2013 year (tonnes)…...
75
Table 5.17. Production of plum in BiH for the period 2008-2016 year……….. 77 Table 5.18. The average number of generic plum’s trees in the Federation of B&H for the period 2007-2017 year
78
Table 5.19. Total production of plum in the Federation of B&H for the period 2007-2017 year……….
80
Table 5.20. The average yield of plum in the Federation of BiH for the period 2007-2017 year………...
82
Table 5.21. The total production of plum in the Una-Sana Canton for the period 2007-2017 year………
83
Table 5.22. Total plum’s production in the Posavina Canton for the period 2007- 2017 year……….
xii
Table 5.23. Total plum’s production in the Tuzla Canton for the period 2007-2017 year……….
84
Table 5.24. Production in kg per plum tree in Tuzla’s Canton for the period 2007- 2016 year……….
86
Table 5.25. Total plum’s production at the Zenica-Doboj’s Canton for the period 2007-2017 year………
87
Table 5.26. Production in kg per plum tree in the Zenica-Doboj Canton………... 88
Table 5.27. Total plum’s production at the Bosnian Podrinje Canton for the period 2007-2017 year……… 88 Table 5.28. The total plum’s production at the Central Bosnia Canton for the period 2007-2017 year……… 89 Table 5.29. The total plum’s production at the Herzegovina-Neretva Canton during the period 2007-2017 year………... 90 Table 5.30. The total plum’s production in the West Herzegovina’s Canton for the period 2007-2017……….. 90 Table 5.31. The total plum’s production at the Sarajevo Canton during the period 2007-2017……… 91 Table 5.32. The total plum’s production at the Canton 10 for the period 2007-2017 year………. 91 Table 5.33. Import and Export of fresh plum in the Bosnia and Herzegovina for the period 2012-2017 year……….. 92 Table 5.34. Export of dry plum from Bosnia and Herzegovina for the period 2012- 2017……….
93 Table 5.35. Import of plums in BiH, 2017……….. 94
Table 5.36. Import of Dried Plums in BiH, 2017……….... 95
Table 5.37. Export of fresh plums from BiH, 2017……… 96
Table 5.38. Export of dry plums from BiH, 2017………... 97
Table 5.39. Countries with the highest export volumes of fresh plum from BiH in 2016 year………. 98 Table 5.40. Export of dry plum from Bosnia and Herzegovina in 2016………. 100
Table 5.41. The countries with the highest export quantities of fresh plum from B&H in 2015………. 102 Table 5.42. Export of dry plum from Bosnia and Herzegovina in 2015………. 103
xiii
Table 5.43. Export of fresh plum from Bosnia and Herzegovina in 2014………….. 105
Table 5.44. Export of dry plum from Bosnia and Herzegovina in 2014………. 106
Table 5.45. Export of fresh plum from Bosnia and Herzegovina in 2013………….. 107
Table 5.46. Export of dry plum from Bosnia and Herzegovina in 2013………. 108
Table 5.47. Export of fresh plums from Bosnia and Herzegovina in 2012…………. 109
Table 5.48. Export of dry plum from Bosnia and Herzegovina in 2012………. 110
Table 6.1. Number of farms according to the size of production parcels…………... 113
Table 6.2. Distribution of land according to the production……….. 113
Table 6.3. The age structure of farm owners………... 114
Table 6.4. The educational structure of farm owners …………... 115
Table 6.5. The health insurance of farm owners ……… 115
Table 6.6. The Family Labor Force………. 116
Table 6.7. The ratio of family and foreign labor force (MPU) to total………... 116
Table 6.8. Land capital by farm groups (KM )………... 117
Table 6.9. Building capital at the surveyed farms………... 118
Table 6.10. Plant capital per groups of farms (KM)………... 119
Table 6.11. Plant capital per groups of farms (Number)………. 119
Table 6.12. Varieties of plum at the surveyed farms………... 121
Table 6.13. Land improve capital at the surveyed farms (KM)……….. 122
Table 6.14. Livestock capital at the surveyed farms (Number)……….. 124
Table 6.15. Livestock capital at the surveyed farms (KM )……… 124
Table 6.16. Capital of tools and machines (TM) at the surveyed farms (Number)…. 126 Table 6.17. Capital of tools and machines (TM) at the surveyed farms (KM)……... 127
Table 6.18. Distribution (KM) and ratios (%) of active capital in the surveyed farms………. 128 Table 6.19. Gross production value (GPV) of plum’s……… 129
Table 6.20. Gross production value (GPV) of plum by type of sales………. 129
Table 6.21. Gross production value (GPV) of total production of plum ……… 130
Table 6.22. Gross production value (GPV) in livestock production ………... 130
Table 6.23. Gross production value (GPV) realized at the surveyed farms………... 131
Table 6.24. The gross product by groups of the farms (KM)……….. 131
Table 6.25. Variable costs ……….. 134
xiv
Table 6.27. Depreciation costs at the surveyed farms………. 135
Table 6.28. Fixed costs in the surveyed farms……… 136
Table 6.29. Total cost……….. 137
Table 6.30. The total production costs……… 137
Table 6.31. Net product at the surveyed farms (KM)………. 138
Table 6.32. Gross margin in the surveyed farms………. 138
Table 6.33. Agricultural income in the surveyed farms……….. 139
Table 6.34. Total Family income……… 140
Table 6.35. Rantability factor……….. 140
Table 6.36. Economic rantability (%)………. 141
Table 6.37. Capital turnover rate………. 141
Table 6.38. Unit Plum Cost in the surveyed farms (KM)………... 143
Table 6.39. The degree of satisfaction in regards to cultivated varieties of plum located in the farm……….. 150 Table 6.40. Problems faced by producers when purchasing seedlings………... 152
Table 6.41. The Preferences when it comes to the choosing seedlings………... 152
Table 6.42. Problems faced by producers when they purchase plant protection products……… 154 Table 6.43. The factors for making decisions when it comes to choosing of plant protection products……….. 155 Table 6.44. Problems related to the fertilization and the supply with fertilizers on the farms………. 162 Table 6.45. The impact of bees on yield in the orchard……….. 170
Table 6.46. Problems in the production of plums………... 173
Table 6.47. Marketing problems of plums farmers ……… 176
Table 6.48. Information regarding on integral, organic production and globalgap standard……….. 181 Table 6.49. The efficiency of media according to the opinion of agricultural producers………. 183 Table 6.50. The frequency of use of means for communication………. 184 Table 6.51. The satisfaction with the assistance of expert staff in the production of
plums………..
185
xv
plums………. Table 6.53. Internal Factor Analysis (IFAS) for production of plum in the
Gradacac province……….
186
Table 6.54. External Factor Analysis (EFAS) for production of plum in the Gradacac province………..
187
Table 6.55. Interpretation of key strenghts, weaknesses, opportunities and threats in production of plum……….
188
Table 6.56. Strategic Orientation Matrix of plum production in the Gradacac Province……….
189
Table 6.57. SWOT matrix of the strategic direction of the development of plum production in the Gradacac province………..
xvi FIGURES
Figure 1.1. Fruit production in BiH, 2017 (%), Agency for Statistics of BiH…... 2 Figure 4.1. Administrative division of Bosnia and Herzegovina………... 32 Figure 4.2. Market channels of the Gradacac province………. 53 Figure 5.1. The percentage of countries with the largest areas in the world for
the period 2007 -2016 year………. 60
Figure 5.2. Percentage of countries that were leading global producers of plum for the period 2007 – 2016 year………..
65
Figure 5.3. Percentage of plum’s production at the Balkan for the period 2007- 2016 year……….
67
Figure 5.4. Percentual view of generic plum’s trees in Cantons of the
Federation of Bosnia and Herzegovina in the period………. 79
Figure 5.5. Procentual view of the plum’s production in cantons of the Federation of Bosnia and Herzegovina for the period 2007-2017 year……….
81
Figure 5.6. Procentual view of plum’s production in the towns of Tuzla’s Canton for the period 2007-2017 year………...
85
Figure 5.7. Production of plums in Gradacac province in the period 2007-2017 (total production in tonnes)……….
85
Figure 5.8. The key markets for exported fresh plum from the Bosnia and Herzegovina (2016, KM)……….
99
Figure 5.9. Key markets of exported dry plum (2016, in KM)……….. 101 Figure 5.10. The key markets of exported fresh plum from the Bosnia and
Herzegovina (2015, in KM)……….. 103
Figure 5.11. The key markets of exported dry plum from Bosnia and
Herzegovina (2015, in KM)………... 104
Figure 5.12. The key markets of exported fresh plum (2014, u KM)……… 105 Figure 5.13. The key market of exported dry plum from Bosnia and
Herzegovina (2014, in KM)………. 106
Figure 5.14. The key markets of exported fresh plum (2013, in KM)…………... 108 Figure 5.15. The key market of exported dry plum (2013, in KM)………... 109 Figure 5.16. The key markets of exported fresh plum (2012, in KM)…………... 110 Figure 5.17. The key markets of exported dry plum (2012, in KM)………. 111
xvii
Figure 6.1. Cultivated plum varieties on the farm………. 145
Figure 6.2. The Attitudes regarding on the planting of a new varieties of plums on farms………. 150 Figure 6.3. The location of supply for seedlings of plum……….. 151
Figure 6.4. The sources of a making decisions when it comes to a chois of plant protection products in the orchard……….. 154 Figure 6.5. Informations regarding on pesticide residues in the orchard………... 156
Figure 6.6. Knowing of pests in the orchard……….. 157
Figure 6.7. Effectiveness of plant protection products in the orchard………….. 157
Figure 6.8. The reasons for ineffectiveness of plant protection products in the orchard……… 158 Figure 6.9. The existence of a system for informational - prognosis service in the phytosanitary sector for the appearance of certain plant diseases, pests and possible natural disasters………. 159 Figure 6.10. Informations regarding on carrying out of soil analysis……… 160
Figure 6.11. Reasons why producers do not carry out a soil analysis…………... 160
Figure 6.12. Methods of fertilization in the plum orchard………. 162
Figure 6.13. The sources of making decisions related to the use of fertilizers in the orchard………... 163 Figure 6.14. The criteria for determination of period of harvest of plum……….. 164
Figure 6.15. Possession of cold storage in the farms………. 166
Figure 6.16. The irrigation of a plum orchard……… 167
Figure 6.17. Reasons for not using a “drip irrigation” irrigation system………... 168
Figure 6.18. Representation of bees on examined farms………... 169
Figure 6.19. Who do pruning of the plum orchard……… 171
Figure 6.20. The information about the pruning of orchards………. 171
Figure 6.21. Protection of the orchard from the cold………. 173
Figure 6.22. Research of the Market……….. 175
Figure 6.23. Time of payment of the sold plums………... 175
Figure 6.24. The reasons why they do not use credit………. 176
Figure 6.25. Obtaining of subsidies in agricultural production………. 178
Figure 6.26. The meeting of producers with expert staff………... 182 Figure 6.27. Subscription for the newspapers and journal of agricultural 182
xviii
producers……… Figure 6.28. The participation of producers at a conference or meeting related to the agriculture………...
183
Figure 6.29. The frequency of meetings of agricultural producers with a
professional staff……….. 185
xix
PICTURES
Picture 4.1, 4.2, 4.3, 4.4, 4.5, 4.6. Orchard plums (Gradacac province - Mionica I) 48 Picture 4.7, 4.8. Irrigation plum orchards from the artificial lake (Gradacac
province - Mionica I)………... 49
Picture 4.9, 4.10. Orchard plums (Gradacac province - Mionica I)……… 49 Picture 4.11, 4.12. Older orchard plums (Gradacac province - Lukavac Gornji)….. 49 Picture 4.13, 4.14. Orchard plums (Gradacac province – Vida I)……….. 50 Picture 4.15, 4.16. Young orchard plums (Gradacac province-Skorici)……… 50 Picture 4.17, 4.18. Orchard plums (Gradacac province –Lukavac Gornji)………... 50 Picture 4.19, 4.20. Orchard plum in the spring (Gradacac province-Tufekcije)…… 51 Picture 4.21, 4.22. Orchard plum in the spring (Gradacac province -Tufekcije)…... 51 Picture 4.23, 4.24. Winter pruning of plums (Gradacac province - Lukavac Donji- Custe)……….
51
xx
ABBREVIATION
B&H :Bosnia and Herzegovina EU :European Union
F.B&H :Federation of Bosnia and Herzegovina FR :Financial result
GPV :Gross production value
GlobalGAP :The Worldwide Standard for Good Agricultural Practices HACCP :Hazard Analysis and Critical Control Point
IFAS :Internal Factor Analysis KM :Convertible mark Kg :Kilograms
LIC :Land improve capital MPU :Man Power Unit RS :Serbian republic
SWOT :Strengths, Weaknesses, Opportunities, Threats SOR :Strategic orientation
SO :Strenght – Opportunity ST :Strenght-Threat
TM :Tools machines
USA :United States of America VP :Value of production WO :Weakness-Opportunity WT :Weakness-Threat
1
1. INTRODUCTION 1.1. The Goal of the Study
The production of plums has an important economic significance in B&H. By this product, B&H is recognizable for a long time, since significant quantities of fresh and dried plum, besides for supply of domestic market, have been exported to the European and Global market. The domestic market, and especially abroad, requires constant quality and continuity of delivery, as well as product certification. Following market demands and increasingly stringent production standards, integrated production is imposed which must enable economic viability, market competitiveness and eco-friendliness.
In the last few years, the producers have faced with a huge problems in the production of plum such as placement and purchase of plum, low price of plums, lack of processing capacities, no marketing strategy, low level of education in the production of plums.
Therefore, it is necessary, it should be ensured that the producers implement the modern production methods and provide technological advancements in terms of the development of plum production and the creation of brand value in the country. The need was imposed nowadays to learn about this production and to record production and the other trends. Gradacac province has a significant role in all of this. The research, within this study has aim to:
1. Analyze the state of production of plum in the Gradacac province;
2. The determination of the current production technologies and socio-economic structures of the plum production.
3. Analysis of the economic results of plum production on farms
4. After determination of the existing plum production structure on farms, using SWOT and SOR analysis, has been determined the strategic direction of the development of plum production in the area of Gradacac province.
2
1.2. Significance of the Study
Bosnia and Herzegovina has a long tradition in the production of plums, both fresh and processed. A number of 12,411,167 plum trees were recorded in its territor, in 2017, with a total yield of approximately 74,398 tonnes, while the average yield per tree was about 6.0 kg (Agency for statistics, 2016). The folowing plum varieties are the most common: Pozegaca, Stanley, Rutgesteter, Californian Blue, Renkloda, Cimerova Rana, Cacanska rodna, Cacanska ljepotica, Cacanska najbolja, Cacanska rana and a number of local (indigenous) varietites of plum. Newly developed varieties has been studying in the experimental areas of scientic and professional institutions, and these varieties should find their place in the national Variety list of Bosnia and Herzegovina, as same as in the practice for production of plum. The most famous plum production regions are: Podrinje, Majevica, Potkozarje, Gradacac, Gracanica, Brcko, the area of Central Bosnia and some others. Plum is sold on the domestic and international markets, in various forms: fresh, as a marmalade, jam, compote, as well as dried, frozen, and in the form of alcoholic beverages (Foreign trade chamber of B&H, 2017).
Figure 1.1. Fruit production in B&H, 2017 (%), Source: (Agency for Statistics of B&H)
Due to favorable climatic conditions, Bosnia and Herzegovina belongs to the top of the European countries. Such climatic conditions are suitable for the cultivation of various fruit crops.This allows an export of a significant part of the total country's production of fruits to the European countries. The increase in export of the plum, results in an increase in income, for a country that is specialized in this type of production. The plum production has increased in the world as same as in our neighboring countries. Due to this fact, it is necessary
35% 10% 50% 4% 1% Apple Pear Plum Peach Walnut
3
to specialize production of plum in order to be competitive with the other countries. The largest quantities of Bosnian-Herzegovina`s plums were exported on the markets of Germany, Slovenia, Russia and Austria (Foreign trade chamber of BiH, 2017)
According to the Agency for the Advancement of Foreign Investments of Bosnia and Herzegovina (FIPA), B&H is the 15th country in the production of plums in the world.Despite the numerous potential, but rarely presented ways in which plums can be used, most of produced plum in Bosnia and Herzegovina at the end, decay. Although there is no relevant data, FAO, ie. the World Organization for Food and Agriculture, provides data that between 120,000 and 150,000 tons of plums are produced in B&H annually. Most of this amount decay, up to 30 percent, while between 20 and 30 percent are processed into alcoholic beverages, which harm everyone. Only between 30 and 40 percent of plums are processed into useful products such as: dried plums, different kinds of jams (local names: “recelj, “bestilj”), compotes and fruit salads, or use unprocess as fresh. Plum juice used to be produced industrially in B&H, but today it is only at the level of individual households. However, the reason why very small quantity of plum are exported and it is mostly dry plum, mainly in the countries of Western Europe, is that their quality is still not in the level of quality of products from Chile, France and California, which are the biggest competitors to this B&H`s product (Jasic, 2015).
Plum is one of the most commonly produced and consumed fruit in Bosnia and Herzegovina, it is produced in almost all parts of the country, but the province that is best known for the production of plums is Gradacac with over 50% of the total plum production in the country (Akos, 2016). Since on the Gradacac area are produced 50% of the total production of plum in B&H, the research of study was be exactly done on the area of this province, and with the goal to help Gradacac producers that production of plum as well as marketing strategy develop and increase on significant level, and on this way, with pride, to preserve long-standing tradition of production.
Gradacac is a province located in the north-eastern part of Bosnia and Herzegovina, where due to the suitable soil and favourable climatic conditions, various fruit crops are growing. According to the economic importance, production of plum, take the first place, among all fruit production.
Gradacac is a traditional fruit-growing region. With favourable agropedological properties of agricultural land and favourable climatic conditions, the Gradacac province
4
takes the lead in the agricultural production of the Tuzla Canton, especially in the field of fruit growing.Gradacac is a province that extends to 124 km2 of agricultural land, which according to the pedological map, is placed in the valleys – hills area, and this area is considered suitable for fruit production. So, primarly production of fruit belongs to the production of plum. For plum production is dedicated one of the most important agricultural manifestations in Bosnia and Herzegovina called "Plum Fair".
Plum (Prunus domestica) belongs to the (Rosaceae) family and to the genus Prunus, which includes all stone fruit (Kurtovic, et.al 2008).Among all stone fruits which are growing in the area of Gradacac province, plum is the most important and the most demand fruit crop, therefore for the production of this culture, it gives a special importance.
The plum is one of the most important symbols of the Gradacac province. Passing through the villages and surrounding Gradacac areas, everything smells on the beauty of planted orchards. This is also one of the main reasons why the topic of this final study has chosen for processing, under the name: “The structural analyses and development opportunities of plum production in Gradacac province, Bosnia and Herzegovina.” Through this study, it was trying to bring close the importance of the integral plum production for this area for everyone who read it. In addition, the study required a practical engagement on certain plots of plum orchards.
Due to the permanent contact, visits and conversations with plum producers in the area of this locality, precise and reliable data were obtained, that were necessary to realize this study in the correct way. In this study, the parameters which measure the quality of the economy are examined, such as: value of production, costs, income, cost-effectiveness and profitability, which are achieve in plum production. A calculation of plum production was done, which also was the best indicator of profitability of integral production in the Gradacac province. The purpose and goal of the study is to analyze the current state of the production of plums in order to show the real state of the organizational - economic condition of the production of plums in the area of Gradacac province.
After a period of extraordinary development of the fruit production over the past few years, in Gradacac's province, the most developed fruit growing region in B&H and, consequently, increased interest of producers, a trend of stagnation for the development of fruit production has appeared. Thus, many orchards are cultivated at a lower technological level, investments are reduced for planting of new orchards of plum, what cause that many
5
agricultural producers are demoralized and they give up from these technologically demanding production.
The present situation in this important agricultural sector is that marketing business orientation of the fruit product does not exist or is minimized. The business orientations of fruit producers are the production concept, the concept of products and the sales concept. The outdated, inefficient and inadequate business concept of fruit producers leads to poor performance, poor efficiency, demotivation and abandonment of fruit and vegetable production, which has harmful consequences for producers as same as society as a whole.
The production of plums in the area of Gradacac, during the period after the civil war 1992-1995, had a drastic fall, therefore low production yields recorded on the production plots, followed by low profitability, which caused situation that producers couldn`t meet their own needs, not to mention exports. Due to subsidies for agricultural production, granted by the authorities in the period after the war, as well as establishing of plum orchards with the varieties, which are tolerant on the Sharka, by using the new technologies of the integral way of production in plum growing, it has been achieved significant increase of yields, as well as significant economic successes.
The programs of reconstruction and restoration of international donors focused on basic rural infrastructure and housing, purchase of agricultural machinery and inputs, seeds and fertilizers for the reconstruction and rehabilitation of crop production. It was more of a social aid to local people than a serious investment in the revitalization of agriculture, with the main objective to return displaced population in rural areas (Zurovec, et.al., 2015)
The 1992-1995 war left Bosnia and Herzegovina completely devastated. The economy and infrastructures were destroyed. According to estimates, warrelated damages in the agricultural sector amounts to approximately USD 4.54 billion (GTZ, 2001).
After the end of the war in 1995, in most of the country, fruit plantations were devastated, so that the level of production from 1991 can not be reach for a long time. In the mountainous area, the additional problem was that the population was displaced, the production facilities and the plantations were destroyed and the road network damaged. Some productions had to restart from the beginning, since that the degree of damage and contamination of the diseases and pests was in such extent that the recovery of production was not possible. Many processing facilities (cold storage and dryers) were destroyed. The
6
lack of professional services, necessary for education of the population and the acceptance of new technologies, additionally made difficulties production, since today market demands: high quality products, modern packaging and design, continuity and also prompt delivery of goods (Gacesa and Becirovic, 2017).
The war and the consequences of war have made the markets unorganized in a large extent. In addition to the lost of global markets, the former Yugoslavia's market was also lost. Except with Croatia and Slovenia, a small-scale trade is realized with other republics of former Yugoslavia. The problems which faced Agricultural sector, today as well as in the earlier years, are the fragmentation of farms, low productivity of labor and the instability of market of agricultural products. In addition, the economic power of producers and their motivation for the production of high quality agricultural products are weak. The abovementioned indicates that there is no exist adequate agricultural policy in the Federation of B&H, nor there is a permanent and lasting source of financing for agriculture (Grabovac et al 2001). Investments in agriculture and productivity of the sector are low, which is caused by low competitiveness and a relatively high external trade deficit in the food sector.
The main problem of the agricultural sector is low productivity, both per unit of production, and per farm. The main feature is small-scale, subsistence agriculture oriented production rather than a more commercial or market oriented agro-food system. It is a main cause of low competitiveness, particularly in the domestic market. Low agricultural productivity is often a consequence of the absence of clear specialization, low technology levels of farms and extreme dependence on weather conditions (Zureovec, et.al,2019). The networks of public and private institutions, organizations and research institutions, which rely on a system of life-long education, efficient transfer of knowledge, technology and information, form a potential base for innovation and modernization, but they are not established or are severely underdeveloped. As a consequence of all this the producers of plums in the area of Gradacac province are followed by many problems such as: low productivity work, low yields per plum tree, low sales price of plums, lack of processing capacities, insufficiently developed marketing strategy, lack of advisory services, low level of education of plum producers, outdated mechanization, old varieties of plums.
The level of technological and marketing knowledge among producers is low, which certainly has a negative effect on the productivity of the sector. Inadequate market access reduces the motivation of farmers to specialize and improve their performance and to increase
7
production. Because of the fragmented agricultural production, one of the most important channels for agricultural outputs, the food industry, is not motivated to link up with agricultural producers on long-term contracts.
Many producers, faced with many problems, hardly find the solutions what they should do after the harvest of plum. Where is the best place to store plum and how to find customer, which are ready to buy plum, with price which are acceptable for them.One of the main problem is that the producers of the plums do not own cold storage for long-term storage, which results in the sale of plums for a very low prices, or the harvested amount of plum will decay. So, even with the satisfactory yield of the plum, a very small number of producers can boast on the cost-effectiveness of thise fruit crop. The strategy of plum producing in B&H as same as in Gradacac area has to be developed in order that the producers and the consumers would be satisfied.
The truth is that B&H is a country which, due to a poor agricultural structure, is not able to produce a large amount of plum, and in this way, surely we can not be competitive with developed countries, where plum is produced on much larger agricultural plots. Therefore, quality is best means, how to become competitive with the countries where plums are produced in much larger quantities. Plum production in the area of Gradacac province is characterized by a number of specificities.First of all, the initial investments were quite high, the capital flow was pretty slow, and therefore, the high yields initially were not satisfactory (Falan, 2007). Due to the hard work of efforts of farmers, plum production has an intense character. However, due to inadequate political structure and unfinished adequate strategies for this fruit crop, can not be said that the producers of plums in this area provide regular and high yields, and continuous quality of the plum which could result in a significant profit.
In the last few years, both in the world and in B&H, has been increased consumption and fruit production, what is the result of increase in income of consumers, as well as awareness of the positive impact of fruit on health (Jasic, 2010). From this reason has emerged the need of faster increasing of fruit production, in order to meet increased demand. Fruits are present in the diet of people, from the North to the South Pole, but it is also interesting that relatively large producers of fruits are developing countries.
The plum is the most commonly produced stone fruit in the world, right after peach and nectarine.Theplum is a fruit species of moderate climate that is used in accordance with various consumption habits, in societies. In addition to consumption in the fresh state, plums
8
can be processed, using various methods, into: juices, compotes, jams, and dry plums.
Accordingly, the plum products can be offered to different consumers with different perceptions and habits. In addition, the demand for healthy, processed fruits, such as dry plums, increases as a result of urbanization, aging population and the spread of healthy lifestyle, especially in developed countries.
It`s necessary to know how to the plum, which is in the state of consumption, gives an added value, in which form should be sell to customers, how to find customers in order to finally achieve the mutual benefit. Without satisfied customers, ie. consumers, successful production of the plum can not be achieved. Therefore, it`s very important to develop a successful marketing strategy in order to achieve the efficiency and effectiveness of the production of this fruit crop. Since the consumer preferences, from the year to the year, are very fast change and that producers become more demanding when they buy a food, it is necessary to take a step forward and to consumers offer a new product, not just the one they are used to. Consequently, following the world trends in fruit production, producers could achieve very high success by offering consumers a value added product. Also, it`s known that the plum is a fruit crop which cannot store fresh on room temperature for a long time, unless it`s stored in cold storage for a shorter period of time. It`s necessary to process the plum and offer to consumer in some new shape, packing in order to production as well as consumption should be successful.
9
2. LITERATURE REVIEW
Within this framework, a theoretical review will be given of the production of plums and of its economic importance in the areas, where it is located production.
According to Salunkhe and Kadam (1995), Plum is one of the important stone fruit crops of the world. Plums are generally consumed fresh with the exception of a small quantity used for canning and beverage preparation. Plum belongs to the genus Prunus of the subfamily Prunoidae of the family Rosaceae.
Bhutani and Joshi (1995) in their study examined that the plums are mostly consumed fresh all over the world processing of plums is generally relies on drying of fresh plum, canning and beverage preparation. Although sun drying was very common earlier, today plums are mostly dehydrated.
Stacewicz (2000) in his study examined that the plums are important source of compounds influencing human health and preventing the occurrence of many diseases.
Manolova (2002), in his study, examined the structure of Bulgarian plum production and reported that the plum industry in the country is not strong enough yet, to compete with the EU.
According to Kiss (2004), at present, new plum cultivars are being introduced into growing in the Czech Republic that bear bigger fruits, are more precocious in bearing and fit generally better for modern dense plantings of compact trees. Better-quality products of new large-fruited plum cultivars currently create a better market demand of fresh fruit. The main customers are the supermarket chains in the Czech Republic.
Knutsen (2004), in his study states that the plums are a labour-intensive crop. Labour costs are thus the major cost factor in plum production. It is important to analyse labour input and to determine which cultivars and production forms are the most efficient (Knutsen, 2004).
Somogai (2005) also states that the Plums are one of the most important stone fruits crops of the world. Plums also include several familiar stone fruits- apricot, cherry and peach. There are more than 2000 varieties of plums, among which relatively few are of commercial importance.
10
According to Vavra et.al. (2006) the increase of plum orchard hectarage in the Czech Republic by almost 2.5 times during the last 10 years proves a demand of the fresh fruit in the market. Plum trees occupy about 6% of the total fruit orchard area in the country at present; plum orchards constitute of 1,113 ha in which cultivars Stanley (25%) and Čačanska lepotica (23%) dominate. The highest return in the production of one kg of fruit was displayed by the cultivar President (value of return 6,8 KM ), which also had the lowest costs per kg (value of costs 2,86 )
Boriss et al. (2006), in his research examined the US plum industry; Due to the ecological compatibility of California, USA is the most dominant producer region in the production of plum, plum prices are very variable due to fluctuations in supply and from the reason that fresh plums have competition in a popular summer fruits such as cherry and peach.
Blazek (2007) in his study examined that the plums are grown in temperate zone in which China, Romania and U.S.A are leading countries for the production of plums (Blazek, 2007).
Vangdal, Flatland and Nordbo (2007) states that the Norwegian plum production is aimed at the fresh fruit market. Though plums can be stored commercially in CA-storage and ultra low oxygen (ULO) storage, this is not common practice in Norway. Major commercial plum cultivars grown in Norway include Edda, Opal, Mallard and Victoria. The market wants plums of a reasonably good quality for at least three weeks after harvest. It is a well-known problem that the temperature and humidity is suboptimal during marketing with changing temperatures and rather dry air in the shops. The losses during marketing of plums in Norway has been estimated to be close to 20% . In addition, the consumers wish the plums to keep fresh for several days after the purchase.
Mashabela and Vink (2008), in his research, examined the competitive performance of the fruit supply chain, in the climate conditions between South Africa and Chile. They considered Chile has a global competitive advantage for production of fresh and dried plums, compare with the other stone fruits.
According to Kurovic and Karic (2008), Plum (Prunus domestica), from the family of Roses (Rosaceae) and genus Prunus, is the kind of fruit tree, which take the third place in production of stone fruit, after the production of olives and peaches. The plum is a type of stone fruit that can be used as a fresh, dried and processed.Generally, plums as a species can
11
be growing in different climatic areas. The plum is possible to grow in moderately warm, moderately cold and subtropical climatic areas.
Jesionkowsk et al. (2008), in their research in Germany, France and Poland, examined customer preferences of dried fruit.In a study, they have formulated many questions such as: What are the regional differences of customers, which kind of dried fruit more prefer, how much, at what time they consume, the way we prefer dry fruits. In Germany and France, consumers consume fruits mixed with cereals several times a month for breakfast in the morning, and in Poland it has been established that the simple consumption of the flesh itself is desirable during television in the morning and in the evening.
Day et al. (2009), in their research, in the most important area of California for the production of plums San Joaquin Valley, gave an information on production practices, and in that area, in 2004, calculates the cost of production and establishing of a new plantations.
According to Milosevic et.al. (2010) plums in Serbia are grown throughout the country both in commercial orchards and home gardens. Extensive growing technology, low unstable yields, low-quality fruit, multitude of cultivars, and PPV-induced problems are main distinctions in plum production in Serbia.
Sottile et.al. (2010) in their study examined that the plum industry in Italy has shown substantial stability during the last ten years. About 14.000 hectares are currently grown using Japanese (75%) and European plum cultivars (25%). In Italy, unlike other European Countries, the plum production is mainly destined for fresh consumption but also some examples of dried plum production can still be found. Because of this, the orchards of Japanese type cultivars are increasing particularly fast, compared to European ones ().
Vitanova et.al. (2010) in their study examined that the plum is a fruit species traditionally grown in Bulgaria. Plum orchards in Bulgaria have been situated in four basic industrial and commercial regions. Two cultivars ‘Kyustendilska sinia sliva’ and ‘Stanley’ have been included in the plum orchards and during the last 15–20 years ‘Stanley’ has predominated. The age structure of the plum trees in Bulgaria is highly adverse, as the old orchards are predominant. In order to achieve regular reproduction processes and reconstruction of the fruit production it is necessary that young trees which have not yet come into bearing should represent about 25% of the total sum of the plum orchards area.
Minas et.al. (2012) states that the Japanese plum (Prunus salicina Lindel.) is a highly perishable temperate fruit crop and cold storage at 0 ◦C is recommended to extend fruit postharvest life and maintain quality.
12
Birwal (2012) in his study analysed the influence of the plum on human health. Plums are being used in Indian medicine as a component of natural drugs used in case of leucorrhea, irregular menstruation and miscarriage. Plum helps in prevention of heart disease, lung and oral cancer, lower the blood sugar, blood pressure, Alzheimer’s disease, muscular degeneration, improve memory capacity, boost bone health, regulates the functioning of the digestive system and so on. Incorporation of plums in dairy and food products like Yoghurt, Pies, Biscuits, Lassi, Ice cream etc., in form of extract, pulp, powder or dried chunks would surely boost up the nutritional and flavour quality.
According to Coman et.al. (2012) following an ample breeding program initiated 60 years ago, the old assortment was gradually replaced by new varieties tolerant to diseases (Sharka in particular), yielding more, having various ripening seasons and providing a longer season for the fresh market. That was achieved by breeding new autochthonous varieties or by introducing valuable foreign cvs. with a good adaptation capacity in the adequate zones for the plum culture in Romania. By for, 37 plum varieties have been obtained in 3 research centers: Pitesti, Valcea, Bistrita
Coman et.al. (2012) in their study examined that in Romania, the plum industry has remained vital for hundred of years being the major fruit species which covers an acreage of 75,292 ha (37.65% of the total fruit acreage from our country), holding the 3rd place in the world after China and Serbia and the 2nd one in Europe after Serbia. In the last years, on the intern market it was an excess amount of plum fruits at a low price so that most of plum production had to be intended to processing mainly distillation (70% for plum brandy – “tuica”), or jam, marmalade, compote, dehydrated produce (10%) and very little for the fresh market (20%). Also, the plums are exported freshly or processed as dried prunes, jam, frozen or tinned. However, the plums export is at a low level in comparison with the total plum production and the potential of the plum orchards.
Dalla Via and Baric (2012) in their study examined that in Germany, plums and prunes are grown in 6,864 farms on 4,564 ha, mirabelles and greengages in 2,623 farms on 561 ha. With regard to acreage, plum growing is the third most important tree fruit culture in Germany covering 9.5% of the entire tree fruit area in Germany. With 3,852 farms on 1,870 ha Baden-Württemberg is the largest plum producer in Germany, followed by Rhineland-Palatinate with 986 ha (695 farms), Bavaria with 571 ha (1,339 farms), Lower Saxony with 278 ha (336 farms), North Rhine-Westphalia with 190 ha (171 farms), Thuringia with 180 ha (35 farms). Plum growing in Germany is also characterised by small average
13
farm sizes of 0.66 ha/farm. The most important research institutions for plum re-search are the consolidated Julius-Kühn-Institutes, the universities of Hohenheim, Hannover, Bonn, Halle and the Technical University of Munich.
Shahzad, Ali, Qureshi, Jehan, Ullah ve Khan (2013) in their study states that the plum is an important stone fruit after peach in terms of area and production in Pakistan. It is prone to post harvest losses at different levels during its production and consumption. Evaluating post harvest losses in the marketing channel of the plum was necessary for the stake holders to make informed decision about harvest and post harvest practices. This study was conducted in Swat district in 2012 to quantify these losses at different levels using four different questionnaires. Total post harvest losses in the marketing channel of the plum were 21.51% of which 5.12% occurred at farm level, 1.44% at wholesale level, 6.31% at retail level, and 8.64% at the consumer level. Harvesting at proper maturity, using experienced labor and storage facility can reduce extent of post harvest losses of plum.
According to Butac et.al., (2013) in Europe, the plum is one of the main fruit species, occupying an area of about 500.000 ha and ensuring production of about 3.000 million tones. The important countries regarding to plums producing (Serbia, Romania, Italy, Germany, Bulgaria etc.) recorded declines of production due mainly to viral diseases which destroyed the orchards and impaired the fruit quality. Therefore, these countries developed extensive breeding programs with the common objectives (productivity, fruit quality and resistance / tolerance to PPV) and specific objectives(late blooming, self-fertility, short growing period, different ripening times, spurfructification, resistance to diseases and frost)
Milosevic et al. (2013) in in their study examined that the European plum (Prunus domestica L.) commonly known as “Šljiva” is an important commercial fruits, which has been traditionally cultivated in most of the areas of Serbia.Plum fruit are mainly marketed as fresh consumption as well as for drying. Also, main processed products made from plums include compotes, mousse, pulp, candied fruit, frozen fruit, jams, jelly products and traditional Serbian plum drink called “Rakija” or “Šljivovica” .
Steffens et.al. (2013) states that the ripening of plums is extremely fast and their harvest season does not usually last more than 20 days, thus they produce a large amount of fruit within a short period of time. Nevertheless, the production period may be prolonged by storage. Controlled atmosphere (CA) is the storage system which allows for better
14
preservation of the fruit quality due to a more pronounced reduction in the fruit metabolism.It has been verified that some plum and peach cultivars present better quality during storage under this system due to the reduction of chilling injuries and preserving the physicochemical features .
According Bulatovic (2014) in regular plum production in Vojvodina, Republic of Serbia, at an average selling price of 0.51 KM/kg and an average production of 20,000 kg/ha, the production value is 10,190.55 KM/ha. In the production of plums the total annual costs are 6,777.29 KM/ha. The realized profit calculated as the difference between the value of production and the total costs is 3,413.27 KM /ha. However, it should be noted that the purchase price of plums is very unstable, even very low in some years, which significantly reduces the realized economic effects in this production (Lukač Bulatović, 2014).
According to Saridas et.al. (2016), plums are among the most important stone fruits growing in Turkey. Plum production is in fourth place behind peach, cherry, and apricot, respectively, with 265,490 tonnes (15%) annually among stone fruits. Green plums are mainly used as rootstock due to their adaptation to various environmental conditions in Turkey. The Anatolian region has a wide range of wild and cultivated forms of P. cerasifera species, which include many economically important green plum genotypes. Due to the low acidity of the juicy fruits, green plums can be consumed in the early maturity stage, when other fresh fruits are not found in the market.
Lazicki, et.al. (2016) states that the two species of plums are grown in California: European (Prunus domesticus) and Japanese (Prunus salicina). Prunes are European plums with a high sugar content that allows them to dry without fermenting around the pit and are almost all marketed dried, as prunes or dried plums. However, there is a small but growing trend for some prunes to be sold fresh as a specialty fruit The second species, Japanese plum, accounts for most of the fruit sold as “plums” for the fresh market .
Accordin to Kock, (2016) plums are grown in South Africa mainly for the export market. Consequently, most plums are harvested with extended cold storage periods in mind. Plums are therefore harvested mature, but not ripe and are normally ripened en route to the overseas markets
Birwal et.al. (2017) states that the with many know varieties of plums, it is not surprising that it has different heritages and places of origin in all over the world. The practice of cultivation has been done since prehistoric times, longer perhaps than any other kind of