THE ROLE OF VOLUNTEERED GEOGRAPHIC INFORMATION APPLICATIONS IN
DISASTER MANAGEMENT
H. K. Sevinç1, I. R. Karaş2
1 Sinop University, 57400 Sinop, Turkey [email protected] 2Karabuk University, 78000 Karabük, Turkey, [email protected]
Commission VI, WG VI/4
KEY WORDS: Volunteered Geographic Information, Disaster Management, VGI, User-generated, Citizen Science, Crowdsource
ABSTRACT:
In times of crisis, it is a priority to get help as soon as possible and any kind of help can be accepted. Especially, all kinds of support by volunteers, is a great help in crisis resolution. Crisis locations can be developed or less developed regions. It is sometimes difficult to reach help and support in less developed regions. To create Geographic data, which is an important requirement in crisis situations, is time-consuming and costly when attempted to be produced by conventional methods. When the data is produced by volunteers, it is faster and less costly because experts try to reach and support the region. Volunteered Geographic Information (VGI) is spatial data that has been contributed for free by volunteers. In our work, that is review, the examples of Volunteered Geographic Information applications in crisis management will be shown on the poster.
1. INTRODUCTION
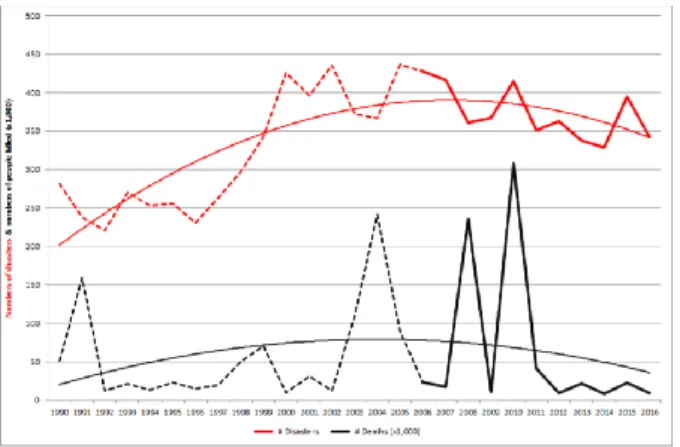
With the effect of climate change, disasters in recent years have become more complicated, and they affect people more than ever. Disaster situations generally result in many losses of lives or with injuries of people. Among the Centre for Research on the Epidemiology of Disasters (CRED)’s data, in 2016, worldwide, 342 reported natural disasters caused 8,733 deaths (Figure 1), affected 569.4 million people (Figure 2), and caused US$ 154 billion damages (Guha-Sapir, Hoyois, Wallemacq , & Below, 2016). In addition, disasters also affect the psychological and economic structure of the society experiencing it. Several topics like being prepared for a crisis, prevention, intervening a.s.a.p., planning, support to the rescue team etc. are important in this respect. The type of disasters and the process after disasters are taken as the main concerns in the present study.
Figure 1. Numbers of disasters and people deaths (x1,000):
1990-2016 (Guha-Sapir, Hoyois, Wallemacq , & Below, 2016) Geographical data on disaster include the time period in which the disaster is experienced. This time period may start on the moment a disaster occurs and may continue until recovery time. The geographical data during this process will differ from the
data after such an event in the same area. The geographical data on the disaster may disappear when the wounds of the disaster are healed.
Figure 2. Numbers of disasters and total people reported affected
(x 1 million): 1990-2016 (Guha-Sapir, Hoyois, Wallemacq , &
Below, 2016)
With Web 2.0, it has become easier to share data among people. Sharing the data by people who have common interest areas by meeting online at a platform is defined as Crowdsourcing. These two developments are reflected as Volunteered Geographical Information in geographical information systems (Figure 3). Volunteered Geographic Information (VGI) defines the creation of spatial data by a great number of citizens who mostly do not have any official education on this field (Goodchild M. , 2007). In this study, the issue of how the geographical information shared by victims of diseases about a disaster which is their common interest area at platforms (Social media, OpenStreetMap, etc.) plays a role in disasters will be investigated.
Figure 3. VGI
2. DISASTER MANAGEMENT & VGI
In disaster management cycle, responding in a fast manner and starting helps are extremely important for human life after a disaster occurs. Generally, volunteering people help the specialist teams working to respond in a fast manner. The importance of positional information during crises cannot be denied. Since disasters occur within certain time periods, time-theme maps are important in crises, and must be created in an urgent manner. The coordinates in which the disaster occurs or when a storm comes, the coordinates of the passage ways to reach the food and medication sources that are nearest to the disaster points, or the coordinates of rescue points are among some important situations. There are three main reasons for this integration: (i) a hazard map plays a key role in disaster risk identification, and it is an effective tool in making local knowledge visible; (ii) local knowledge is essential for disaster risk management; and (iii) GIS maps have advantages over conventional maps (Tran, 2009). In this respect, Tran et al. (2009) conducted a study and reported that including local information in crisis management and its being included actively in the decision-making processes improve the quality of disaster crisis management.
Figure 4. Disaster management cycle (Carter, 2008)
Specialist teams may not reach the area, they may not know the region in terms of locations, or they may be away from the relevant area. In such situations, it is necessary to make use of the positional information of local people living in the area. Volunteered Geographic Information become active in such
Figure 5. VGI Components (Capineri, 2016)
Volunteered Geographic Information has been included in the response, recovery, and development stages of disasters that occurred so far. The earthquake in Haiti in 2010 and the Sandy Hurricane in 2012 and similar events showed that the data shared by users during disasters accelerate some steps during a disaster management.
Figure 6. Disaster Management & VGI
Middleton et al. conducted a Real-Time Crisis Mapping study, and tried to create natural disaster maps with the data coming from VGI sources. In this respect, positional data shared as real-time in Twitter were required; however, the tweets that were shared by stating the positions were very few. For this reason, they created maps by determining the names of the streets etc. in cities named in natural language processing and in tweets according to their positions. (Middleton et al., 2014)
Although collecting data from volunteering participants seem profitable in terms of time and relevant costs, there may appear some drawbacks as well in some situations. It cannot be estimated how many data will come from users and from which area these data will come. For example, the maps created by Twitter were used in the earthquake in Van in 2011, the ones
provide incorrect data by being affected by emotions, and due to political and economic reasons. The data quality with VGI is an important topic that awaits further investigations (Poser, 2010) (Goodchild & Glennon, 2010).
The coordinators of the data received form users, on the other hand, may be received clearly with the help of the sensors in smart phones that are becoming more and more widespread in our present day. However, it is possible that there are not devices with adequate positioning systems in underdeveloped areas. Because of this reason, the full coordinates of the data collected from users may be missing (Poser, 2010).
Since the data obtained with VGI come from non-specialist users, the reliability of these data is suspected in many studies. Longueville et al. (2010) conducted a study and approached the accuracy of the data in a suspicious manner; however, they also reported that in case the VGI was obtained and processed with proper methods, it would become a reliable data source about natural disasters (Figure 7).
Figure 7. VGI data control study
They created a dataset with the pictures loaded to Flicker about floods in England between January 1, 2007 and March 31, 2009. This dataset was compared with the news, specialist reports, and remote sensing datasets. VGI is successful in determining the data in a real-time manner. However, the information shared with VGI must be supported with GPS. The irrelevant data of VGI must be eliminated with noise-reduction filters (Longueville et al., 2010)
3. 2010 HAITI EARTHQUAKE
After the earthquake in 2010 in Haiti, it was extremely difficult for rescue teams to provide support in the area because there were very few geographical data in the earthquake area in Google Maps etc. applications (main roads, byroads, buildings, public buildings, etc.). Two satellite companies released high resolution photographs within 24 hours for the area.
Figure 8. The map of Haiti before the data input
Voluntary users started to fill in the gaps by using the satellite images. Nearly 2000 users helped the rescue teams by adding all the details on layers for transportation. The rescue teams downloaded and updated the map that was formed by volunteers to their GNSS devices, and accelerated their transport thus eliminating the risk of being lost in an area they did not know well. In the end, it was ensured that the transportation was made in the planned speed between the airport, and the aid materials were distributed (Figure 8) (BBC News, 2017).
With Volunteered Geographic Information, the crisis was intervened in the shortest time and the aid materials were distributed. Nearly 2000 users who were not specialists created a map with images, which is an important support for rescue teams. When the components of the VGI are analyzed, it is seen that the position, subject and participants were the Haiti region which was the disaster region. The subject was the moment of the earthquake, in other words, the moment of the disaster. The participants were the users who created the map in a voluntary manner.
Figure 9. The map after 2000 users entered data 4. 2012 HURRICANE SANDY
2012 Hurricane Sandy (Figure 9) was the most-devastating hurricane that acted on America and Middle-Atlantic coastal areas. It left many physical damages like floods, electricity cut-offs, and the flying away of the roofs of buildings, etc.
Figure 10. 2012 Hurricane Sandy
Google released a map that included the direction of movement of the hurricane and revealed possible problems for people who were affected by the hurricane. Videos that were released by users on Youtube according to their positions were shared on the Google crisis map. The things that were experienced in the hurricane area were watched with Youtube videos. The crisis map facilitated that people could reach the information like electricity cut-offs, traffic situation, and shelters.
Figure 11. Google Crisis Map
Google also opened similar mapping works in disaster situations with lower risks (i.e. Isaac Hurricane. With Google Crisis Map, which is currently in beta version, users may create their own crisis maps (Google, 2018).
5. RESULT AND RECOMMENDATIONS
The basic principle in disaster management is to respond in a fast manner. Reaching the victims, guiding rescue teams and making quicker decisions by crisis management are important steps in this respect. VGI could be of help in similar situations. However, the prejudice on the data obtained with VGI is still continuing in academic circles. It was mentioned in each academic study
device use in our present day. The support of mobile devices and applications given to positioning services is important in terms of VGI.
The increasing social media users with each passing day and the support given by social media applications for positional sharing are also important for VGI.
Past experiences show that needs change in disasters and emergency situations, and the platforms used in disaster areas also change in this respect (the Openstreetmap in Haiti earthquake, and the use of Google Maps in Hurricane Sandy). Ushadidi makes crises mapping; however, is it adequate? Can emergency needs be collected in another platform? This area also need investigations.
The applications through which volunteering users share their data are usually popular ones like Twitter, Flicker, Facebook, (used more in Europe), OpenStreetMap, Google Maps, etc. Facebook and Google Maps performed what should be done in some emergency situations (like Hurricane Sandy Crisis Map). In the present study, 2 important features of VGI were dealt with. Similar mapping practices were experienced in crises stemming from the problems of countries aside from natural disasters; however, these were not included in the present study.
During natural disasters, each support that will be given to victims and rescue teams will accelerate the solution of problems, and may save human lives.
REFERENCES
BBC News. (2017, December). The volunteer mappers who helped Haiti. Retrieved from BBC News: http://news.bbc.co.uk/2/hi/8517057.stm Capineri, C. (2016). The nature of volunteered geographic
information. In European Handbook of Crowdsourced Geographic Information (pp. 15-33).
Carter, W. (2008). Disaster Management A Disaster Manager’s Handbook. Philippines: Asian Development Bank. Goodchild , M., & Glennon, J. (2010). Crowdsourcing
geographic information for disaster response: a research frontier. International Journal of Digital Earth, 3(3), 231-241.
doi:10.1080/17538941003759255
Goodchild, M. (2007). Citizen as sensors: The world of volunteered geography. GeoJournal, 211-221. Google. (2018). Google Crisis Map. Retrieved from
http://google.org/crisismap/a/.maps
Guha-Sapir, D., Hoyois, P., Wallemacq , P., & Below, R. (2016). Annual Disaster Statistical Review 2016: The Numbers and Trends. Brussels: CRED. Retrieved from CRED.
Social Media. IEEE Intelligent Systems, 29(2), 9-14. doi:10.1109/MIS.2013.126
Poser, K. &. (2010). Volunteered geographic information for disaster management with application to rapid flood damage estimation. Geomatica, 64(1), 89-98. Tran, P. S. (2009). GIS and local knowledge in disaster
management: a case study of flood risk mapping in Viet Nam. Disasters(33(1)), 152-169.