123 REDISTRIBUTIVE EFFECTS OF INDIRECT TAXES IN TURKEY 2003
Özlem ALBAYRAK Ankara Üniversitesi Siyasal Bilgiler Fakültesi Maliye Bölümü
Abstract
This article examines the redistributive impacts of indirect tax policies in Turkey. By applying S-Gini Indices to measure progressivity with different inequality aversion parameters, we examine if indirect taxes are progressive or not in Turkey. We make the standard tax incidence analysis by using statutory tax rates on final goods. In addition to the standard tax incidence analysis, we estimate effective tax rates by using Input-Output tables to cover the impact of taxation on imported and intermediary goods. The results show that the incidence of indirect taxes is sensitive to the welfare indicator chosen. While the indirect taxes reduce expenditure inequality, they increase income inequality. Effective indirect tax rates prove the importance of taxation on imported goods and intermediate goods, which are ignored by the standard tax incidence analysis. Keywords: Inequality • tax incidence • redistributive effect • progressivity
TÜRKİYE’DE DOLAYLI VERGİLERİN GELİR DAĞILIMINA ETKİSİ Öz
Bu çalışma, dolaylı vergilerin gelir dağılımı üzerine etkisini incelemektedir. S-Gini indekslerini farklı gelir dağılımına duyarlık parametreleri ile birlikte kullanarak dolaylı vergilerin yeniden dağıtımcı etkileri araştırılmıştır. Yerli nihai mallar üzerindeki yasal vergi oranlarını kullanarak yapılan standart vergi yansıma analizinin yanı sıra, Girdi-Çıktı tabloları yardımıyla efektif vergi oranları hesaplanmış ve bu sayede ithal mallar ve ara mallar üzerine konulan dolaylı vergilerin etkileri de incelenmiştir. Sonuçlar, kullanılan refah göstergesine göre vergilerin etkilerinin değiştiğini göstermiştir. Buna göre vergiler hanehalkı harcamasının refah göstergesi olarak kullanıldığı durumda harcama eşitsizliğini küçük de olsa düzeltici etki yaparken, hanehalkı gelirinin kullanıldığı durumda vergiler gelir dağılımını bozucu çıkmaktadır. Efektif vergi oranları ile yapılan analizin sonucunda ara mallar ve ithal mallar üzerinden gelen vergi yükünün etkilerinin ihmal edilemeyeceği görülmüştür.
Anahtar sözcükler: Eşitsizlik • vergi yansıması • yeniden dağıtımcı politikalar • progresif vergi
Introduction
In the last three decades there has been a rising trend in inequalities all over the world (Gottschalk and Smeeding, 1997; Mitra and Yemtsov, 2007; OECD, 2008) and researchers’ focus has been turned to investigate the sources of income inequality and the
124 ways to reduce it. Reflecting these efforts, since the 1990s a huge body of empirical literature has been produced on the redistributive impacts of government revenue and expenditure policies, particularly in developing countries, to find out if government policies have been one of the sources contributing to rising inequalities (regressivity of the policies) as well as if government policies can be used as an effective instrument to mitigate inequalities and poverty (progressivity). Tax policies are one of the main redistributive instruments available to the public authorities in addition to public expenditures and this paper is concerned with this issue for Turkey.
Since the 80s, Turkey and other developing countries have cut most trade taxes to open up their domestic markets to world trade, decreased the share of direct taxes in the total tax revenues to support private investment and used domestic indirect taxes to compensate the tax revenue loss from these policies1. As a result of these tax policies, indirect taxes have obtained the largest share in total tax revenues (over 60%). Since indirect taxes are known to be mostly borne by poorer parts of the society, the redistributive impact of these taxes is generally expected to be regressive. Hence in 1990s the main motive behind tax incidence analyses for developing countries was to examine the distributional impacts of these policy changes (Devarajan, and Hossain, 1998; Sahn & Younger, 1998, 2003; Rajemison & Younger, 2000; Younger, et.al., 1999; Pınar, 2004)2. Although the results change with the shifting assumptions adopted and with countries, the general results from these studies showed that direct taxes and property taxes are mostly progressive; indirect taxes are generally regressive but vary with the particular indirect tax examined; the overall tax system varies with countries but is regressive at low incomes.
This paper addresses the measurement of the redistributive effects of indirect tax policies in Turkey, where high inequality has been a persistent problem for a long time. The first study on the distributional impact of indirect taxes in Turkey was conducted by Pınar (2004) for 1994 and 2002. Pınar applied the fiscal incidence method by comparing quintiles’ share of household incomes before and after tax policies. However Pınar (2004) does not use the progressivity indices we are using and ignores the statistical robustness of the results,
1
See Albayrak (2010), Emran ve Stiglitz (2000, 2005 ve 2007), Mankiw et al. (2007), Penalosa ve Turnovsky (2005) and Tanzi and Zee (2000) for the theoretical and empirical discussion about tax policies after 80s in the 2 See Chu et al. (2000), Gemmell and Morrissey (2003) and Martinez-Vazquez (2004), Shah and Whalley (1991) among others for detailed survey on developing countries’ tax systems and tax incidence analysis.
125 which may cause one to question their reliability. Also the author uses only household income as a welfare indicator. Pınar found that VAT has almost no impact on income inequality, but has a small negative impact on lower income groups. Zenginobuz et al. (2010) also examined the indirect tax burdens of income groups in Turkey and found that the indirect tax burden of the poorest 5% of Turkey is over the average indirect tax burden, implying potential inequality increasing impact of indirect taxes. Zenginobuz et al. makes a descriptive analysis only and ignores the statistical robustness of the results.
The main contribution of this paper is threefold. First, it examines the distributional impacts of indirect tax policies by applying the different global summary statistics of progressivity with the statistical dominance testing methodology. This will give us more confidence in the findings. The second contribution of the article is to examine effective tax rates for indirect taxes by using Input-Output tables to capture the incidence of indirect taxes, not only on final goods but also intermediate inputs and imported goods. The studies done on indirect tax incidence in recent years make use of nationally representative household survey data. Survey data are used to attain households’ pattern of demand to determine the tax paid by each household. However, these studies generally capture tax incidence only on final domestic goods with statutory (legal) tax rates in question; and either ignore taxes on inputs and imported goods or make some strong assumptions to include these issues in the analysis. Thirdly, we use both household income and expenditure as welfare indicators to see if the results are sensitive to the welfare indicator chosen. This issue is generally ignored in tax incidence studies. However, our study shows the results can be sensitive to the welfare indicator.
The structure of the remainder of the article is as follows. Section 2 provides an overview of the Turkish tax structure. Section 3 discusses measurement issues, beginning with measurement of progressivity and redistribution and then moves on to relevant income and expenditure concepts, followed by explanations on the data we shall use. Section 4 gives the results and the final section offers concluding remarks.
126 Turkish Revenue System
Turkey’s tax system took its present structure after the 1980s, when Turkey implemented structural adjustment programs with IMF and World Bank support3. One of the aims of these structural adjustment programs was to improve fiscal imbalances in the economy, including the introduction of VAT in 1985. With the introduction of VAT, the share of indirect taxes in total tax revenues (TTR) increased dramatically from 37% in 1980 to 52% in 1985 and made indirect taxes the main source of tax revenue for the government budget, while the percentage share of the direct taxes kept declining in time. The percentage share of direct taxes in TTR is 31% and indirect taxes account for 52% (or 67% when foreign trade taxes are included) in 2003. In this respect, Turkey represents a typical developing country, which has limited coverage of direct taxes and a predominance of domestic indirect taxes over tax policies (Chu et. al. 2000).
The major components of government tax revenue in Turkey are personal income tax (PIT) and indirect taxes. The former is considered a progressive tax in the sense that (average) tax rate increases with taxable income and is expected to have an equalizing impact on income distribution (Kakwani, 1986; Lambert 1993). The latter is usually levied at a standard rate, which may result in a pro-rich redistribution due to a relatively higher propensity to consume among the poor. In order to prevent such an effect, some differential lower rates are applied to some goods, such as basic needs.
The common sales tax is the Value-Added Tax (VAT) in Turkey. VAT is applied to various components of household spending at different rates: 1% on raw food (VAT1), 8% on processed food (VAT8), and 18 % (VAT18) as the standard rate. There is an excise tax for luxury goods called Private Consumption Tax (PCT), issued in various rates on different products. Even if PCT is not levied as widely as VAT, the share of the tax in total indirect tax revenue is higher than that of VAT. Private Communication Tax (PCOT) is another excise tax: all types of installation, transfer and telecommunication services given by mobile phone operators are subject to 25% PCOT.
3
127 Trade taxes are another important part of indirect taxes. The share of trade taxes (import tariffs and VAT on imported goods) in indirect tax revenues accounted for 15.91% in 20034 and 70% of the total import volume was made up by intermediate goods5. In the first part of our work, we exclude import taxes, since we do not know which goods in the consumption bundle of households in the data are imported. In the second part of the chapter, we estimate effective tax rates by using Input-Output Tables for the indirect tax incidence analysis, so we will be able to cover the effects of import taxes and indirect taxes on intermediate goods.
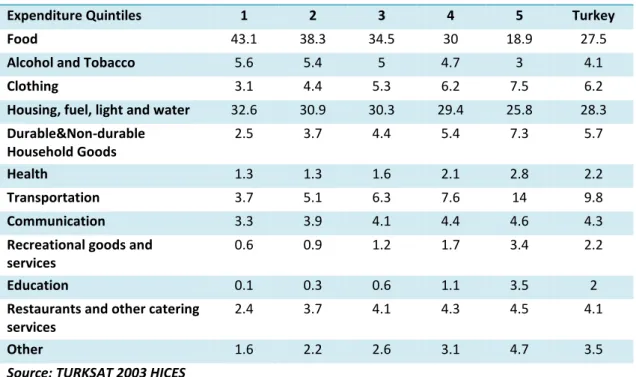
As aforementioned, Turkey has differential rate for VAT to reduce its regressive character. Table 1 presents consumption patterns in Turkey by expenditure deciles calculated from 2003 HICES. It is accepted that households bear a greater burden of a tax if the expenditure share of the product is above the national average. From the table it is seen that the poorest first quintile’s expenditure share is over the national average on food, alcohol and tobacco, and housing, fuel, light and water. For food, VAT rates are either 1% or 8%, which may help reduce the potential regressive impact of VAT. Although alcohol and tobacco products are subject to the high PCT, 72% of people consuming alcohol is concentrated in the 4th and 5th expenditure quintiles, which may imply a progressive character to PCT. Therefore we may expect that despite the fact that the share of indirect taxes in TTR is very high in Turkey, regressivity of indirect taxes could be small.
4 State Planning Organisation, Economic and Social Indicators 1950-2006 5
128 Measurement Issues
Progressivity Measures
The impacts of public policies on income distribution are assessed by the notion of progressivity. The reason for focusing on progressivity comes from the role of governments in reducing discrepancies in the well-being of individuals (equity) as well as increasing welfare (efficiency). Progressivity (regressivity) is defined as a measure of the deviation of a tax or benefit system from proportionality in favour of the poorer (richer) (the first requirement of progressivity). Also, any progressive policy instrument is supposed to improve the distribution of welfare in the society, so it is expected to have positive redistributive impacts (the second requirement of progressivity) (Kakwani, 1986; Lambert, 1993). The second requirement refers to the redistributive power of public policies and demands that if a tax system does not produce less unequal post-tax incomes, that tax system should not be called progressive.
Jacobsson (1976) and Fellman (1976) showed that if tax liabilities are distributed more unequally than pre-tax incomes, in other words, if the tax is progressive, then the after-tax distribution is less unequal than the pre-tax distribution if there is no reranking as a
Table 1: Consumption Pattern in Turkey, 2003
Expenditure Quintiles 1 2 3 4 5 Turkey
Food 43.1 38.3 34.5 30 18.9 27.5
Alcohol and Tobacco 5.6 5.4 5 4.7 3 4.1
Clothing 3.1 4.4 5.3 6.2 7.5 6.2
Housing, fuel, light and water 32.6 30.9 30.3 29.4 25.8 28.3 Durable&Non-durable Household Goods 2.5 3.7 4.4 5.4 7.3 5.7 Health 1.3 1.3 1.6 2.1 2.8 2.2 Transportation 3.7 5.1 6.3 7.6 14 9.8 Communication 3.3 3.9 4.1 4.4 4.6 4.3
Recreational goods and services
0.6 0.9 1.2 1.7 3.4 2.2
Education 0.1 0.3 0.6 1.1 3.5 2
Restaurants and other catering services
2.4 3.7 4.1 4.3 4.5 4.1
Other 1.6 2.2 2.6 3.1 4.7 3.5
129 result of taxes. This means that public policies satisfying the first requirement of progressivity may not produce less unequal post-tax distribution if there is reranking6. Reranking is an issue related to horizontal inequity. If a tax creates reranking, therefore it is also horizontally inequitable and decreasing the redistributive power of the tax, which will be shown below by decomposing the redistributive impact of a policy.
In this paper, we try to answer two questions at the same time: whether indirect taxes are satisfying the first requirement of progressivity in Turkey or not and, if they are found to be progressive in this respect, whether the redistributive impact is positive or not. In other words we are not only examining the distribution of indirect tax liabilities in Turkey, but also expecting to understand if post-tax incomes are distributed more equally than pre-tax incomes to obtain some policy implications from the analysis. This point is particularly important as most studies in the tax incidence literature recently are focusing only on the distribution of tax liabilities - in other words on only the first requirement of progressivity - and ignore the question of whether the policies have a meaningful impact on income distribution. In this respect, we think that a progressivity measure which pays attention both requirements of progressivity should be used in the analysis of redistribution.
Lorenz curves, Lorenz based S-Gini (Single-Parameter Gini) inequality indices, and the corresponding progressivity measures are the measures commonly used in the fiscal incidence literature and we will also use them in our analysis. The Gini index as a method to measure inequalities tends to be most sensitive to welfare changes (or transfers) around the middle of the distribution and least sensitive to changes among the very rich or the very poor. In other words, the Gini coefficient gives equal weight to all incomes regardless of whether they are received by the rich or the poor. As a result of this, it computes the average distance between cumulated population shares and cumulated income shares and it does not satisfy the principle of diminishing transfers7. The principle of diminishing transfers demands that an inequality index be more sensitive to the transfers taking place at the lower income levels.
6
For the causes of reranking and more detailed discussion on reranking and progressivity measures, see Albayrak (2009), Lambert (1993) and Duclos and Araar (2006).
7 See Allison (1978), Atkinson (1970), Creedy (1998), Jenkins (1991), Sen (1997) and Shorrocks (1988) for the assessments of different inequality measures and principles of inequality indices.
130 The advantage of S-Gini indices is particularly based on the opportunity to introduce ethical weights to the measurement process which can make the Gini index sensitive to the principle of diminishing transfers. Following Atkinson (1970), which introduced an inequality aversion parameter into the measurement of inequalities, different ethical weights have been introduced to determine to which side of a distribution researchers want to give more importance while estimating inequality. Using the Lorenz curve and these weights, S-Gini inequality and progressivity indices can be computed. The general formula below for ethical weights suggested by Yitzhaki (1983) will be used in this paper: ) 2 ( ) 1 )( 1 ( ) ; ( p p
where is the value of a single “ethical” parameter indicating inequality aversion, p is the proportion of individuals in the population who receive a level of income that is less than or equal to y, y is a welfare indicator which can be income or consumption. must be greater than 1 to make the weights, κ(p;), positive everywhere. The larger the value ofis, the larger the value of (p;) for small p, in other words for lower parts of the distribution. Ethical weights make us to choose to focus on different part of the societies. In other words, ethical weights make progressivity and inequality measures more sensitive to welfare changes in the chosen part of the society (the poor, middle class or the rich). As put by Lambert (1993:119), therefore, S-Gini Indices of inequality provide the analyst with the opportunity to select a range of values of to check the robustness of the implied inequality ranking of different distributional judgements or different social welfare functions.
Before defining S-Gini indices of inequality and progressivity we need to explain concentration curves and the concentration index. Analogous to the Lorenz curve, the concentration curve was introduced as a descriptive and normative tool for assessing the impact of tax and transfer policies8. Concentration curves plot households from the poorest to the richest, ranked by a chosen welfare indicator (e.g. gross incomes or expenditures), on the horizontal axis against the cumulative proportion of taxes paid by households. Hence, S-Gini inequality and concentration indices respectively are defined as below:
8
131
1 0 ) ; ( )) ( ( ) ( p L p p dp I
1 0 ) ; ( )) ( ( ) IC( p C p p dpwhere L(p) and C(p) are Lorenz and Concentration curves respectively. As =2
makes κ(p;=2) take the value, 2, I(2) gives the usual Gini index, which gives equal weight to
all distances, p-L(p). There are two approaches to attaining global summary measures of progressivity, namely Tax-Redistribution (TR) and Income-Redistribution (IR). Globally, TR involves comparing the Lorenz curve for gross income (pre-tax income), LX(p), and the
concentration curves ,C(p), for taxes. Therefore, the TR approach deals with the first distributive feature of progressivity, namely departure from proportionality. On the other hand, the IR approach takes into account the difference between the concentration curves of net income and the Lorenz curve for gross income. Hence, the IR approach measures redistributive impacts. If there is no reranking, TR and IR approaches give the same ranking of public policies, since concentration curves for post-tax incomes and the Lorenz curve for post-tax incomes coincide.
Thus, S-Gini Indices of TR (IT()) and IR (IV()) progressivity, reranking (RR) and
redistribution (IR) are given by following equations respectively:
1 0 ) ; ( )) ( ) ( ( ) ( L p C p p dp IT Y T
1 0 ) ; ( )) ( ) ( ( ) ( C p L p p dp IV Y T Y
1 0 ) ; ( )) ( ) ( ( ) ( C p L p p dp RR Y T Y T
1 0 ) ; ( )) ( ) ( ( ) ( L p L p p dp IR Y T Y 132 where, CT is the concentration curve for tax liabilities ranked by pre-tax incomes
(gross) incomes, LY-T(p) is the Lorenz curve for post-tax (net) incomes and CY-T(p) is the
concentration curve for post-tax (net) incomes ranked by pre-tax (gross) incomes (Y).
IT(=2), IV(=2) and RR(=2) are known as the Kakwani index of TR progressivity,
Reynolds-Smolensky of IR progressivity and Atkinson-Plotnick index of reranking (Duclos and Araar, 2006). We can decompose the total redistributive impact, that is, the difference between the Lorenz curve of net and gross incomes in a way including both IR-progressivity and horizontal inequity. This would indicate the extent of the redistribution caused by public policies and sources of the redistributive impact.
( ) ( )
( ) ( )
) ( ) (p L p C p L p C p L p LYT Y YT Y YT YTThe first term on the left hand side gives us IR-progressivity (vertical equity) caused by the benefit, B, and the second term is the horizontal inequity or reranking, which apparently decreases the progressive impact of the tax (Duclos and Araar, 2006; Kakwani 1986).
Statistical Inference
Since Lorenz and concentration curves (similarly inequality and progressivity indices) are computed from a sample, not from the whole population, statistical robustness should be checked. In order to decide if a tax is progressive, we need to test if there is a statistically significant difference between a concentration curve and a Lorenz curve. If the differences are statistically different from zero, this would also give us that the indices obtained as differences from these curves are also statistically significant. Davidson and Duclos (1997) derived the distribution-free9 standard errors for the difference between two concentration curves that may be dependent. We use Software for Distributive Analysis (DAD) by Duclos and Arrar (2006) to produce asymptotic standard errors for progressivity indices with different values of inequality aversion parameter,. After deriving asymptotic standard errors, we apply the t-test by using DAD if the progressivity indices are different
9 By distribution-free standard errors, the authors mean that their results do not require a specification of the population distributions from which the samples are drawn.
133 from zero for each level of the inequality aversion parameter. Progressivity indices are positive (negative) when the tax in question is progressive (regressive) and zero if the tax is proportional or does not cause any change on distribution of welfare.
We calculate indices for the increasing inequality aversion parameter, , which offers a sense of how a more progressive social welfare function ranks the value of a tax policy. The inequality aversion parameter takes values from 1.01 to 4 or 510 in steps of 0.5. The higher the parameter, the greater the emphasis on the bottom of the distribution; in other words on the poorer. If we find that for all parameter values one tax is found to be progressive, we call that tax progressive under different progressivity measures.
Data and Welfare Indicator
The basic data are the Household Income and Consumption Expenditure Surveys (HICES), conducted by the Turkish Statistical Institute (Turkstat) to measure households’ living standards and utilization of public services. The sample of HICES is designed to be representative of the population of Turkey, and two of the surveys - 1994 and 2003 - are also regionally representative. There are 8 surveys and the latest published survey is for 2008. We use one year cross-sectional data (2003) and aim at attaining not only the trends in redistributive impacts of public policies in 2003 but a general trend valid for today’s Turkey by using different welfare indicators. The reason for utilising only 2003 survey (with 25,920 households) is that the 2003 HICES is the most recent, comprehensive and regionally representative household survey. As the surveys conducted after 2003 have smaller sample size (8,640 households), they are not regionally representative and they are not as comprehensive as the 2003 HICES, particularly in terms of consumption data.
Before discussing the welfare indicator, it is necessary to discuss which unit of analysis should be used. The main concern of theoretical welfare economics and measurement methodologies is the well-being of individuals. However, from the empirical point of view, households become much more appropriate units to focus on, particularly for developing countries. The family unit is typically viewed as the most appropriate unit of
10
134 measure because of the income or consumption-sharing phenomena that occur within families. Moreover, as opposed to income, the data on consumption is collected generally at the household level. However, there are problems with using family units. The problems concern the heterogeneity of household units in terms of size and demographic indicators. In order to make welfare comparisons among families with different sizes and demographic indicators, the common practice is to convert each family into a certain number of “equivalent adults” by the use of some “equivalence scale” (Deaton, 2000).
To consider the heterogeneity of household units, household size is converted into adult equivalent (AE) using the following formula for the household i:
)
(A AEi i Ci
where Ai is the number of adults in the household, Ci is the number of children, and and are parameters. Children are individuals aged 14 and below. We apply a value of =0.6 and =0.9 following World Bank (2005). Adjusted adult equivalent size of the household i (AE*i) following Deaton and Zaidi (2002) is defined as:
i AE C A C A ) ( * AE 0 0 0 0 i
where A0 and C0 are the number of adults and children in the “pivotal” households
(average number of adults and children in Turkey) and Ai and Ci are the number of adults and
children in the ith household. The modal or pivotal household in Turkey is a 4-member household with 2 adults and 2 children (Mean household size is 4.13 for Turkey in 2003).
There are two main, widely used, welfare indicators, namely expenditure on consumption and income11. It is thought in the literature that consumption is superior to income. Two reasons can be put forward to support this view. The first relies on Friedman’s (1957) permanent income hypothesis. Consumption is seen as a better measure of lifetime welfare than is current income, because of the consumption smoothing behaviour of individuals. In the absence of reliable data on lifetime income, it has been generally thought
11
Income and consumption are also called unidimensional welfare indicators and critisized for focusing only on one aspect of welfare. Multidimensional welfare indicators have other aspects such as health, education and political rights. Human Development Index can be given as an example of multidimensional welfare indicators. See Albayrak (2009) for further discussion and references.
135 that current consumption is a better indicator of permanent income (Fields, 1980). The second reason is based on data quality. Although measurement difficulties such as imputations (for such as in-kind incomes and own-productions), recall bias, seasonality, and long questionnaires apply to both income and expenditure, it is commonly accepted that income is more sensitive than consumption in most respects. As Deaton (2000: 29) puts it:
accurate estimates of income also require knowledge of assets and their returns, a topic that is always likely to be difficult, and where respondents often have incentives to underestimate.
This is a more serious problem for families engaged in agricultural activities since they are required to have proper accounting systems to obtain profits over agricultural activities, which is not the case for small-scale farmers in most developing countries.
Despite the advantages of using consumption, this choice is criticized on the grounds that it does not consider the impact of saving behaviours and the accumulation of wealth, which is a very important element affecting inequality. It is known from the empirical literature that consumption generates lower inequality than income does; and this is the case for Turkey too. The impact of wealth accumulation and high savings of rich households are thought to lead to consumption measures’ underestimating inequality. However, it is also widely accepted that rich households tend to underreport their incomes to hide their true income for a number of reasons. Properly working credit markets are crucial for individuals to smooth their consumption. Another important criticism against using consumption as an indicator of permanent income argues that in developing countries credit market imperfections prevail, so individuals are not as successful as their developed country counterparts at smoothing their consumption. This criticism can be answered by the existence of informal or nonmarket borrowing opportunities12 in developing countries. In light of all these advantages and disadvantages of both indicators, it appears that the choice of welfare indicator should not be made only on the basis of theoretical considerations, the data quality and country facts should also be taken into account. We think that the best way is to use both income and expenditure in order to provide a sensitivity analysis based on the welfare indicator13.
12
See Besley (1995) for an analysis of informal or nonmarket credit institutions in developing countries. 13 Gradin and Del Rio (2008) and Johnson and Smeeding (1998) are among the researchers emphasizing the importance of using both indicators. See also Annad and Harris (1994) for the choice of the welfare indicator.
136 Results
Standard Incidence Analysis
We report the indices for a wide range of inequality aversion parameters, ranging from 1.01 to 4. This allows us to see if the progressivity and redistributive power of the taxes vary with the ethical parameter values (ρ). To put it differently, we would like to see if the results change with different distributional judgements (different social welfare functions). We also use the inequality aversion parameter to see if any part of the society is affected more or less by the policies. Tables 2 and 3 provide the Kakwani index of TR-Progressivity and the Reynolds-Smolensky index of IR-Progressivity, as well as the indices for redistribution and horizontal inequity, in other words the indices for the inequality aversion parameter, ρ=2 for household income and household expenditure respectively. S-Gini indices with ρ=2 provide us the values of the indices when we focus more on the middle of the distribution. These tables are summaries of the tables in Appendix 1 (from tables A1 to A6) which give the results for the whole range of the inequality aversion parameter. As can be seen from asymptotic standard errors, all indices calculated are statistically robust.
The progressivity of the indirect taxes is sensitive to the welfare indicator chosen. We confirm that apart from VAT114 and VAT8, all indirect taxes are progressive according to both the TR and IR approaches with household expenditure as welfare indicator. Thanks to the differential rates on VAT, the total VAT is progressive, although VAT1 and VAT8, on general food products, are regressive. TR-progressivity rates confirm that the most progressive tax is PCOT, which is a special tax on mobile phone services. PCT seems to be more progressive than VAT when ρ is smaller than 3 (when we put more weight on middle and upper middle classes); as we increase our ethical focus on the poor, progressivity rates for PCT decline and PCT becomes less progressive than VAT. This change in the size of progressivity of these two taxes comes from differentiated rates of VAT. VAT rates on food, whose share in total expenditures for the poor is around 40%, are 1% or 8% and these smaller rates help increase the progressivity of VAT relative to PCT when the poor is focused on. VAT is the most progressive tax with the IR approach, which is the result of the bigger share of VAT in the household expenditures relative to PCOT and PCT. For VAT18, VAT, and
14
137 PCOT the progressivity rates rise with ρ, but for PCT and total indirect taxes the progressivity rates take the highest values when ρ is between 1.5 and 2.5 and it starts decreasing once ρ is 2.5, which indicates the high indirect tax burden on the poor. Although the redistributive impact from total indirect taxes is positive for the whole range of ρ, the extent of redistribution is quite limited: indirect taxes cause less than 1% inequality reduction in expenditure inequality.
When we use household income as the welfare indicator, all indirect taxes turn to be regressive for the whole range of inequality parameters according to both TR and IR approaches except PCOT. The most regressive tax is VAT1, followed by VAT8 and VAT18 on the TR approach. The reason for this ranking is the higher share of food consumption of the poor as a percentage of their incomes. Regressivity rises with ρ, so the tax burden increases with incomes. The ranking according to the IR approach suggests that the most regressive impact comes from the overall VAT, followed by PCT, VAT8, and VAT1. Although PCOT corrects the income inequality with positive values of S-Gini indices of redistribution for the whole range of ρ except 1.01, the impact of PCOT is not big enough to make the total indirect taxes have an improving affect on income inequality. The disequalising impact of total indirect taxes on income inequality increases with the inequality aversion parameter and when ρ is 4, the taxes cause a 4% increase in income inequality.
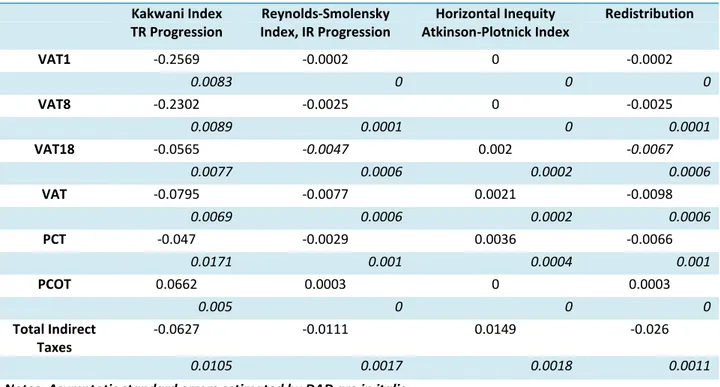
138 Table 2: S-Gini Indices for Taxes (ρ=2) (Income)
Kakwani Index TR Progression Reynolds-Smolensky Index, IR Progression Horizontal Inequity Atkinson-Plotnick Index Redistribution VAT1 -0.2569 -0.0002 0 -0.0002 0.0083 0 0 0 VAT8 -0.2302 -0.0025 0 -0.0025 0.0089 0.0001 0 0.0001 VAT18 -0.0565 -0.0047 0.002 -0.0067 0.0077 0.0006 0.0002 0.0006 VAT -0.0795 -0.0077 0.0021 -0.0098 0.0069 0.0006 0.0002 0.0006 PCT -0.047 -0.0029 0.0036 -0.0066 0.0171 0.001 0.0004 0.001 PCOT 0.0662 0.0003 0 0.0003 0.005 0 0 0 Total Indirect Taxes -0.0627 -0.0111 0.0149 -0.026 0.0105 0.0017 0.0018 0.0011
Notes: Asymptotic standard errors estimated by DAD are in italic.
Table 3: S-Gini Indices for Taxes (ρ=2) (Expenditure) Kakwani Index TR Progression Reynolds-Smolensky Index, IR Progression Horizontal Inequity Atkinson-Plotnick Index Redistribution VAT1 -0.1416 -0.0001 0 -0.0001 0.0074 0 0 0 VAT8 -0.1449 -0.0019 0 -0.002 0.0077 0.0001 0 0.0001 VAT18 0.069 0.0071 0.0003 0.0067 0.0043 0.0006 0 0.0006 VAT 0.041 0.0049 0.0003 0.0046 0.0034 0.0006 0 0.0006 PCT 0.0515 0.004 0.0012 0.0027 0.0142 0.0012 0 0.0012 PCOT 0.119 0.0006 0 0.0006 0.0048 0 0 0 Total Indirect Taxes 0.0473 0.0107 0.0036 0.0071 0.0075 0.002 0.0001 0.002
139 Incidence Analysis with Effective Tax Rates
Effective Tax Rate Estimation Using Input-Output Tables
Ahmad and Stern (1991) provide a method for estimating effective tax rates using Input-Output (I-O) Tables, so that researchers can take into account not only taxation on final consumption goods but also taxation on intermediary goods. Rajemison et al. (2003) is the first work to make use of effective tax rates to allocate tax burdens to households. They overcome an important drawback of standard incidence analysis in terms of excluding taxes on imports and inputs from the analysis.
Rajemison et al. (2003) examine indirect tax incidence in Madagascar by estimating effective tax rates using I-O tables. However, the effective tax rates estimated are marginal rates, which show the marginal impact of a change in a tax rate on the distribution of welfare. Since we focus on average tax incidence, we use a simpler model (discussed below) to calculate effective tax rates.
We have input-output tables including the tax payments of each sector for import duties, purely domestic taxes (such as PCT and PCOT), VAT on domestic goods and VAT on imported goods15. Hence, we calculate four effective tax rates using I-O tables. The formula in matrix form for the effective tax rates are given below:
A VAD D VAT D VAT D VAT_ e _ ' _ '* * 2 '* _ ' _ _M VAT M VAT M M VAT e A S S Se ' '* 1 '* ' D M D De
where e indicates effective rate and prime indicates row vectors. VAT_D, VAT_M, S and D are the nominal tax rates16 for VAT on domestic goods, VAT on imported goods,
15 1998 I-O tables provide only one VAT table. However, by using the shares of each I-O sector’s share for imported and domestic goods, we have produced two I-O tables for VAT paid by each sector: VAT on imported goods and VAT on domestic goods.
140 domestic taxes and import duties respectively. These are Jx1 vectors, where j is the number of industries in the IO table, VAD is the diagonal matrix with each industry’s unit value added on the diagonal. A is the technical coefficient matrix for domestic inputs from industry i to industry j (aij) ; and M (mij) is the technical coefficient for imported inputs. A and M are JxJ
matrices. In Turkey, VAT on imported goods is applied to the post-duty price. Therefore, to obtain an effective tax rate for VAT on imported goods, we use the technical coefficient matrix (M2) attained from the Input-Output Table for imported goods after duty prices instead of the table at cif prices (M1).
Although we estimate VAT rates on imported goods and import duty rates for I-O industries, HICES expenditure survey does not provide the origin (imported or domestic) of the goods purchased by households. However, we can use I-O tables to attain households’ consumption share of imported and domestic goods for each I-O industry to overcome this drawback. Therefore, we use calculated effective tax rates weighted by domestic and import shares of sectors.
We use 1998 Turkey I-O Tables to estimate effective tax rates for each industry to examine indirect tax incidence17. Hence, we assume that from 1998 to 2003 no structural change had happened in the Turkish economy. The 1998 I-O table has 97 sectors; we aggregate some I-O sectors to match the consumption goods in the 2003 HICES expenditure survey. After this aggregation process, we end up with 88 sectors.
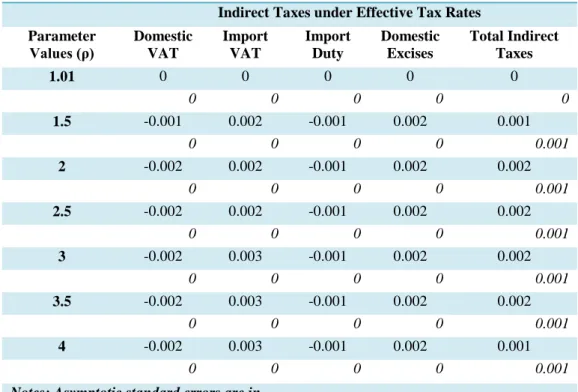
Results
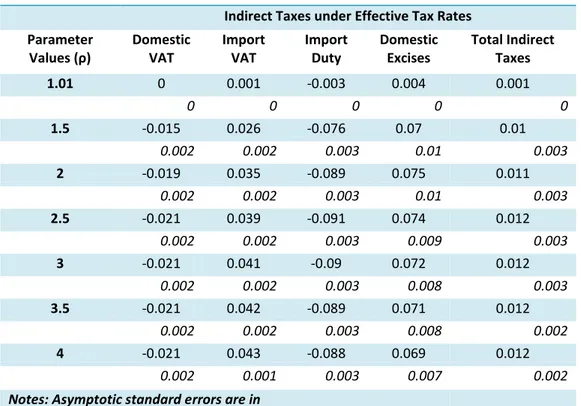
The estimated effective tax rates and the nominal rates by I-O industries are presented in Table 1 in Appendix 2. S-Gini Indices of progressivity and redistribution for ρ =2 are given in Tables 4 and 5. The results with all ranges of the inequality aversion parameter are provided in the tables (from TableA 7 to TableA 12) in Appendix 1. Let’s first discuss the results with household expenditure. Both VAT on imported goods and domestic taxes are progressive as their progressivity indices are positive for all values of ρ. Yet, progressivity
17 2002 IO Tables were released after we have finished the analysis. However, we do not expect very big structural changes from 1998 to 2002 which could have an impact on the results.
141 rates for domestic goods fall as we focus more on the poor. This finding is consistent with the standard analysis for the most important excise tax, PCT. However, VAT on domestic goods, which we found to be progressive with the legal tax rates, is regressive. The reason for this difference between the two analyses can be understood when we check the effective tax rates on food products which are higher than the legal rates (1 and 8%). Overall, VAT was found to be progressive under the standard analysis thanks to the differentiated and lower rates on food products. The higher effective rates on food products can be explained by taxation on intermediary goods and services.
Import duty is also regressive and the explanation for this finding may also be the high taxation on imported food products. But as can be seen from the tables in Appendix 1, the regressivity rates take the highest values for the middle of the distribution, yet decrease with the inequality aversion parameter, since poorer people consume imported food products less. In line with the standard analysis, the total indirect taxes are progressive under household expenditure. For the total progressive impact, both TR and IR progressivity rates take the smallest value for 1.01 of ρ, and then increase with ρ up to 2 and stay constant.
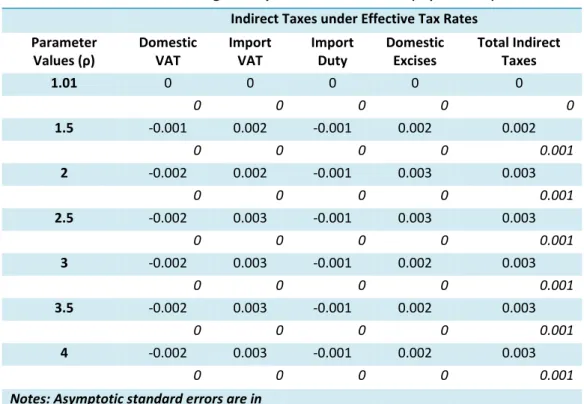
When we consider household income as a welfare indicator, all taxes are regressive and regressivity increases with values of ρ, suggesting that the poor are more affected by the negative impact of indirect taxes. The degree of regressivity with the effective rates is higher than that of the statutory rates. As explained above, this happens mainly because of the tax rates on food products.
The redistributive impact of the indirect taxes with effective tax rates on expenditure inequality is around 0.15% when ρ=2 (it was around 0.7% with statutory tax rates) which is lower than the impact with statutory rates and negligible, whereas the negative impact on income inequality ranges from 0.07% for the smallest ρ, to 3% for the highest ρ. The inequality increasing impact of indirect taxes on income inequality was 4% for the highest ρ with the standard incidence analysis. We think this difference comes from the high effective tax rates on fuel. With the help of Input-Out Tables we could see the bigger share of taxation in the final price of goods, whereas with the standard analysis we could examine only the domestic legal rates on final goods. Fuel is a good that is mostly imported
142 and is also both a final and intermediary product for many goods and services (transportation). Since higher income households consume relatively more of these goods and services, the tax liabilities of these households due to the fuel goods and transportation services are higher with the effective tax rates than the statutory rates. As a result of this, the degree of negative redistributive impact is found to be lower with the effective tax rates than that with the legal rates on final goods.
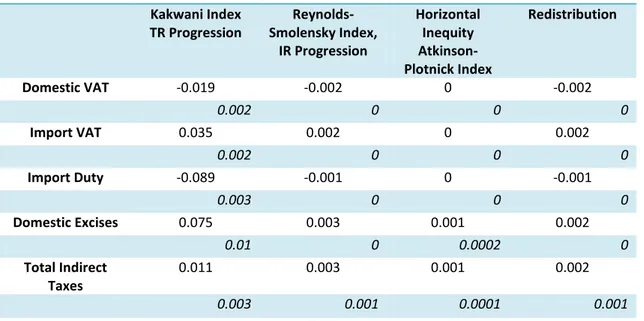
Table 5: S-Gini Indices for Taxes (ρ=2) (Expenditure) Kakwani Index TR Progression Reynolds-Smolensky Index, IR Progression Horizontal Inequity Atkinson-Plotnick Index Redistribution Domestic VAT -0.019 -0.002 0 -0.002 0.002 0 0 0 Import VAT 0.035 0.002 0 0.002 0.002 0 0 0 Import Duty -0.089 -0.001 0 -0.001 0.003 0 0 0 Domestic Excises 0.075 0.003 0.001 0.002 0.01 0 0.0002 0 Total Indirect Taxes 0.011 0.003 0.001 0.002 0.003 0.001 0.0001 0.001
Notes: Asymptotic standard errors estimated by DAD are in italic.
Table 4: S-Gini Indices for Taxes (ρ=2) (Income) Kakwani Index TR Progression Reynolds-Smolensky Index, IR Progression Horizontal Inequity Atkinson-Plotnick Index Redistribution Domestic VAT -0.14 -0.01 0 -0.01 0.005 0 0 0 Import VAT -0.092 -0.005 0 -0.005 0.005 0 0 0 Import Duty -0.191 -0.002 0 -0.002 0.004 0 0 0 Domestic Excises -0.024 -0.001 0 -0.001 0.013 0 0 0 Total Indirect Taxes -0.106 -0.019 0.006 -0.025 0.006 0.001 0.0003 0.001
143 Conclusions
This article’s main aim was to examine the redistributive impact of Turkish indirect taxes. In order to do this, in addition to the estimations of tax burdens with statutory tax rates, effective tax rates have been estimated by using Input-Output tables which allowed us to take into account the taxation on intermediary and imported goods.
The results have shown that the incidence of indirect taxes is sensitive to the welfare indicator chosen. While the total indirect taxes are progressive with household expenditure, the taxes become regressive with household income as a welfare indicator. As discussed previously, inequality is generally underestimated with household expenditure as it does not take into account savings and wealth accumulation. However, there has been a trend of using household expenditure to rank the households particularly for developing countries. The main reason for this choice concerns generally the data quality issues and the lack of regular income earning opportunities for the poor. Using expenditure may prevent researchers from overestimating poverty, but at the same time this may lead them to underestimate the gap between the poorest and the richest. Hence, as our results have shown, the sensitivity analyses should be performed over choices which may be arbitrary and analyses using only one welfare indicator should be approached with caution
According to the results, the most progressive tax in Turkey with higher redistributive impact is VAT under household expenditure because of its larger share in household expenditure, even if PCT and PCOT are distributed more unequally than VAT in favour of the poor. Although the redistributive impact from total indirect taxes is positive for the whole range of the inequality aversion parameter, the extent of redistribution is quite limited: the indirect taxes generate a less than one per cent reduction in expenditure inequality.
When we use household income, all indirect taxes are regressive, except PCOT, and the most regressive impact is felt by the poor. Total indirect taxes increase income inequality with greater inequality aversion. The indirect tax incidence with effective tax rates is less progressive in the case of household expenditure and more regressive in the case of household incomes, because of the impact of taxation on imported and intermediate goods.
144 Domestic excises have been found to be progressive with household expenditure, which is consistent with the standard incidence analysis. However VAT on domestic goods is regressive in contrast with the standard analysis. This finding is important in the sense that focusing only on the taxation on domestic goods and final goods may underestimate the tax burden on households. While import duty is regressive, VAT on imported goods is progressive. Indirect taxes with effective tax rates become regressive with income in line with the standard indirect tax incidence.
The paper also provides some considerations regarding the importance of the measurement methods for progressivity. According to the results, PCT and PCOT seem to help decrease perverse effects of indirect taxes on inequality as they are distributed more unequally than gross expenditures or incomes in favour of the poor (TR progressivity). However, since the share of these taxes in poorer households’ tax burden is limited, the final redistributive impact from these taxes is not as strong as the redistributive impact from VAT, which is on all goods that the poor consume. If we pay attention only to the distribution of tax liabilities, as most studies in this area do, we may end up advising higher rates for PCT and PCOT to correct inequalities. However, this policy change would not be able to improve the tax burden of households with low incomes. Therefore, the second requirement of progressivity (IR progressivity and redistributive impact) should be taken into account in tax incidence analyses.
Another important point on measurement issues concerns employing the inequality aversion parameter to measure inequalities and progressivity of government policies. The results show that the degree of progressivity and redistribution changes with the ethical parameter. If the welfare level of the poorer matters to the society, the measurement procedure giving the opportunity to focus on the poor is valuable and policy advice from this sort of analysis should be different from that based on an analysis which takes the society as a homogenous unit.
As a final point, we would like to discuss possible policy advice. It is clear that indirect taxes are the main revenue sources because of limited coverage of direct taxes, especially income tax (both personal and corporation tax) for Turkey. Indirect taxes offer an easier way to raise revenue for governments with less administrative and, more importantly,
145 political cost, as people do not realise how much indirect tax they pay when the tax comes with the prices. It seems that Turkish governments have been enjoying this convenient way of collecting taxes for 30 years and there is very little evidence that they are changing this habit. However, as this paper has indicated, unless the tax burden on poorer households is reduced, the indirect taxes will keep having a negative impact on inequalities in Turkey. In order to prevent this, there should be more serious efforts at expanding the tax base for the direct taxes, which are progressive, by decreasing informal employment and tax evasion.
References
Albayrak, O. (2009). Redistributive Effects of Fiscal Policies in Turkey, 2003, unpublished PhD Thesis, The Nottingham School of Economics, (available online at http://etheses.nottingham.ac.uk/923/1/PHDTHESISFINAL.pdf)
Albayrak, Ö. (2010). Optimal Vergi Teorisi: Bir Değerlendirme. In Kose and Pınar (eds),
İzzentin Onder’e Armağan (forthcoming), SAV Yayınları, İstanbul
Allison, P. D. (1978). Measures of inequality. American Sociological Review, 43(6), 865-880. Anand, S. & C. J. Haris, (1994). Choosing a Welfare Indicator, The American Economic Review,
84(2), 226-231.
Atkinson, A. B. (1970). On the measurement of inequality. Journal of Economic Theory, 2, 244-263
Besley, T., (1995). “Nonmarket Institutions for Credit and Risk Sharing in Low-Income Countries”, Journal of Economic Perspectives, 9(3), pp.115-127
Bourguignon F. and L. A. P. da Silva (2003). The Impact of Economic Policies on Poverty and
Income Distribution: Evaluation Techniques and Tools. (eds.) Washington, DC: World
Bank and Oxford University Press
Bulutoglu, K. and W. Thirsk (1997). Turkey’s struggle for a better tax system. In Thirsk (eds.),
Tax Reform in Developing Countries, World Bank, Regional and Sectoral Studies.
146 Chu, K., H. Davoodi & S. Gupta (2000). Income distribution and tax and government policies
in developing countries. IMF Working Paper, WP/00/62
Creedy, J. (1998). The Dynamics of Inequality and Poverty. Edward Elgar, Cheltenham, UK Davidson, R. & J.Y. Duclos (1997). Statistical Inference for the Measurement of the Incidence
of Taxes and Transfers. Econometrica, 65(6), 1453-1466.
Deaton, A. (2000). The Analysis of Household Surveys: A Microeconometric Approach to
Development Policy. The Johns Hopkins University Press for The World Bank,
Washington D.C.
Deaton, A. & S. Zaidi (2002). Guidelines for Constructing Consumption Aggregates for Welfare Analysis. Living Standards Measurement Study (LSMS) Working Paper, No. 15, The World Bank, Washington D.C.
Devarajan, S. & S. I. Hossain (1998). The Combined Incidence of Taxes and Public Expenditures in the Philippines. World Development, 26(6), 963-977.
Duclos, J. Y. & A. Arrar (2006). Poverty and Equity: Measurement, Policy and Estimation with
DAD. Springer and International Development Research Centre. (also available at ,
http://www.idrc.ca/en/ev-97152-201-1-DO_TOPIC.html)
Duclos, J-Y. (2000). Gini Indices and the Redistribution of Income. International Tax and
Public Finance, 7(2), 141-162
Emran, M. S., & J. E. Stiglitz (2005). On Selective Indirect Tax Reform in Developing Countries.
Journal of Public Economics, 89.
Emran, M. S., &J. E. Stiglitz (2007). Equity and Effciency in Tax Reform in Developin Countries. Working Papers, Columbia and George Washington University (available at: SSRN: http://ssrn.com/abstract=1001269)
Fellman, J. (1976). The effect of transformations of Lorenz Curves. Econometrica, 44 (4), 823-824.
147 Fields, G. S. (1980). Poverty, Inequality and Development, Cambridge: Cambridge University
Press.
Friedman, M. (1957). A Theory of the Consumption Function, USA: Princeton University Press. Gemmel N., and O. Morrissey (2003). Tax structure and the incidence on the poor in
developing countries. CREDIT Research Paper, No.03/18, (available at, http://venus.icre.go.kr/metadata/31628_CP03-18.pdf, -accessed on 12.03.3008) Gottschalk, P., and T. M. Smeeding (1997). Cross-National Comparisons of Earnings and
Income Inequality. Journal of Economic Literature, 35, 633-687
Gradin, C., O. Canto & C. Del Rio (2008). Inequality, poverty and mobility: Choosing income Or consumption as welfare indicators. Investigaciones Económicas, 32(2), 169-200 Jacobson, U. (1976). On the measurement of the degree of progressivity. Journal of Public
Economics, 5, 161-168.
Johnson, D. S. & T. Smeeding (1998). Measuring the trends in inequality of individuals and families: Income and consumption. Bureau of Labor Statistics
Jenkins, S. (1991). The measurement of inequality. In Osberg (eds.), Economic Inequality and
Poverty, M. E. Sharpe, Inc. London. 3-39.
Kakwani, N. (1986). Analyzing Redistribution Policies: A Study Using Australian Data. Cambridge University Press
Lambert, P. J. (1993). The Distribution and Redistribution of Income. Second Edition, USA: Manchester University Press
Mankiw, N. G. M. Weinzierl, & D. Yagan (2009). Optimal taxation in theory and practice.
Journal of Economic Perspectives, 23(4), 147–174.
Mitra, P. & R. Yemtsov (2007). Increasing inequality in transition economies: Is there more to come?. In Bourguignon, F. and B. Pleskovic (eds.), Beyond Transition: Annual World
Bank Conference on Development Economics, Regional, World Bank, Washington D.C.
148 OECD (2008). Growing Unequal? Income Distribution and Poverty in OECD Countries. OECD,
Paris
Osberg, L. (1991) (eds.). Economic Inequality and Poverty. M. E. Sharpe, Inc. London
Penalosa, C. G., & S. J. Turnovsky (2005). Second Best Optimal Taxation of Capital and Labor in a Developing Economy. Journal of Public Economics, 89.
Pinar, A., (2004). Who Pay Taxes and Who Benefit from Government Spending (in Turkish), Research Report for TESEV: İstanbul.
Pinar, A., (2005). Devlet Bütçesi Topluma Nasıl Yansıyor?. Siyasa, 1(1), 45-60
Rajemison, H., S. Haggblade & S. D. Younger (2003). Indirect Tax Incidence in Madagascar: Uptaded Estimates Using the Input-Output Table. Cornell Food and Nutrition Policy
Program Working Paper No. 147, (available at http://papers.ssrn.com/sol3/papers.cfm?abstract_id=452120, -Accessed on 15.02.2009)
Sahn , D. E., & S. D. Younger (1998). Fiscal incidence in Africa, micro economic evidence.
Cornell Food and Nutrition Policy Program Working Paper No. 91, Ithaca, NY, (available
at http://pdf.dec.org/pdf_docs/Pnacm774.pdf, -accessed on 15.02.2009)
Sahn, D. E. & S. D. Younger (2003). Estimating the incidence of indirect taxes in developing countries. In Bourguignon and Pereira da Silva (eds), The Impact of Economic Policies
on Poverty and Income Distribution: Evaluation Techniques and Tools, Washington, DC:
World Bank and Oxford University Press. 27-41.
Sen, A. K. (1997). On Economic Inequality,UK: Oxford University Press.
Shorrocks, A. F., (1988). Aggregation issues in inequality measurements. In Eichhorn (ed.),
Measurement of Inequality in Economics: Theory and Applications of Economic Indices,
SpringerVerlag, New York, (also available at
http://www.integra2000.unifi.it/dpssec/sviluppo/doc/Shorrocks1_Shorrocks.pdf -accessed on 23.01.2009)
149 State Planning Organisation, Economic and Social Indicators 1950-2006,
http://ekutup.dpt.gov.tr/ekonomi/gosterge/tr/esg.asp
Tanzi, V., and H. H. Zee (2000). Tax policy for emerging markets: Developing countries.
National Tax Journal, 53 (2).
Thirsk, W. (1997) (ed.). Tax Reform in Developing Countries, World Bank, Regional and Sectoral Studies.
Undersecretariat of the Prime Ministry for Foreign Trade, “Foreign Trade Statistics”, http://www.dtm.gov.tr/dtmweb/index.cfm?action=detayrk&yayinID=1116&icerikID=1 225&dil=TR
Yitzhaki, S. (1983). On an extension of the Gini inequality index. International Economic
Review, 24(3), 617-628.
Younger, S. D., D. E. Sahn, S. Haggblade and P. A. Dorosh (1999). Tax incidence in Madagascar: An analysis using household data. The World Bank Economic Review,
13(2), 303-331
Zenginobuz, E. Ü., Adaman, F., Gökşen, F., Savcı, Ç. And Tokgöz, M. E. (2010). Vergi,
Temsiliyet ve Demokrasi İlişkisi Üzerine Türkiye'de Vatandaşların Algıları, Boğaziçi Üniversitesi Araştırma Metinleri, ISS/EC 2010-03, (available at, http://www.econ.boun.edu.tr/content/wp/EC2010_03.pdf)
150 APPENDIX 1
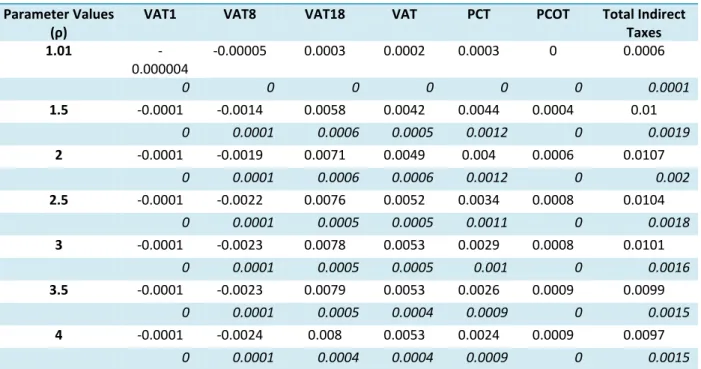
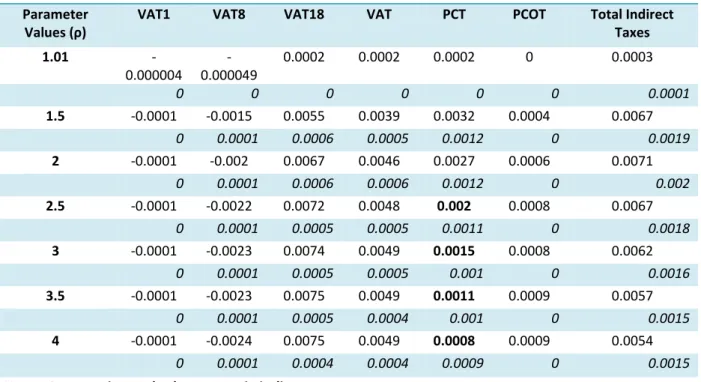
Table A1: S-Gini Indices of TR-Progressivity for the Indirect Taxes (expenditure) Parameter Values
(ρ)
VAT1 VAT8 VAT18 VAT PCT PCOT Total Indirect
Taxes 1.01 -0.0047 -0.0036 0.0025 0.0017 0.0038 0.0016 0.0025 0.0003 0.0003 0.0002 0.0001 0.0006 0.0002 0.0003 1.5 -0.1143 -0.1076 0.0562 0.0347 0.0569 0.0752 0.0444 0.0066 0.0069 0.0043 0.0034 0.0134 0.0042 0.0073 2 -0.1416 -0.1449 0.069 0.041 0.0515 0.119 0.0473 0.0074 0.0077 0.0043 0.0034 0.0142 0.0048 0.0075 2.5 -0.1495 -0.1609 0.0737 0.043 0.0438 0.1433 0.0462 0.0073 0.0074 0.0039 0.0032 0.013 0.0048 0.0068 3 -0.1513 -0.1691 0.0759 0.0439 0.0382 0.1579 0.045 0.0071 0.0071 0.0035 0.003 0.012 0.0048 0.0063 3.5 -0.1508 -0.1736 0.077 0.0443 0.0343 0.1673 0.044 0.0069 0.0069 0.0033 0.0028 0.0113 0.0047 0.0059 4 -0.1492 -0.1761 0.0775 0.0444 0.0315 0.1737 0.0431 0.0068 0.0067 0.0031 0.0027 0.0108 0.0047 0.0056
Notes: Asymptotic standard errors are in italic. Gross expenditure is equal to household expenditure the data provided, net expenditure is equal to gross expenditure minus indirect tax burden
The null hypothesis could not be rejected for the values in bold at 5% significance level
Table A2: S-Gini Indices of IR-Progressivity for the Indirect Taxes (expenditure) Parameter Values
(ρ)
VAT1 VAT8 VAT18 VAT PCT PCOT Total Indirect
Taxes 1.01 -0.000004 -0.00005 0.0003 0.0002 0.0003 0 0.0006 0 0 0 0 0 0 0.0001 1.5 -0.0001 -0.0014 0.0058 0.0042 0.0044 0.0004 0.01 0 0.0001 0.0006 0.0005 0.0012 0 0.0019 2 -0.0001 -0.0019 0.0071 0.0049 0.004 0.0006 0.0107 0 0.0001 0.0006 0.0006 0.0012 0 0.002 2.5 -0.0001 -0.0022 0.0076 0.0052 0.0034 0.0008 0.0104 0 0.0001 0.0005 0.0005 0.0011 0 0.0018 3 -0.0001 -0.0023 0.0078 0.0053 0.0029 0.0008 0.0101 0 0.0001 0.0005 0.0005 0.001 0 0.0016 3.5 -0.0001 -0.0023 0.0079 0.0053 0.0026 0.0009 0.0099 0 0.0001 0.0005 0.0004 0.0009 0 0.0015 4 -0.0001 -0.0024 0.008 0.0053 0.0024 0.0009 0.0097 0 0.0001 0.0004 0.0004 0.0009 0 0.0015
Notes: Asymptotic standard errors are in italic.
The null hypothesis could not be rejected for the values in bold at 5% significance level
Gross expenditure is equal to household expenditure the data provided, net expenditure is equal to gross expenditure minus indirect tax burden
151 Table A3: S-Gini Indices of Redistribution for the Indirect Taxes (expenditure)
Parameter Values (ρ)
VAT1 VAT8 VAT18 VAT PCT PCOT Total Indirect
Taxes 1.01 -0.000004 -0.000049 0.0002 0.0002 0.0002 0 0.0003 0 0 0 0 0 0 0.0001 1.5 -0.0001 -0.0015 0.0055 0.0039 0.0032 0.0004 0.0067 0 0.0001 0.0006 0.0005 0.0012 0 0.0019 2 -0.0001 -0.002 0.0067 0.0046 0.0027 0.0006 0.0071 0 0.0001 0.0006 0.0006 0.0012 0 0.002 2.5 -0.0001 -0.0022 0.0072 0.0048 0.002 0.0008 0.0067 0 0.0001 0.0005 0.0005 0.0011 0 0.0018 3 -0.0001 -0.0023 0.0074 0.0049 0.0015 0.0008 0.0062 0 0.0001 0.0005 0.0005 0.001 0 0.0016 3.5 -0.0001 -0.0023 0.0075 0.0049 0.0011 0.0009 0.0057 0 0.0001 0.0005 0.0004 0.001 0 0.0015 4 -0.0001 -0.0024 0.0075 0.0049 0.0008 0.0009 0.0054 0 0.0001 0.0004 0.0004 0.0009 0 0.0015
Notes: Asymptotic standard errors are in italic.
The null hypothesis could not be rejected for the values in bold at 5% significance level
Gross expenditure is equal to household expenditure the data provided, net expenditure is equal to gross expenditure minus indirect tax burden
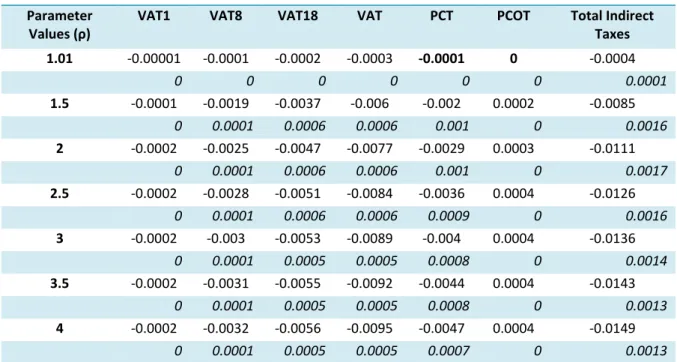
Table A4: S-Gini Indices of TR-Progressivity for the Indirect Taxes (income) Parameter
Values (ρ)
VAT1 VAT8 VAT18 VAT PCT PCOT Total Indirect
Taxes 1.01 -0.0075 -0.0065 -0.0021 -0.0027 -0.0012 0.0002 -0.002 0.0003 0.0003 0.0003 0.0003 0.0006 0.0002 0.0004 1.5 -0.1954 -0.1718 -0.0453 -0.0621 -0.0323 0.0365 -0.0477 0.0071 0.0077 0.0071 0.0063 0.0159 0.0042 0.0098 2 -0.2569 -0.2302 -0.0565 -0.0795 -0.047 0.0662 -0.0627 0.0083 0.0089 0.0077 0.0069 0.0171 0.005 0.0105 2.5 -0.2842 -0.2594 -0.0616 -0.0878 -0.0572 0.0828 -0.071 0.0086 0.009 0.0073 0.0067 0.0161 0.0053 0.01 3 -0.2986 -0.2769 -0.0647 -0.0927 -0.065 0.0923 -0.0766 0.0087 0.0089 0.007 0.0064 0.0152 0.0054 0.0094 3.5 -0.3068 -0.2885 -0.0667 -0.096 -0.0711 0.0977 -0.0808 0.0089 0.0088 0.0068 0.0063 0.0145 0.0055 0.009 4 -0.312 -0.297 -0.0682 -0.0984 -0.076 0.1009 -0.0839 0.009 0.0087 0.0066 0.0062 0.014 0.0057 0.0088
Notes: Asymptotic standard errors are in italic.
The null hypothesis could not be rejected for the values in bold at 5% significance level
Gross income is equal to net disposable income, net income is equal to net disposable income minus indirect tax burden