A COMPARATIVE STUDY OF TURKEY’S OUTPUT GAPS IN THE
RECESSIONS
*Doç. Dr. Harun Öztürkler Doç. Dr. Türkmen Göksel Kırıkkale Üniversitesi Ankara Üniversitesi İktisadi ve İdari Bilimler Fakültesi Siyasal Bilgiler Fakültesi
● ● ● Abstract
An effective set of monetary, fiscal, and income policies can only be formulated on the basis of a correct estimation of the position of an economy in a cycle. Output gap estimation provides an important tool for predicting the position of the economy. In this paper, we measure output gap for the Turkish Economy for the period between 2000Q1 and 2013Q4, using production function approach and quarterly data. We utilize two definitions of recession: According to the first definition, we refer a period as recession if output gap as a percent of potential GDP takes negative values for at least two consecutive quarters, while NBER definition refers to a period as recession if we observe at least two consecutive quarters of negative real GDP growth rates. On the basis of first definition we find that the imported crisis lasts shorter but costs more in terms of output gap; while on the basis of NBER definition, the imported crisis lasts longer and costs more in terms of negative real GDP growth.
Keywords: Potential GDP, Output gap, Production function approach, Recession, Turkey Türkiye’deki Çıktı Açıklarının Resesyon Dönemlerinde Karşılaştırılması
Öz
Etkin para, maliye ve gelir politikaları ekonominin bir çevrimdeki yerinin ancak doğru tahmin edilmesi ile uygulanabilir. Çıktı açığı bir ekonominin döngüdeki yerinin tahmini için önemli bir araçtır. Bu makalede üretim fonksiyonu yöntemi ve çeyrek dönemlik veriler kullanılarak Türkiye ekonomisi için 2000Q1-2013Q4 periyodunda çıktı açığı ölçülmüştür. Çalışmada iki farklı resesyon tanımı ele alınmıştır. İlk olarak resesyon çıktı açığının potansiyel GDP‟ye olan oranının en az iki ardışık çeyrekte negatif değerler alması şeklinde tanımlanmıştır. İkinci olarak, GDP büyümesinin en az iki ardışık çeyrekte negatif olmasını içeren NBER tanımı kullanılmıştır. Çıktı açığı tanımının kullanıldığı ilk kriz tanımına göre dış kaynaklı kriz daha kısa sürmüş fakat daha maliyetli olmuştur. NBER tanımına göre ise dış kaynaklı kriz daha uzun sürmüş ve daha maliyetli olmuştur.
Anahtar Sözcükler: Potansiyel GDP, Çıktı açığı, Üretim fonksiyonu yöntemi, Resesyon, Türkiye
*Makale geliş tarihi: 15.08.2014 Makale kabul tarihi: 30.03.2015
A Comparative Study of Turkey’s Output Gaps
in the Recessions
Introduction
The importance of output gap and its timely measure come from the fact that it can serve as a guide to macroeconomic policy design. This is because, as Bukhari and Khan (2008) point out, output gap estimates can signal cyclical position of the economy by providing information on inflationary or contractionary pressures. The knowledge of the position of an economy in the cycle is invaluable information based on which a counter cyclical economy policy can be formulated. Therefore, the output gap is considered to be a key indicator of future economic activity and it has an important role in formulation of monetary, fiscal, and income policies.1 In addition, as Gibbs (1995) suggests, if the measure of output gap is reliable, it can provide an important guide in determining whether developments in real economy are consistent with the sustenance of price stability. For example, in a recent paper Goyal and Arora (2013) measure potential output growth and use it to drive the Indian monetary policy stance. As stressed by Pybus (2011) in his study of United Kingdom‟s historical output gap, estimates of the output gap during comparable stages of previous recessions can be helpful in evaluating the plausibility of estimates of the current level of the gap and how it might be expected to evolve over time. Moreover, in their study of five old and five new members of European Union, Titan and Georgescu (2013) show that output gap can be used to investigate macroeconomic stability in general and business cycle dynamics in particular. On the other hand, potential output and output gap can also be used to study specific macroeconomic issues. For instance, Johnson (2013) argues that potential output is a key factor for debt sustainability analysis and for developing strategies for growth. Structural policy changes also require a
1Dore (1995, p.217) asserts that “an income policy may be the answer to reducing the ravages of business cycles and consequent stop and go policies that accompany it”.
correct measure of output gap. As an example, Odor and Kucserova (2014) point out that changes in European fiscal framework have strengthen the role of structural budged balances, which rest on output gap calculations. They provide estimates of output gap for Slovakia and stress that with the adaption of Fiscal Compact in European Union new procedures are entering into correction mechanisms, and the new framework will be credible only if meaningful estimates of output gap are available.
In this paper, we measure output gap for the Turkish Economy for the period between 2000Q1 (first quarter of 2000) and 2013Q4 (fourth quarter of 2013), using production function approach and quarterly data. Measuring output gap for the Turkish economy for the mentioned period has a twofold aim. Firstly, providing a measure of output gap for the Turkish economy can provide an important guide in determining macroeconomic policy which can play important role in shaping the length of recovery. Since Turkey has experienced severe economic crises in recent history, its economic performance in the last decade provides motivation for the measurement of output gap, and it is crucial for setting economic policies to have a stable and sustainable per capita income growth level in the future. Hence, updating this framework can be an important guide for policy makers in order to determine the position of the economy. The second goal is to compare relatively recent recessions, homemade (2001) and imported (2008/2009), in Turkey in terms of real economic activity.
The paper is organized as follows: Section 2 presents the theoretical approach to output gap estimation. Section 3 reports empirical findings, discussions and the comparison of 2001 and 2008/2009 crises. Finally, section 4 concludes.
1. Theoretical Approach to Output Gap
Estimation
Given the quantity and quality of its factors of production and the level of technology, potential output is the level of activity that an economy can sustain. As reported by Gerlach (2011), The Economist used the term potential
output for the first time in 1911 and the term output gap for the first time in
1964. The output gap is simply the difference between actual output and potential output. However, there are many different definitions, emphasizing different aspects and phases of the deviations of actual output from potential output. Given its importance, the output gap has been the focus of considerable research effort in the economics literature. The center of attention in this research effort has been on various techniques for estimating potential output. A better measure of potential output will help to eliminate significant
uncertainties associated with output gap. Different sets of assumptions can be used in combination with various econometric techniques to provide different measures of the output gap. There are four main approaches to the measurement of potential output: i) univariate non-structural approach, studying the univariate properties of real GDP; some examples are peak to peak method, linear trending, Hodrick-Prescott Filter, Beveridge-Nelson decomposition, and unobservable component method; ii) direct measures, using survey data; iii)
structural methods, some examples are production function approach and
Okun‟s law approach, defining potential output on the basis of the natural rate of unemployment; and iv) multivariate non-structural approach; defining potential output in relation with the other macroeconomic magnitudes, such as inflation and unemployment; some examples are multivariate Beveridge Nelson decomposition, multivariate Hodrick-Prescott filter, and multivariate unobservable components method.
The theoretical work differs according to conceptualization of the dynamics of potential output and the output gap. Therefore, the theoretical approach to output gap naturally starts with its definition. Since Artus (1977) defines potential output as the level of output that would be realized if the labor force were fully employed, output gap is the difference between the level of actual output and full employment level of output. However, from the perspectives of monetary economists, the potential output is typically defined as the level of output that is consistent with the state of economy without inflation pressure. Therefore, output gap will be the difference between actual output and “non-inflation accelerating” level of output. In this case, Phillips (1958) curve constructs the transmission path between financial and real sectors of the economy.
From a purely theoretical perspective, the discussion of the concept of output gap can be classified as Keynesian standpoint, based on Okun (1962), and monetarist standpoint, based on Friedman (1968).2 Okun defined the concept of gross national income (GNP) gap as the difference between potential and actual GNP. One must emphasize two facets of Okun‟s definition of the gap: The first important constituent of this definition is that it refers to GNP, rather than gross domestic product (GDP). Secondly, the potential refers to the level of GNP that can be produced without inflationary pressure. In monetarist setting of Friedman, in Lucas‟s (1972) words, the potential output concept refers to “the natural level of output” corresponding to “the natural rate
2For a discussion of output gap from Keynesian and monetarist standpoints, see Congdon (2008).
of unemployment”. More recently, Taylor (1993) rule revitalized the interest in measuring potential output although the concept itself was not used by Taylor.
On the other hand, there are also some criticisms of the concept of potential GDP. As pointed out by Plosser and Schwert (1979), even if there is an agreement on how to estimate potential output, there are still problems with meaning and usefulness of a supply side concept like potential output. According to Plosser and Schwert, it is not even an equilibrium concept since there is no relation with aggregate demand. For example, Raizin and Loungani (2005) argue that under the current level of globalization, policy makers may put a greater emphasis on reducing the inflation rate rather than on narrowing the output gaps.
1.1. Methodology: The Production Function Approach In this paper, we measure potential GDP and output gap for the Turkish Economy during the period of 2000Q1 and 2013Q4, using a structural method, namely production function approach. We first present our findings related to the potential GDP and output gap and then we compare 2001 (homemade) and 2008/2009 (imported) recessions on the basis of the two different definitions of recession. We utilize two definitions of recession: According to the definition developed in this paper, we refer a period as recession if output gap as a percent of potential GDP takes negative values for at least two consecutive quarters, while the United States National Bureau of Economic Research (NBER) definition refers to a period as recession if we observe at least two consecutive quarters of negative real GDP growth rates. For the reason that the 2001 recession was due to „home-made‟ financial crises, whereas the 2008/2009 recession was contagion from the global financial crisis; we provide a measure to evaluate economic developments in Turkish Economy and to figure out whether domestic financial fragilities or “imported” financial fragilities have more negative effect on real output.
We make use of production function approach to measure potential GDP and output gap in Turkey for the period 2000Q1 and 2013Q4. As it is standard in the literature, the economy is characterized by an aggregate Cobb-Douglas production function assuming constant returns to scale technology:
where is output; is total factor productivity (TFP); and and are
capital and labor inputs at period t, respectively. and denote
the capital and labor shares of output, respectively. We use quarterly real GDP data for output and total quarterly hours worked for labor input. Because real
capital input is not available, it is generated by the standard perpetual inventory model (among others see Epstein and Macchiarelli (2010) for details).3 The following equation is used to construct the real capital stock data:
where is a constant depreciation rate and is real investment. Data
used in the model for real GDP, real investment, and total annual hours worked are obtained from Turkish Statistical Institute.4 The depreciation rate is parameterized as 0.05 consistent with a vast empirical literature. For Turkey, Cicek and Elgin (2011) finds the depreciation rate as 0.047. There are some other empirical studies using different values in the range of 0.042 and 0.05 for Turkey. For example, depreciation rate is assumed to be equal to 0.042 in Altug et al. (2008) and 0.05 in Ismihan and Metin-Ozcan (2006)5. After this parametrization, real capital stock data is constructed using equation (2) by taking parameter value as 0.05 for depreciation rate, real investment data, and an initial value for real capital stock, .
After constructing data for capital stock, we also obtain total factor productivity data from equation (1):
Following the previous studies (e.g., Gollin (2002)) we set We
also carry out a sensitivity analysis for the values of α in the range of 0.25-0.50, and find that results are robust. In fact, there is almost a perfect correlation between output gap variables which are calculated by different values of α.6 Given all variables and parameters, our next step is to measure the potential output, . First, we remove the cyclical components of time series and
3Real GDP, total annual hours worked and real investment variables are seasonally adjusted.
4The data set of this study is available in Excel format for those who wish to replicate the results. Moreover, authors‟ calculations are available upon request.
5Our results are robust for different values in the range of 0.04 and 0.05. These results are available upon request.
by using the HP filter, and obtain series, and .7 Using and , we calculate potential output, as follows:8
Finally, we calculate output gap (YGAP) by subtracting potential output from current output:
We also calculate GDP Gap as a percent of potential GDP (henceforth “GDPGAP” stands for the term “GDP gap as percent of potential GDP”) as follows:
2. Empirical Findings
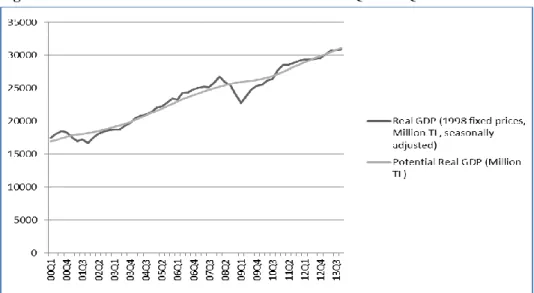
We begin this section by carrying out two visual analyses: First, we compare the actual real GDP (1998 fixed prices) and the potential real GDP for the period between 2000Q1 and 2013Q4 and depict the result in Figure 1. Second, we present the output gap as a percent of potential GDP for the same period in Figure 2. We, then, analyze the details of the sub-periods: 2001 and 2008/2009 recessions. We focus on the cost of these recessions in terms of output gap. As mentioned above, in this paper, we use two different definitions of a recession: The first definition we adopt is based on our calculation of output gap as a percent of potential GDP. In this definition we call a period as a recession if the output gap as a percent of potential GDP takes negative values for at least two consecutive quarters. The second definition we use is NBER definition. NBER calls a period as recession if we observe at least two consecutive quarters of negative real GDP growth rates. Based on these two definitions we compare the length of the two recessions during the period under investigation. We find that there are significant differences in terms of cost of a
7We set the smoothing parameter to 1600.
8Unlike the labor input, the capital input does not need to be cyclically adjusted to create a “potential” level. See Congressional Budget Office (2001) for more discussion.
crisis in Turkey during the period between 2000Q1 and 2013Q4 depending on which definition is used.
Figure 1 compares the actual real GDP and the potential GDP. This figure expressively captures both 2001 and 2008/2009 recessions. However, the most remarkable point to look at in the figure is the 2008/2009 recession, which reflects the effects of the global crisis on the Turkish economy. As it can be seen from the figure, following 2008/2009 recession, it takes until the end of 2013 for the actual real GDP to return back on its trend path.
Figure 1: Actual Real GDP and Potential Real GDP: 2000Q1-2013Q4
Source: Actual real GDP data is obtained from Turkish Statistical Institute Databank. Potential real GDP is calculated by authors as explained in the previous section.
Figure 2 shows the output gap as a percent of potential GDP for the entire period. The evolution of output gap represents a good picture of the Turkish economy. It captures 2001 and 2008/2009 recessions and the long boom period between these two crises.
Figure 2: GDP Gap as a percent of Potential GDP: 2000Q1-2013Q4.
Source: Authors‟ calculations using data in Figure 1.
Table 1 presents the sub-periods of the two recessions according to the two different definitions: As mentioned above, the first definition takes into account the movements in the GDP gap as percent of potential GDP and the second definition allows for the movements only in real GDP.
Table 1: Recessions between 2000Q1-2013Q4
1st definition: Recession Periods 2nd definition: Recession Periods 2001 Recession 2001Q1-2003Q4 (12 quarters) 2001Q2-2001Q4 (3 quarters) 2008/2009 Recession 2008Q3-2010Q3 (9 quarters) 2008Q4-2009Q3 (4 quarters)
As it can be seen from the Table 1, the definition we adapt here delivers a recession signal one quarter ahead of the signal provided with the NBER definition for both crises. In addition, the length of the crisis period is considerably shorter according to NBER definition when compared with our definition for both crises. Furthermore, according to NBER definition the imported crises last longer than the homemade crisis, whereas it is the reverse according to our definition.
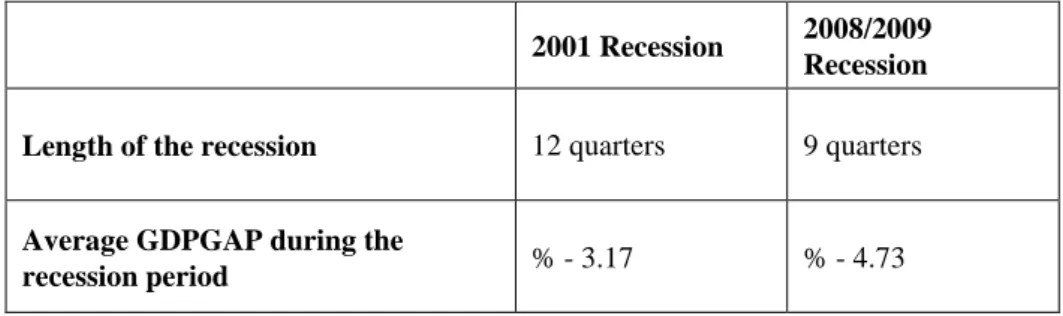
Now, we focus on the details of these two sub-periods of crises. Table 2 presents the details of the 2001 and 2008/2009 recessions according to the 1st definition.
Table 2: 2001 and 2008/2009 Recessions According to the 1st definition
2001 Recession 2008/2009 Recession
Length of the recession 12 quarters 9 quarters
Average GDPGAP during the
recession period % - 3.17 % - 4.73
Source: Authors‟ findings.
Similarly, Table 3 demonstrates the details of the 2001 and 2008/2009 recessions according to the 2nd definition.
Table 3: 2001 and 2008/2009 Recessions According to the 2nd definition
2001 Recession 2008/2009 Recession
Length of the recession 3 quarters 4 quarters
Average Growth Rate of Real GDP
during the recession period % - 7.56 % - 8.06
Source: Authors‟ findings.
As it can be seen from Table 2, when we consider our recession definition, the imported crisis is shorter but more costly than the homemade
crisis. As the Table 3 reveals, in accordance with the NBER definition, the imported crisis is both longer and more costly than the homemade crisis.
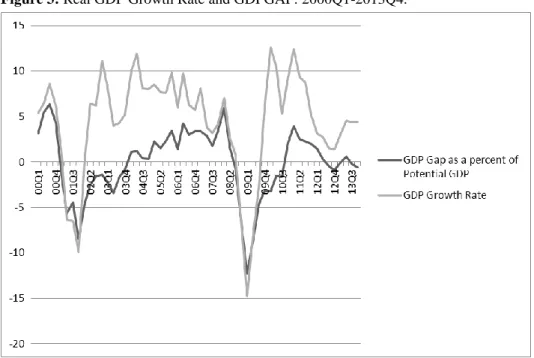
Figure 3 provides a clear visual picture of the developments of the growth rate of actual real GDP (relative to the same quarter in the previous year) and the GDPGAP.
Figure 3: Real GDP Growth Rate and GDPGAP: 2000Q1-2013Q4.
Source: Authors‟ calculations using data in Figure 1.
Figure 3 proves a visual picture of Table 2 and Table 3‟s records regarding the lengths and the costs of the two crises under consideration. The figure specifically shows that the imported crisis is much deeper than the homemade crisis. Moreover, as it can be seen from the figure, both GDPGAP and the growth rate of actual real GDP are significantly volatile during the boom period between the crises. This suggests that the boom period did not provide a smooth path of economic growth in Turkey. Finally, GDP growth rate measure shows an early recovery signal than GDPGAP. This means that it takes longer for potential GDP to recover after a crises period.
Furceri and Mourougane (2009) assess the impact of financial crises on potential on the basis of an estimate of a univariate autoregressive growth equation for an unbalanced panel of OECD countries over the period 1960 to 2007. Their results suggest that the occurrence of a financial crisis has a
negative and permanent effect on potential output. In particular, financial crises are estimated to lower potential output by around 1.5 to 2.4% on average.
In two relatively recent papers, Üngör (2012) and Alp et al. (2011) estimate the output gap for Turkey. Üngör (2012) also uses a production function approach, however he does not include the homemade recession (2001). Alp et al. (2011) estimate an output gap measure for Turkey in a Bayesian framework. Both studies exhibit a qualitatively similar pattern to our study. However, our findings differ from the other studies quantitatively. For instance, their findings and our findings show that 2009Q1 is the deepest quarter in terms of output gap as a percentage deviation from the potential output. However, Ünger (2012) and Alp et al. (2011) find that output gap as a percentage deviation from the potential output is 11.71 % and 11.84 %., respectively. This paper finds that output gap as a percentage deviation from the potential output is 12.27 %.
Conclusion
Potential output and output gap estimates are crucial in determining the position of the economy in the cycle, and therefore, in formulating counter cyclical monetary, fiscal, and income policies. Furthermore, an incorrect estimate can lead to policy over-or-under correction, which can put the economy away from its long-term sustainable growth path. In this paper, we measure potential GDP and output gap for the Turkish Economy for the period between 2000Q1 and 2013Q4, using production function based structural approach and utilizing quarterly data. We base our analyses on two different definitions of recession: According to the definition we develop here we call a period recession if output gap as a percent of potential GDP takes negative values for at least two consecutive quarters, while NBER definition refers to a period as recession if we observe at least two consecutive quarters of negative real GDP growth rates. On the basis of the first definition homemade (2001) and imported (2008/2009) crises cover the periods 2001Q1-2003Q4 and 2008Q3-2010Q3, respectively. On the other hand, on the basis of the NBER definition homemade and imported crises cover the periods 2001Q2-2001Q4 and 2008Q4-2009Q3, respectively.
We can summarize our findings as follows: First, both 2001 and 2008/2009 crises can be characterized with a single deep, the type of crisis described with “v” in the literature. Second, on the basis of our definition of a recession, the imported crisis lasts shorter but costs more in terms of output gap; while on the basis of NBER definition of a recession, the imported crises lasts longer and costs more in terms of negative real GDP growth. Third, our measure of recession based on output gap as a percent of potential GDP
provides a signal a quarter earlier than the measure of recession by the NBER on the basis of real GDP growth rate. Fourth, we can call the period between the two crises as a boom. However, both output gap as a percent of potential GDP and the growth rate of actual real GDP are significantly volatile during this period. This finding suggests that the boom period did not provide a smooth path of economic growth in Turkey. Finally, GDP growth rate measure shows an early recovery signal than output gap as a percent of GDP. Hence, this paper‟s main argument is that policymakers should take the cost of crises in terms of output gap into account in order to compensate the real effects of recessions on society.
Kaynakça
Alp, H., Y. S. Başkaya, M. Kılınç, and C. Yüksel (2011), “Estimating Optimal Hodrick-Prescott Filter Smoothing Parameter for Turkey”, İktisat, İşletme ve Finans, 26: 9-23.
Altug, S., Filiztekin A. and Pamuk S. (2008), “Sources of Long-Term Economic Growth for Turkey, 1880-2005”, European Review of Economic History, 12 (3): 393-430.
Artus, J. R. (1977), “Measures of Potential Output in Manufacturing for Eight Industrial Countries, 1955-78.”, IMF Staff Papers, 24, (1): 1-35.
Bukhari, S. H. A. S. and S. U. Khan (2008), “Estimating Output Gap for Pakistan Economy: Structural and Statistical Approaches.”, State Bank of Pakistan, Working Paper Series, No. 24.
Cicek, D. and C. Elgin (2001), “Accounting for Turkish Business Cycles”, İktisat Işletme ve Finans, 26 (309): 09-32.
Congdon, T. (2008),“Two Concepts of the Output Gap”, World Economics, 9 (1): 47-175.
Congressional Budget Office (2001), “CBO’s Method for Estimating Potential Output: An Update”, http://www.cbo.gov.
Dore, M. H. I. (1995), The Macro Dynamics of Business Cycles: A Comparative Evaluation, Blackwell Publishers, Massachusetts.
Epstein N. and C. Macchiarelli (2010), “Estimating Poland’s Potential Output: A Production Function Approach”, IMF Working Paper No.15.
Friedman, M. (1968),“The Role of Monetary Policy”, American Economic Review, 58 (March): 1-17. Furceri, Davide and Annabelle Mouragne (2009), “The Effect of Financial Crises on Potential Output: New Empirical Evidence from OECD Countries,” OECD Economies Department
Gerlach, P. (2011), “The Global Output Gap: Measurement Issues and Regional Disparities”, Bank
of International Settlements Quarterly Review, June.
Gibbs, D. (1995),“Potential Output: Concepts and Measurement”, Labor Market Bulletin, 1: 72-115. Gollin, D. (2002),“Getting Income Shares Right”, Journal of Political Economy, 110 (2): 458-474. Goyal, A., and S. Arora (2013), “Inferring India’s Potential Growth and Policy Stance”, Journal of
Quantities Economics, 1 (1-2): 60-83.
İsmihan M. and Metin-Ozcan K. (2006), “Sources of Growth in the Turkish Economy 1960-2004”,
İktisat, İşletme ve Finans, 241: 74-86.
Johnson, C. A. (2013),“Potential Output and Output Gap in Central America, Panama and Dominican Republic”, IMF Working Paper, WP/13/145.
Lucas, R. E. Jr. (1972), “Econometric Testing of the Natural Rate Hypothesis”, in Otto Eckstein (ed.), The Econometrics of Price Determination Conference (Washington, D. C.: Board of Governors of the Federal Reserve System): 50-59.
Odor, L., and J. Kucserova (2014), “Finding Yeti: More Robust Estimates of Output Gap in Slovakia”, National Bank of Slovakia Working Paper, WP 1/2014.
Okun, A. M. (1962), “Potential GNP: Its Measurement and Significance”, in Proceedings of the
Business and Economic Statistics Section (Washington D.C.: American Statistical
Association): 98-103.
Phillips, A. W. (1958), “The Relationship between Unemployment and the Rate of Change on Money Wage Rates in the United Kingdom, 1861-1957”, Economica, 25 (100): 283-299. Plosser, C. I., and G. W. Schwert (1979), “Potential GNP: Its Measurement and Significance”,
Carnegie Rochester Conference Series on Public Policy, 10: 179-186.
Pybus, T. (2011), “Estimating the UK’s Historical Output Gap”, Office for Budget Responsibility
Working Paper, 1.
Razin, A. and P. Loungani (2005), “Globalization and Inflation-Output Tradeoff”, NBER Working
Paper Series 11641.
Taylor, J. B. (1993), “Discretion versus Policy Rules in Practice” Carnegie-Rochester Conference
Series on Public Policy (Amsterdam: Elsevier Science Publishers): 195-214.
Titan, E., and V. Georgescu. (2013), “Investigating Macroeconomic Stability Using the Output Gap”,
Romanian Statistical Review, 2: 45-59.
Üngör, Murat (2012), “A Production Function Method of Estimating the Output Gap”, The Central