to 4 m for the higher-frequency branch of the second mode. For the lower-frequency branch, the single null occurs at the center (pla = 0) at about zo = 2.5 m and the double null occurs at increased values of pla, approaching about 0.56 at
Raj Mittra Department of ECE
~ ~ ~ ‘ ~ ~ ~ t ~ , f o ’ i ~ ~ i ~ o ,
z0 = 4 m. Null separation distance in the higher-frequency branch increases as C$ increases at zo = 2.1 m but decreases at zo = 3 m (in the interval from zo = 2.212 m to 3.738 m). The separation of the double dips is symmetric in
4
for zo larger than the maximum distance where the nulls occur. The maximum distances are found to increase as C$ increases, as shown in Figure 5.4. CONCLUSION
Double nulls and double dips that may be useful in identifying an air spherical cavity in the dielectric medium are analyzed in the forward near-field region. When the wavelength is com- parable to one half of the cavity radius (second mode), double nulls in the very near region and double dips in the near-field region occur and the null separation in the higher-frequency branch is about 1 to 0.56 times the diameter of the sphere. The null separation changes as
4
changes, although the dip separation remains unchanged.REFERENCES
1. R. J. Lytle, E. F. Laine, D. L. Lager, and D. T. Davis, “Cross- Borehole Electromagnetic Probing to Locate High-Contrast Anomalies,” Geophys., Vol. 44, Oct. 1979, pp. 1667-1676. 2. T. K. Lee, S. 0. Park, J. W. Ra, and S. Y. Kim, “Near-Field
Diffraction Pattern by an Underground Void of Circular Cylin- der,” Microwave Opt. Technol. Lett., Vol. 2 , May 1989, pp. 179-
183.
3. A. G. Martin, “Near-Field Centripetal Scattering from Dielectric Spheres,” IEEE Trans. Antennas Propagat., Vol. AP-23, Nov.
4. K. Kamiuto, “Near-Field Scattering by a Large Spherical Particle Embedded in a Nonabsorbing Medium,” J . Opt. SOC. A m . , Vol. 73. Dec. 1983, pp. 1819-1822.
5 . D. S. Benincasa, P. M. Barber, J. Z. Zhang, W. F. Hsieh, and R. K. Chang, “Spatial Distribution of the Internal and Near-Field Intensities of Large Cylindrical and Spherical Scatterers,” Appl. Opt., Vol. 26, April 1987, pp. 1348-1356.
6. P. W. Barber and S. C. Hill, Light Scattering by Particles: Com- putational Methods, World Scientific, Singapore, 1990, p. 231. 7. D. S. Jones, The Theory of Electromagnetism, Pergamon, New
York, 1964, p. 495. 1975, pp. 864-866.
KEY TERMS
Generalized eigenvalue method, finite-difference time-domain method, interpolation and extrapolation of transient time response, generalized pencil-of-function method
ABSTRACT
In this article we apply the generalized eigenvalue method (GEM) to
extract the complex exponentials from a truncated time record com- puted by the finite-difference time-domain (FDTD) code for analyz- ing microwave integrated circuits. To obtain accurale scattering pa- rameters without further FDTD computations, the truncated FDTD time record is efficiently extended into the future by summing the complex exponentials with complex coefficients determined by the least-squares method. Numerical G E M results with fewer poles are shown to be in good agreement with those obtained by the Prony method with a large number of poles. 0 1993 John Wiley & Sons, Inc.
1. INTRODUCTION
In a previous article [1] it has been demonstrated that a FDTD time record long enough for accurate scattering parameter estimation can be efficiently obtained from a relatively short time record by using an extrapolation scheme based upon the Prony method. It has also been found that a relatively large number of complex exponential functions, e.g., 18 for the bandpass filter and 22 for the low-pass filter in [l], is needed to satisfactorily curve-fit the FDTD data. In this article, an alternative curve-fitting scheme based on the generalized ei- genvalue method (GEM) [ 2 , 31 is applied to interpolate the FDTD data. It is illustrated in this article that using a small number of complex exponentials derived by G E M can achieve the same degree of accuracy in extrapolating the FDTD data as using a large number of complex exponentials found by the Prony method. The Prony method finds the complex ex- ponentials by seeking the complex zeros of a polynomial. The G E M determines the complex exponentials by finding the generalized eigenvalues. The locations of these two sets of poles may be different, but the interpolations as well as the extrapolations of the FDTD data by both methods are equally accurate in comparison with the direct FDTD generated time response.
Received 2-16-93 II. METHOD OF APPROACH
As a first step in the extrapolation scheme, a curve-fitting procedure is employed to approximate the time record, com- puted over a relatively short period using the FDTD scheme, in terms of complex exponentials. Thus the FDTD data g, can be expressed as
Microwave and Optical Technology Letters, 619, 549-552 0 1993 John Wiley & Sons, Inc.
CCC 0895-2477193
A
GENERALIZED EIGENVALUE
METHOD FOR FDTD ANALYSES
Wal Lee KO
Department of Electrical Engineering University of South Florida
Tampa, Florida 33620 M. lrsadi Aksun
Department of Electrical and Electronics Engineering Bilkent University, 06533
Ankara, Turkey
where t k are complex exponentials and ck are complex coef- ficients. Using the FDTD data g,, n = 0, 1, . . . , N - 1, two ( N
-
M ) x M ,M
= Nl2, matrices G and F a r e formed in the following manner [3]:rgo
and Band-pass
f
11
t e rpo
1 es
I I I I I I ]
With F and G , we form a pencil F - sG, where s is a complex parameter. The eigenvalues of the pencil are [2]
s ( F , G ) = {SKI det(F - SkG) =
o}.
(4) The eigenvectors q k of the pencil SatisfyUsing singular value decomposition, G can be expressed as
PI
G = L D R H , (6)
where L is a unitary matrix of left singular vectors, R is a unitary matrix of right singular vectors, D is a diagonal matrix of singular values, and H means conjugate transpose. Then the generalized inverse G’ is an M x ( N
-
M ) matrix that can be expressed as [ 2 ]G + = R D - ~ L H (7) where D - I , the inverse of D , is also diagonal. Multiplying ( 5 )
by G’:
The eigenvalues sk’s and the eigenvectors qk’S can then be obtained by solving the regular eigenvalue problem in (8) associated with the matrix product of G’ and F.
Next we show that those sk’s are the same as the zk’s in (1). Substituting (1) in (2) and (3), G and F can be decom- posed as [3]
G =
v,cv,
(9)and
The complex exponentiak zk and the coefficients ck have been arranged as the diagonal elements of the diagonal matrices 2 and C; i.e., Z = diag(zl, z 2 , . .
.
,
z K ) and C = diag(cl,c?, . . . , c K ) . The matrices V , and Vz are Vandermonde matri-
ces containing powers of the zk’s [2, 31. Using (9) and (lo), the matrix product G’F in (8) can now be expressed as
which says that the eigenvahes sk’s of G ‘ F are the same as the diagonal elements zk’s of the diagonal matrix
z.
Next we summarize the step-by-step solution procedure as follows:
1. Sample the short FDTD data to generate g,, n = 0, 1,
. . . ,
N - 1.I
x GEM 6 terms t 5t
-0.05
-0.10
-0.
15
0 0-0.020
-0.015
-0.010
-0.005
0
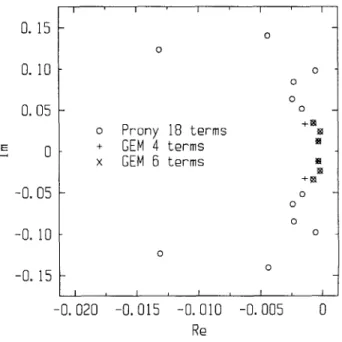
ReFigure 1 Pole locations
2 . Form G and F as shown in (2) and (3).
3. Find G + by singular value decomposition of G as shown
in (6) and (7).
4. Form the product G’F and find its eigenvalues s k ’ s , which are the complex exponentials zk’s in (1).
5 . Substitute these zk’s in (1) and solve the resulting least- squares problem to estimate the ck, k = 1, 2, .
.
.
, K .6. Check how well (1) can interpolate the FDTD samples. Repeat Steps 1-6 by changing the sampling in Step 1 until a satisfactory interpolation of the sampled data has been obtained.
7. Use (1) to extend the short FDTD data into the future to generate as long a time record as required for ac- curate scattering parameter estimation, while bypassing the time-consuming FDTD computation altogether.
Band-pass
f i l t e r o u t p u t p o r t I I I I I I I IO m 0 1 5
t
t
0.010
-
0.005
-0 -
N w-0.005
-0.010
- -*
FDTO data - - - Prony18
terms-
GEM
6 terms-0.015
I I I I I I I3000
4000
5000 6000 7000 8000 9000
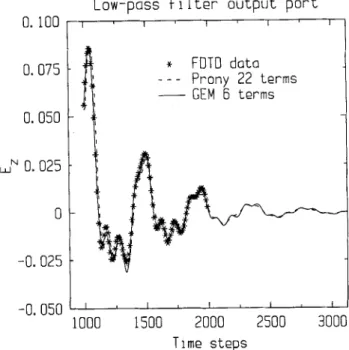
10000 T i m e stepsFigure 2 Interpolation 3000-5000; extrapolation 5000-10,000
Band-pass filter output port
I I I I I I I I0.010
0.005
N0 -
w-0.005
-0.010
0*015
t
x
--
- - I I I I I I I*
FDTD
data
- - - GEM4 terms
~ GEM6
terms
111. RESULTSThe bandpass filter and the low-pass filter in [l] are used to illustrate the GEM approach. For the bandpass filter, a trun- cated FDTD time record from the 3000th to the 5000th time steps is sampled at every 20 time steps to obtain 100 data points from which complex exponentials are found by GEM or the Prony method. The poles found by GEM are plotted in Figure 1, together with the poles found by Prony’s method. In both the GEM and the Prony method, the coefficients of the complex exponentials are determined by a least-squares approach. The GEM series of six complex exponentials and the Prony series of 18 complex exponentials are used in in-
0.3
0.
2
0.
15
0
-0.
1-0.
2
-0.3
Low-pass
f i
lter poles
I I I I I 0 0 0 0 0 0 0 0 o x o
Prony
22 terms
O X XO x GEM6
terms
XO o x o x 0 0 0 0 0 0 0 0-u.020
-0.015 -0.010 -0.005
0
Re
Figure 4 Pole locations
0.100
0.075
0.050
mN0.025
0
-0.025
-0.050
Low-pass
f
1 1ter output port
I I I I I
*
FDTD data
- - - Prony22 terms
-
GEM6
terms
9
I I I I I000
1500
2000
2500
3000
Time
steps
Figure 5 Interpolation 1000-2000; extrapolation 2000-3000
terpolating as well as extrapolating the FDTD data, as shown in Figure 2 . For comparison, the direct FDTD data are also plotted in the extrapolation region from 5000 to 10,000 time steps. Figure 3 shows the inadequacy of using less than 6 GEM poles in the extrapolation. Similar results are obtained for the low-pass filter in [l] and illustrated in Figures 4 and 5. In this case, the interpolation region is from 1000 to 2000 time steps and the extrapolation region is from 2000 to 3000 time steps.
IV. CONCLUSIONS
As shown by comparison with the direct FDTD generated results, the GEM using fewer poles and the Prony method using more poles achieve the same degree of accuracy in extrapolating the short FDTD time record to generate a long enough time response for accurate scattering parameter es- timation. Like the Prony method, the GEM can be used for other potential applications that require the computation of a long time response for Fourier transforming to extract fre- quency-domain parameters.
REFERENCES
1. W. L. KO and R. Mittra, “A Combination of FD-TD and Prony’s method for Analyzing Microwave Integrated Circuits,” IEEE
Trans. Microwave Theory Tech., Vol. MTT-39, No. 12, Dec. 1991, 2. G. H. Golub and C. F. Van Loan, Matrix Computations (2nd ed.),
Johns Hopkins University Press, Baltimore, 1989.
3. Y. Hua and T. K. Sarkar, “Generalized Pencil-of-Function Method for Extracting Poles of an EM System from its Transient Response,” IEEE Trans. Antennas Propagat., Vol. AP-37, No.
2, Feb. 1989, pp. 229-234. pp. 2178-2181.
Received 2-21 -93 Microwave and Optical Technology Letters, 6J9, 552-554
0 1993 John Wiley & Sons, Inc. CCC 0895-2477J93