Corresponding author: Ihsan ANIK E-mail: [email protected]
Original Investigation
Received: 28.11.2017 / Accepted: 19.03.2018 Published Online: 10.04.2018 qr codeIhsan ANIK
1, Yonca ANIK
2, Burak CABUK
1, Aykutlu DANA
3, Aykut GOKBEL
1, Dilek OZDAMAR
4, Musa CIRAK
5,
Savas CEYLAN
11Kocaeli University, Department of Neurosurgery, Kocaeli, Turkey 2Kocaeli University, Department of Radiology, Kocaeli, Turkey
3Bilkent University, Institute of Materials Science and Nanotechnology, Ankara, Turkey 4Kocaeli University, Department of Anesthesiology and Reanimation, Kocaeli, Turkey
5Bakırkoy Sadi Konuk Education and Research Hospital, Neurosurgery Clinic, Istanbul, Turkey
The Predictor Role of the Aqueduct Cerebrospinal
Fluid Flow on Endoscopic Third Ventriculostomy:
Explication on Assumption Physical Model
ABSTRACT
is used to evaluate the patency of ventriculostomy after ETV (1,14,16). Thus, in the present study, we aimed to evaluate the efficacy of ETV in patients with hydrocephalus caused by aqueductal stenosis, by measuring and comparing the flow of cerebrospinal fluid (CSF) in the aqueductus sylvii and pre-pontine cistern. We also validated improvement in aqueductal flow after successful ETV in the assumption physical model.
█
INTRODUCTION
E
ndoscopic third ventriculostomy (ETV) for the manage-ment of hydrocephalus has been becoming more popu-lar because it is minimally invasive and does not involve the usual complications of shunt implantation (4,14,16,18). Cine-magnetic resonance imaging (MRI) is a technique thatAIM: To evaluate the cerebrospinal fluid (CSF) flow dynamics in the aqueductus sylvii of patients with obstructive hydrocephalus who underwent endoscopic third ventriculostomy (ETV) and to predict ventriculostomy patency via aqueduct flow measurements. MATERIAL and METHODS: Twenty-four patients with obstructive hydrocephalus caused by primary aqueduct stenosis who underwent ETV were included in the study. All the patients underwent conventional and cine magnetic resonance imaging before and after treatment. The flow of CSF in the aqueduct of Sylvius and prepontine cistern was assessed, and the diameter of the third ventricle was also measured. Increase in the aqueduct flow velocity after a successful ETV was supported by the assumption physical model that highlights a possible mechanism that explains the clinical findings.
RESULTS: The flow pattern and velocity in the prepontine cistern and aqueduct were normal in 17 out of 24 patients who responded to ETV clinically. However, seven patients who did not respond to ETV had an abnormal flow pattern in both the prepontine cistern and aqueduct.
CONCLUSION: The flow pattern in the aqueduct was normalised and velocity was increased compared with those of preoperative values after a successful ETV. The flow of CSF in the prepontine cistern is routinely used for ventriculostomy patency assessment. In addition, aqueduct measurements may be useful in predicting ventriculostomy patency. The physical model provides valuable insights on a possible mechanism that affected the experimental data.
█
MATERIAL and METHODS
Patient Selection
Twenty-four patients with obstructive hydrocephalus caused by simple primary aqueduct stenosis who underwent ETV in the neurosurgery department of our hospital were included in the study. The exclusion criteria included the following: patients with partial aqueductal web or mass lesion, those with normal pressure hydrocephalus (NPH), those who underwent another surgical procedure such as aqueductoplasty or extraventricular drainage and those who were re-operated. The present study was approved by the Institutional Review Board of the hospital, and informed consent was obtained from all the patients before the start of the study.
Nine male and 15 female participants aged 18–70 (mean: 28; median: 33) years were included in the study. All the patients were followed-up for 6–72 (mean: 42.1; median: 44) months after surgery. The following symptoms were observed: headache (n=15), vertigo (n=5), amnesia (n=6), loss of balance (n=8) and incontinence (n=4).
Clinical improvement was assessed as “improved”, “un-changed” or “deteriorated” and was compared with preop-erative findings.
Surgical Procedure
ETV was performed by puncturing the floor of the third ventricle using a neuroendoscope (0° rigid rod lens, 4.0 mm; KARL STORZ GmbH & Co., Tuttlingen, Germany) in the midline, which is in front of the mammillary bodies.
MRI Procedure and Analysis
MRI was performed using a 1.5-T magnet (Philips Intera Master, Eindhoven, the Netherlands), 30-mT/m maximum gradient strength and 150-mT/m/ms slew rate, with the use of a head coil.
CSF flow was preoperatively assessed using conventional MRI and phase-contrast cine MRI. Conventional MRI sequences include T1 weighted in the axial plane and 3D T2 DRIVE in the sagittal plane.
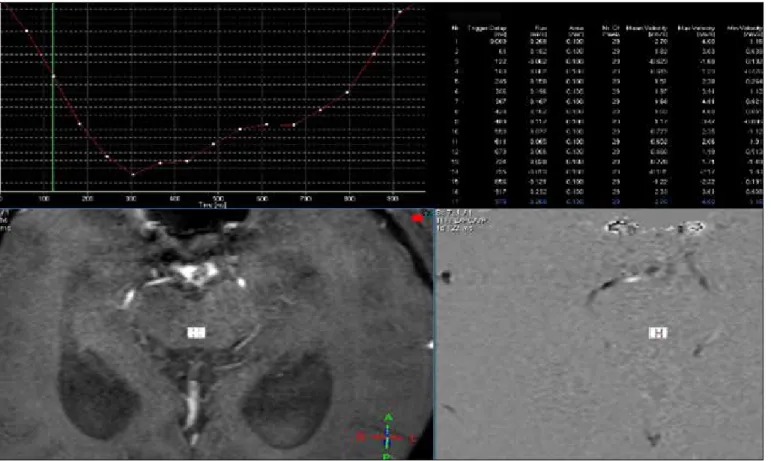
Phase-contrast cine-MRI was performed on the basis of the method used by Enzmann et al. (6). The signal changes were obtained at the level of the aqueduct of Sylvius on axial images perpendicular to CSF flow planned on sagittal image to minimize the partial volume artefact and prepontine cistern (Figure 1). A quantitative flow study was performed using 2D FFE [echo time (TE): 5–8 ms; repetition time (TR): 9–12 ms and flip angle (FA): 15°], 10 cm/s of velocity encoding (VENC), 256 × 256 matrix and 210-mm field of view. This pulse sequence yielded 16 quantitative flow-encoded images per cycle. Peripheral or cardiac triggering was used to cover the entire cardiac cycle with retrospective cardiac synchronisation. Measured signals were converted to velocity and flow using the quantitative analysis program. V peak rostral (Vpr) (maximal flow velocity during systolic period), V peak caudal (Vpc) (maximal flow velocity during diastolic period) and maximal flow velocity (Vmax), which was calculated as the mean absolute values of the peak craniocaudal and caudocranial velocities and flow pattern (to-and-fro pattern), were evaluated.
The patency of the third ventriculostomy was observed via MRI (Figure 2) and cine-MRI (Figure 3).
Follow-up
The follow-up assessments included neurological examination and cranial MRI (cine-MRI of the CSF flow in the aqueductus sylvii and prepontine cistern). The clinical course after ETV is characterised by prompt recovery of clinical symptoms. Otherwise, ETV may not be successful. MRI was performed to assess ventriculostomy patency.
Assumption Physical Model
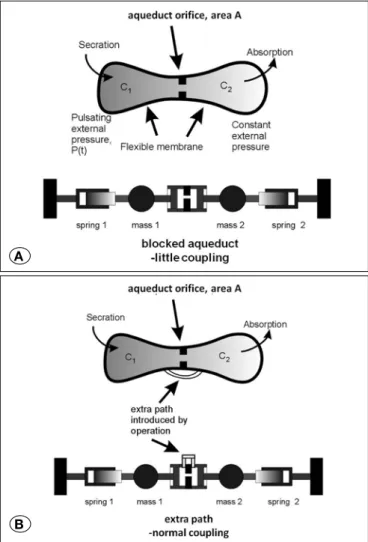
Increase in aqueduct flow velocity after successful ETV was assessed in the assumption physical model. Sinusoidal flow of the CSF is modelled by two elastic cavities, C1 and C2,
separated by an orifice of area A in the centre. This is further
Figure 1: Axial plane cine MRI of the signal changes at the level of the aqueduct of Sylvius is shown. Right corner planning on sagittal T2 weighted 3D DRIVE MRI image demonstrates planning of CSF flow quantification sequence perpendicular to CSF flow.
Figure 2: On sagittal T2 weighted 3D DRIVE MRI sequence patency of the third ventriculostomy is seen (arrow). There is prominent signal change due to CSF flow at ventriculostomy. Note that there is no web or mass lesion at aqueduct level.
modelled as two coupled simple harmonic oscillators, where coupling is via the aqueduct (Figures 4A, B).
Statistical Analysis
Statistical analyses were performed using SPSS version 20.0. Simple descriptive tests were used to calculate the mean, median and percentage of the parameters. Student’s t-test and Mann–Whitney U test were utilised to compare CSF flow dynamic measurements. Pearson correlation test was used to correlate the CSF flow dynamic measurements with clinical outcomes. P value <0.05 was considered to be statistically significant
█
RESULTS
MRI Results
Radiological diagnostic criteria for aqueduct stenosis included the following: Dilatation of the lateral ventricles and third ventricle, downward bulging of the third ventricle and normal-sized fourth ventricle on conventional MRI and CSF flow impairment at the aqueduct level on cine-MRI.
Figure 3: Cine-MR sagittal images demonstrate flow at third ventricle base and ventriculostomy area. Arrows point to CSF flow at ventriculostomy level.
Figure 4: A) On the model we created, C1 is secretion and C2 is absorption that represents CSF dynamics of the brain. The sinusoidal flow of the CSF is modelled by two elastic cavities C1 and C2 separated by an orifice of area A in the centre. In the other words the model represents CSF dynamics as in front of the blockage (C1) and back of the blockage (C2). The only pathway before ETV is aqueductus sylvii. Thus we added an orifice of area A as aqueduct. The path on the model represents the connection between the front of the blockage and interpeduncular and prepontine areas and thus the area providing the CSF flow through the subarachnoid space. The sinusoidal flow of the CSF is modelled by two elastic cavities C1 and C2 separated by an orifice of area A in the center. This is further modelled as two coupled simple harmonic oscillators, where the coupling is via the aqueduct. Blocked or smaller aqueduct causes little or no coupling between the two oscillators. The springs shown as pistons represent the elastic membranes or elastic cavity tissue. Because the aqueduct piston is also acting as a spring, uncoupled oscillators each have a resonance frequency of ω1 ~ 2k/m, where k is the elastic spring constant and m is the moving mass. B) After the operation, the diminished aqueduct is carried by another opening, and coupling is resumed. In the strong coupling regime, the resonance frequency of the system is recovered back to original value of ω0 = k/m which is near the pulse rate. If there is extra coupling introduced by the operation at another location, the two masses are moving together in a symmetric coupled mode which has a reduced frequency of ω0 = k/m which is about the same as the pulse rate.
A
█
DISCUSSION
ETV is a minimally invasive and safe method for CSF diversion. It is considered to be the gold standard treatment for aqueduct stenosis causing tri-ventricular obstructive hydrocephalus (1,9,15). Endoscopic fenestration of the floor of the third ventricle performed via ETV creates an alternative route for the CSF to flow to the subarachnoid space. Creating an opening between the ventricular system and subarachnoid space allows the CSF produced in the ventricles to pass into the subarachnoid space and be absorbed by the arachnoid villi into the sagittal sinuses (11).
Currently, ETV, which is used as treatment for obstructive hydrocephalus, provides a physiologic route for the flow of CSF, and the development of new endoscopes with improved optical features and easy-to-handle video systems has made the method feasible. In addition, ventriculostomy has been extremely successful (60%–80%) with rare complications (5%) (2-4,10,13,14,16,18).
In addition to anatomical considerations, imaging should enable decisions on CSF hydrodynamics before and after the surgery. Several MRI techniques have been described for the evaluation of CSF (4,5,12), and most conventional diagnostic procedures in the past have relied on clinical evaluation, radiological images, spinal infusion test and radioisotope cisternography (14). Modalities used to determine the success of the procedure include the evidence of stoma Preoperative phase-contrast cine-MRI suggested insufficient
communication with abnormal flow pattern and velocity in all patients preoperatively (Figure 5).
The flow pattern of CSF and parameters of the aqueduct were normalised after successful ETV (Figure 6). Clinical response was observed in 17 patients who had a normal flow pattern in the aqueduct and the prepontine cistern (Figure 7). A significant increase in the Vpr, Vpc and Vmax of the aqueduct was observed (p<0.01 for all values) (Table I). The CSF flow parameters were as follows: the preoperative mean Vmax of the aqueduct was 1.56 cm/sc and that of the prepontine cistern was 1.37 cm/sc. After successful surgery, the mean Vmax of the aqueduct was 5.08 cm/sc and that of the prepontine cistern was 5.32 cm/s. A significantly weak reverse correlation was observed between the normalisation of the CSF flow parameters and clinical improvement (p = 0.037; r: −0.201).
Surgical Outcomes
In 17 out of 24 patients who responded to ETV clinically, the flow pattern and velocity of CSF in the prepontine cistern and aqueduct were within normal range. However, abnormal CSF pattern in the aqueduct and prepontine cistern was observed in seven patients. Cine MRI findings were similar to clinical findings. Thus, VP shunt implantation was performed in these patients.
Figure 6: Normalization of aqueductal CSF flow pattern following third ventriculostomy is seen. Note that it is sinusoidal pattern.
reflect CSF dynamics after ETV in the physical assumption model were presented. The model is a first order approximation that describes the system. It highlights a mechanism that may explain the clinical findings.
Assumption Physical Model
The sinusoidal flow of the CSF is modelled by two elastic cavities [C1 (in front of the blockage) and C2 (at the back of the
blockage)] and separated by an orifice of area A (aqueductus sylvii, which is the only dynamic pathway before ETV) in the centre. This is further modelled as two coupled simple harmonic oscillators, where the coupling is via the aqueduct. The extra path on the model represents the connection between the front of the blockage and interpeduncular and prepontine areas and the area providing the CSF ow through the subarachnoid space.
A blocked or smaller aqueduct causes minimal or no coupling between the two oscillators. The springs shown as pistons represent the elastic membranes or cavity tissues. The flow is forced by pulsating pressure primarily on one side of the system, i.e. on cavity C1. The flow is assumed to be laminar
viscous, which allows us to view the aqueduct as an obstruction that limits flow velocity. Resistance of the aqueduct to flow is greater if the diameter is smaller. To understand flow dynamics, the fluid model can be converted into a lumped mechanical model comprising two mechanical oscillators that are coupled by the aqueduct. The problem arises when the aqueduct area becomes too small, causing the coupling to be too low. In this case, the motion is in anti-symmetric oscillation mode. The piston representing the aqueduct acts as an additional spring. Because the mode is anti-symmetric, the pressure on each side of the aqueduct is at approximately the same phase, and flow is suppressed. If there is extra coupling introduced by the operation at another location, the two masses move together in a symmetric coupled mode, which is approximately the same as the pulse rate. The recovery of the resonance frequency to the driving pulse rate may have caused the recovery of the flow rate through the aqueduct, i.e. the flow increased again because of the resonant symmetric mode. In summary, a blocked aqueduct modifies the dynamics of the CSF system and increases the mechanical resonance frequency thus diminishing flow rate. The operation reverts the mechanical properties to their original state, and the flow rate is recovered (Figures 4A, B).
The preoperative aqueduct flow on cine-MRI is deteriorated; as the aqueduct is small, CSF flow is restricted and causes increased CSF volume in the small aqueduct, causing resistance. Thus, the resistance to flow in the aqueduct is greater if the diameter is smaller. Another CSF pathway (ventriculostomy) is created via ETV, and CSF load, i.e. the resistance of the aqueduct to flow is decreased. If the decrease is adequate, the CSF flow in the aqueduct normalises, which was explained in the model. That can be a predictor of ventriculostomy patency expectance. If the alternative CSF pathway (ventriculostomy) is open but not adequate for CSF flow turnover, the CSF load in the aqueduct will increase, thus causing an increase in the resistance to the aqueduct flow and deterioration of aqueduct flow that can be seen patency on phase-contrast cine-MRI, MR ventriculography
and color Doppler ultrasonography (7). Midline sagittal T2-weighted MRI sequences along with cine phase-contrast MRI flow measurements are reliable tools for the diagnosis of aqueductal stenosis and ensuring the patency of the stoma during follow-up examination (14,16). Early clinical and cine-phase-contrast MRI findings after operation play an important role in predicting patient outcomes after ETV (8). We found that the third venticulostomy in all the patients who underwent ETV was patent.
A significantly high incidence of false-positive findings obtained from MRI, which can be used to detect the presence of a flow void signal through the third ventricular floor, has been reported. The false-positive finding was primarily a result of delayed stomal occlusion owing to external drainage or partial shunting and thus a no-flow image was produced despite an open orifice (8).
In 1992, Schroth and Klose examined seven patients with NPH and reported a distinct decrease in pulsation in the aq-ueduct after lumbar puncture and withdrawal of 50 ml of CSF (17). Kim et al. examined the CSF flow at the level of the aq-ueduct of Sylvius using phacontrast cine-MRI pulse se-quence in 28 healthy patients, 16 patients with hydrocephalus and 11 with NPH (14). Peak CSF flow velocity and stroke vol-ume in the aqueduct significantly increased in the NPH group and significantly decreased in the obstructive hydrocephalus group. After lumboperitoneal shunting, the retrograde CSF flow was anterogradely converted, and the peak flow veloci-ties decreased in the NPH group. In addition, the clinical di-agnosis of NPH correlated well with the results of cine MRI and ETV in the obstructive hydrocephalus group. CSF flow velocity increased with re-markedly high stroke volume in the prepontine cistern.
Our study group comprised patients with obstructive hydro-cephalus because of primary aqueductal stenosis. CSF flow of the aqueduct showed decreased velocity and deteriorated flow pattern preoperatively, and after successful ETV, the flow pattern normalised and flow velocity significantly increased. In this study, we evaluated the changes in CSF flow measurements in the aqueductus sylvii before and after ETV. Moreover, changes in measurements in the aqueduct that Table I: The Mean CSF Flow Velocity Parameters of the Aqueductus and Prepontine Cistern
5. Citrin CM, Sherman JL, Gangarosa RE, Scanlon D: Physiology of the CSF flow-void sign: Modification by cardiac gating. AJR 148:1021-1024, 1987
6. Enzmann DR, Pelc NJ: Normal flow patterns of intracranial and spinal cerebrospinal fluid defined with phase-contrast cine MR. Radiology 178: 467-474, 1991
7. Farin A, Aryan HE, Ozgur BM, Parsa AT, Levy ML: Endoscopic third ventriculostomy. J Clin Neurosci 13: 763-770, 2006 8. Feng H, Huang G, Liao X, Fu K, Tan H, Pu H, Cheng Y, Liu W,
Zhao D: Endoscopic third ventriculostomy in the management of obstructive hydrocephalus: An outcome analysis. J Neurosurg 100: 626–633, 2004
9. Grant JA, McLone DG: Third ventriculostomy: A review. Surg Neurol 47: 210–212, 1997
10. Guiot G: Ventriculo-cisternostomy for stenosis of aqueduct of Sylvius: Puncture of the floor of the third ventricle with a leucotome under television control. Acta Neurochir (Wien) 28: 275-289, 1973
11. Hellwig D, Grotenhuis JA, Tirakotai W, Riegel T, Schulte DM, Bauer BL, Bertalanffy H: Endoscopic third ventriculostomy for obstructive hydrocephalus. Neurosurg Rev 28: 1-34, discussion 35-38, 2005
12. Hoffmann KT, Lehmann TN, Baumann C, Felix R: CSF flow imaging in the management of third ventriculostomy with a reversed fast imaging with steady-state precession sequence. Eur Radiol 13:1432-1437, 2003
13. Jones RF, Kwok BC, Stening WA, Vonau M: The current status of endoscopic third ventriculostomy in the management of non-communicating hydrocephalus. Minim Invasive Neurosurg 37:28-36, 1994
14. Kim DS, Choi JU, Huh R, Yun PH, Kim DI: Quantitative assessment of cerebrospinal fluid hydrodynamics using a phase-contrast cine MR image in hydrocephalus. Childs Nerv Syst 15:461-467, 1999
15. Locatelli M, Draghi R, DI Cristofori A, Carrabba G, Zavanone M, Pluderi M, Spagnoli D, Rampini P: Third ventriculostomy in late-onset idiopathic aqueductal stenosis treatment: A focus on clinical presentation and radiological diagnosis. Neurol Med Chir (Tokyo) 54:1014–1021, 2014
16. Parkkola RK, Komu ME, Kotilainen EM, Valtonen SO, Thomsen C, Gideon P: Cerebrospinal fluid flow in patients with dilated ventricles studied with MR imaging. Eur Radiol 10:1442-1446, 2000
17. Schroth G, Klose U: Cerebrospinal fluid flow. III. Pathological cerebrospinal fluid pulsations. Neuroradiology 35:16-24, 1992 18. Tisell M, Almstrom O, Stephensen H, Tullberg M, Wikkelso C:
How effective is endoscopic third ventriculostomy in treating adult hydrocephalus caused by primary aqueductal stenosis? Neurosurgery 46:104-111, 2000
on cine-MRI. In summary, a blocked aqueduct modifies the dynamics of the CSF system and increases the mechanical resonance frequency, hence diminishing the flow rate. The ventriculostomy operation reverts the mechanical properties to their original state, and flow rate is recovered. The recovery of the resonance frequency to the driving pulse rate may have caused the recovery of flow rate through the aqueduct, i.e. the flow increased again because of the resonant symmetric mode.
The physical assumption model is presented herein to explain the findings. Although the physical model is hypothetical, it provides valuable insights on a mechanism that may affect the experimental data. The model is extremely simple. However, it captures the essential dynamics and response of the CSF flow dynamics in the aqueduct. The model remains a first order approximation in the presence of a different route.
█
CONCLUSION
The CSF flow pattern and velocity through the aqueduct is normalised after successful ETV, and this normalisation correlates well with that in the prepontine cistern flow as well as clinical findings. The flow of CSF in the prepontine cistern is used during the follow-up of ETV response; according to the results of our study, the aqueductus sylvii may be an alternative location. The flow of CSF in the aqueduct may be easier to evaluate than that in the prepontine cistern. Thus, the flow of CSF in the aqueduct and prepontine cistern can be used in response to surgical treatment and follow-up.
█
REFERENCES
1. Algın O, Ucar M, Ozmen E, Borcek AO, Ozisik P, Ocakoglu G, Tali ET: Assessment of third ventriculostomy patency with the 3D-SPACE technique: A preliminary multicenter research study. J Neurosurg 122: 1347–1355, 2015
2. Anık I, Ceylan S, Koc K, Anık Y, Etus V, Genc H: Membranous structures affecting the success of endoscopic third ventriculostomy in adult aqueductus sylvii stenosis. Minim Invasive Neurosurg 54(2):68-74, 2011
3. Anik I, Etus V, Anik Y, Ceylan S: Role of interpeduncular and prepontine cistern cerebrospinal fluid flow measurements in prediction of endoscopic third ventriculostomy success in pediatric triventricular hydrocephalus. Pediatr Neurosurg 46(5):344-350, 2010
4. Brant-Zawadzki M, Kelly W, Kjos B, Newton TH, Norman D, Dillon W, Sobel D: Magnetic resonance imaging and characterization of normal and abnormal intracranial cerebrospinal fluid (CSF) spaces. Neuroradiology 27: 3-8, 1985