PRESCRIPTION FRAUD DETECTION VIA DATA MINING:
A METHODOLOGY PROPOSAL
A THESIS
SUBMITTED TO THE DEPARTMENT OF INDUSTRIAL ENGINEERING
AND THE INSTITUTE OF ENGINEERING AND SCIENCE
OF BILKENT UNIVERSITY
IN PARTIAL FULFILLMENT OF THE REQUIREMENTS
FOR THE DEGREE OF
MASTER OF SCIENCE
By Karca Duru Aral
I certify that I have read this thesis and that in my opinion it is full adequate, in scope and in quality, as a dissertation for the degree of Master of Science.
___________________________________ Prof. İhsan Sabuncuoğlu (supervisor)
I certify that I have read this thesis and that in my opinion it is full adequate, in scope and in quality, as a dissertation for the degree of Master of Science.
___________________________________ Prof. Halil Altay Güvenir (co-supervisor)
I certify that I have read this thesis and that in my opinion it is full adequate, in scope and in quality, as a dissertation for the degree of Master of Science.
______________________________________ Assoc. Prof. Oya Ekin Karaşan
I certify that I have read this thesis and that in my opinion it is full adequate, in scope and in quality, as a dissertation for the degree of Master of Science.
______________________________________ Asst. Prof. Ayşegül Altın
Approved for the Institute of Engineering and Science
____________________________________ Prof. Mehmet Baray
Director of Institute of Engineering and Science
ABSTRACT
PRESCRIPTION FRAUD DETECTION VIA DATA MINING:
A METHODOLOGY PROPOSAL
Karca Duru Aral M.S. in Industrial Engineering
Advisors: Prof. İhsan Sabuncuoğlu, Prof. Halil Altay Güvenir July, 2009
Fraud is the illegitimate act of violating regulations in order to gain personal profit. These kinds of violations are seen in many important areas including, healthcare, computer networks, credit card transactions and communications. Every year health care fraud causes considerable amount of losses to Social Security Agencies and Insurance Companies in many countries including Turkey and USA. This kind of crime is often seem victimless by the committers, nonetheless the fraudulent chain between pharmaceutical companies, health care providers, patients and pharmacies not only damage the health care system with the financial burden but also greatly hinders the health care system to provide legitimate patients with quality health care. One of the biggest issues related with health care fraud is the prescription fraud. This thesis aims to identify a data mining methodology in order to detect fraudulent prescriptions in a large prescription database, which is a task traditionally conducted by human experts. For this purpose, we have developed a customized data-mining model for the prescription fraud detection. We employ data mining methodologies for assigning a risk score to prescriptions regarding Prescribed Medicament- Diagnosis consistency, Prescribed
Medicaments’ consistency within a prescription, Prescribed Medicament- Age and Sex consistency and Diagnosis- Cost consistency. Our proposed model has been tested on real world data. The results we obtained from our experimentations reveal that the proposed model works considerably well for the prescription fraud detection problem with a 77.4% true positive rate. We conclude that incorporating such a system in Social Security Agencies would radically decrease human-expert auditing costs and efficiency.
Keywords: Fraud Detection, Prescription Fraud, Data Mining
ÖZET
VERİ MADENCİLİĞİ TEKNİKLERİ İLE REÇETE USULSÜZLÜKLERİNİN
TESPİTİ: BİR YÖNTEM ÖNERİSİ
Karca Duru Aral
Endüstri Mühendisliği Yüksek Lisans
Tez Yöneticisi: Prof. Dr. İhsan Sabuncuoğlu, Prof. Dr. Halil Altay Güvenir Temmuz, 2009
Her yıl, sağlık, bankacılık, bilgi işlem ve iletişim gibi bir çok önemli alanda görülen usulsüz işlemler önemli miktarda para, zaman, bilgi ve emek kaybına sebep olmaktadır. Sağlık alanında görülen usulsüzlükler, aralarında Türkiye ve Amerika Birleşik Devletleri’nin de olduğu birçok ülkede sosyal güvenlik kurumları ve özel sağlık sigortası şirketlerine ciddi zararlar vermekte ve sağlık sistemlerini olumsuz etkilemektedir. Uygulayanlar ve uygulanmasına göz yumanlar tarafından zararsız olarak algılanan sağlık sistemi usulsüzlükleri, ilaç firmalari, sağlık hizmeti sağlayıcıları, hastalar ve eczaneler arasındaki yasadışı bir ağ üzerinden yürütülmektedir. Bu usulsüz faaliyetler sosyal güvenlik kurumlarına yanlızca finansal zararlar vermekle kalmayıp, sağlık sistemlerinin daha etkin ve kaliteli işleyebilmesinin önünde büyük bir engel oluşturmaktadır. Sağlık harcamalarının yarısına
yakınının ilaç harcamaları üzerine olduğu ülkemizde, reçete usulsüzlükleri de önemli bir sorun teşkil etmektedir.
Bu çalışma, veri madenciliğiyle büyük reçete veri tabanlarında usulsüzlük denetimi yapılması konusunda bir yöntem araştırmasını amaçlamıştır. Çalışmanın amacı, halihazırda uzmanlar tarafından rasgele seçim yoluyla yapılan reçete usulsüzlüğü denetiminin etkin bir otomasyon sistemiyle sağlanması için özelleştirilmis veri madenciliği teknikleri geliştirililmesidir.
Bu amaçla, her reçeteye Tanı uyumu, Yaş uyumu, İlaç uyumu, İlaç-Cinsiyet uyumu ve Tani-Fiyat uyumuyla ilgili risk notları vermek üzere oluşturulan teknikler, sonrasında gerçek reçeteler kümesi üzerinde denenmiştir. Test kümesindeki usulsüz reçetelerin %77.4’ünü yakalayan sistem, reçete usulsüzlük denetimi açısından tatmin edici bulunmuş ve önerilen yöntemin sosyal güvenlik kurumları tarafından kullanılmasının uzman denetim masraflarının azaltılması ve denetim etkinliğinin arttırması açısından uygun olabileceği sonucuna varılmıştır.
Anahtar Kelimeler: Veri madenciliği, usulsüzlük denetimi, Reçete Usulsüzlükleri
Acknowledgement
I would like to start by thanking my supervisors Prof. İhsan Sabuncuoğlu and Prof. Halil Altay Güvenir for sharing their experience and deep knowledge with me throughout the study for this thesis.
I send my greatest appreciations to my thesis jury for sharing their time and thoughts with me.
I appreciate the help of M.D. Çağdaş Baran in labeling a test set for performance evaluations of the proposed model.
From the beginning of this study I had one person in mind to dedicate it, my dear father, Temel Nusret Aral. Unfortunately, he had been diagnosed with stage-IV small-cell lung cancer by the time I started my graduate studies. So strong in character, he fighted not only with cancer but also with chemo and radiotherapies for 14 months until he passed away on November 13, 2008. Being a creative, artistic architect, I believe him to be a regrettable early loss not only for my family, and me but also for the all human kind. Thank you daddy, for raising me up the way I am, for being my father… Your love and memory stays here with me.
All I wish for this study is for it to help reduce the burden on health care systems by identifying and hindering criminal acts. Thus, this study might lead to creating an extra
budget for spending on cancer research; therefore increasing the chances that small-cell lung cancer research receives some support since this area is largely ignored by authorities. Please note that small-cell lung cancer is the deadliest of all cancer types, nonetheless receives the least of funds since those who are diagnosed with it are thought to have chosen to have cancer by choosing to smoke. I hope one day humanity will find a way to defeat this most cruel illness.
I would like to thank my mother, Fadime Aral, who had been along with my father all through the way in this fight and being strong for him, for my sister and me. I also thank my sister, İmge Su Aral, who is a joy and had been a joy making us simile even in the worst of times.
I am deeply grateful to Mr. Emre Doğukaya for being a shoulder for me through this hard time. Most probably, I wouldn’t have had the courage to pursue a master’s degree if it wasn’t for him.
I also want to thank Miss. Nazar Tüysüzoğlu for all her support and sincere consideration in the times we have spent together.
TABLE OF CONTENTS
Chapter 1: INTRODUCTION ...1
Chapter 2: LITERATURE REVIEW ...7
2.1. FRAUD DETECTION LITERATURE BY SUBJECT ...8
2.2.AVAILABLE DATA FOR FRAUD DETECTION ...10
2.3.INCORPORATED METHODOLOGIES ...10 2.3.1.Supervised Approaches ...11 2.3.2.Semi-Supervised Approaches...13 2.3.3.Unsupervised Approaches ...14 2.3.4.Hybrid Approaches...14 2.4.OUTLIER DETECTION...16
2.5.HEALTH CARE FRAUD DETECTION...20
2.6.PERFORMANCE MEASURES ...25
Chapter 3: MATHEMATICAL FORMULATIONS...27
3.1.DATA STRUCTURE...28
3.2.REVISED METHODOLOGIES ...30
3.2.1.Frequent Item Set Mining/Association Rule Learning...30
3.2.2.Infrequent Itemset Mining...30
3.2.3.Clustering ...31
3.3.METHODOLOGICAL DESIGN...33
3.4.RISK FORMULATIONS...35
3.4.1.Risk Formulation for Categorical Features ...36 ix
3.4.2.Risk Formulation for Ordered Features...39
Chapter 4: APPLICATION AND COMPUTATIONAL RESULTS...43
4.1.OFFLINE PROCESSING ...44
4.2.ONLINE PROCESSING...46
4.3.OFFLINE FRAUD DETECTION RESULTS ...48
4.4.ONLINE FRAUD DETECTION RESULTS...51
4.5.PERFORMANCE EVALUATION...55
Chapter 5: CONCLUDING REMARKS AND FURTHER RESEARCH DIRECTION ...58
BIBLIOGRAPHY ...61
APPENDIX ...69
A. Sample Model Output...70
LIST OF FIGURES
2.4. Figure 1: Scatter Plot of a sample on x and y coordinates...18
3.3. Figure 2: Flow chart of the integrated offline and online systems ...34
3.4. Figure 3: Examples of computational effectiveness of the risk formulation...37
4.2. Figure 4: Prescription Auditing Tool User Interface...47
4.4. Figure 5: Inserting a Prescription to the Prescription Auditing Tool ...52
4.4. Figure 6: Validation Message Box ...53
4.4. Figure 7: Database Update Notification ...53
4.4. Figure 8: Riskiness Levels Screen...54
LIST OF TABLES
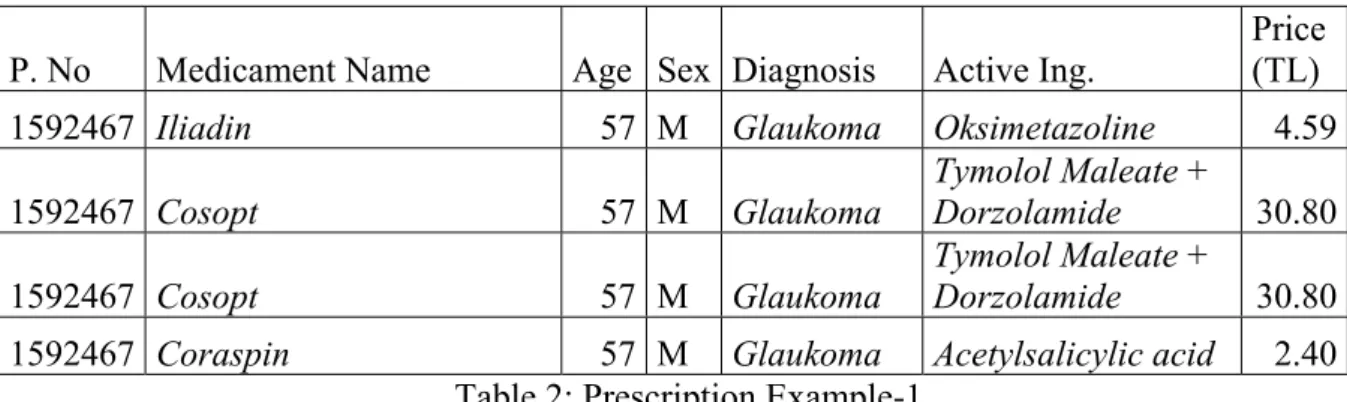
1. Table 1: Health Care Spending In Turkey by years ...34.3. Teble 2: Prescription Example-1 ...49
4.3. Table 3: Prescription Example-2 ...50
In the loving memory of my father…
In the cross-roads of universe and time, I met a blessed soul,
I feel blessed that he was my father.
Chapter 1
INTRODUCTION
Fraud is the abuse of a profit organization's system without necessarily leading to direct legal consequences [1]. Fraud constitutes a critical problem in many areas like health care, banking, insurance, and telecommunications. The fraudulent minority creates a big burden to the society to finance the fraudulent transactions. Any effort aiming to debug the fraudulent transactions in the above-mentioned businesses and probably in many other ones, is named as a fraud detection process. Due to the complexity and enormity of the modern business systems, criminals may and do discover safety gaps and use them to steal data or to defraud somebody. Even if a fraud type is discovered by the authorities and safety regulations are managed, the criminals seek and find other fraudulent ways and thus shift behavior over time. Manual detection conducted by human experts is very expensive even to debug any fraud that has been committed; can’t detect all fraudulent transactions of a certain type; can’t be managed to detect the fraudulent behavior the moment it is attempted to be committed and lack the ability to detect the shifts and trends in fraudulent behavior.
If we are to classify the fraudsters abusing an organization, according to their nature, we see that a business can be swindled by its managers, its employees or by the third parties. These external third parties are generalized by three types as organized, criminal, and average [1].
Average fraudsters are those who are not a part of an organized crime group, and have a tendency to commit fraudulent acts in an occasional manner. Even though these types of fraudsters are risky enough to be detected, organized or individual criminal fraudsters are more likely to cause more harm to the business system that is affected. These kinds of fraudsters are committing their fraudulent acts in an organized manner, often involved with identity theft and change behavior over time to get through the detection systems and new regulations. Considering the large businesses, it is highly costly to manually check all transactions and activities. So, it can be said that the enormous databases of these large businesses should be detected by customized data mining algorithms, and then the riskiest transactions identified can be inspected by human experts.
Fraud can also be grouped to be application or transaction fraud. In the application case, identity theft of falsified identity information is involved, whereas in the transactional case, a legitimate user/account information is abused by criminals.
We can summarize the problems involved with fraud detection as below [3]:
• Class distributions meaning the proportions between illegitimate transactions and legitimate transactions fluctuate.
• Different types of fraud can affect a business.
• Different styles of fraud have different behavioral characteristics in nature like being a one-time crime, being seasonal or being occasional.
• These characteristics can shift by time.
• Fraudsters change behavior to get through any new detection system and modify fraud styles.
Fraud detection, being part of the overall fraud control, should automate and help to reduce the manual parts of a screening/checking process [1]. For large businesses, it is intuitive that data mining incorporated systems are one of the best tools for fraud detection if
not the only; since large business generate large databases on which human auditing is inefficient.
Data mining is about finding insights which are statistically reliable, previously unknown, and actionable from data [2]. This data must be available, relevant, adequate, and clean. Also, the data mining problem must be well-defined, cannot be solved by query and reporting tools, and guided by a data mining process model [4].
Health care systems are among the largest of business systems in many countries. Being a business where enormous amounts of money cycles through, health care systems are very attractive targets for the above mentioned types of fraudsters. Below table illustrates the dimensions of the health care system in Turkey [5]:
(billion YTL) 2002 2007 2008 Total Social Insurance
Spending
7.6 20 24
Total Medicament Spending 4.3 8.6 10.5 Total Hospital Spending 2.8 10.3 13 State Hospital Payments by
SGK
1.8 6.4 7.5
Table 1: Health Care Spending In Turkey by years
According to Turkish Health Care Syndicate 2008 Health Care Report, fraud in health care has boomed recently. Having seen a yearly exponential increase in spending, health care systems’ abuse is becoming more and more critical. In 2008, health care fraud was committed principally in Van, Eskişehir, Erzurum, Siirt, Adana, Bursa, Zonguldak, Diyarbakır, and many other cities even in the Head Center of the Tuberculosis Fighting Department. These fraudulent acts were in the form of fake medicament reports, fake invoices, billing Social Security Agency (SSA) for examinations, and treatments that were not
rendered. The total cost of these fraudulent acts being millions of TL, about 300 people were arrested regarding fraud charges [5].
According to General Accounting Office of the USA, annual health care expenditures in USA have approached two trillion dollars, which is 15.3% of the Gross Domestic Product by 2007 [56].
The optimistic estimates are that at least 3% of health care expenditures which adds up to be $60 billion are lost due to fraud in USA. Other estimates are around 10% or $170 billion for this lost amount [57].
Fraud and abuse are not only widespread and very costly in United States' and Turkey’s health-care systems but also are very destructive in many other countries. Examples for fraud in a healthcare system would be billing for services and goods that are not rendered, performing medically unnecessary operations or prescribing unnecessary medicaments. Abuse involves charging for services that are not medically necessary, that do not conform to professionally recognized standards, or are unfairly priced. Some examples for abusive behaviors would be performing a laboratory test on large numbers of patients when only a few should have it or x-raying those without the definite need. Abuse and fraud are similar; nonetheless it is not possible to prove that the abusive acts were done with intent to deceive the insurer.
Prescription fraud is one of the types of health care fraud that has been commonplace in Turkey and constitutes an enormous burden on the Social Security Agency and the private insurance companies. This type of fraud compromises of excessive medicament prescription, and disunity of patients’ features with the prescribed medicaments. The perception of the society that the prescription fraud is a victimless crime make it even more widespread and strengthen the fraudulent chain between the pharmaceutical companies, physicians, pharmacies, and patients. The orthodox manual detection is conducted by a committee of assigned medical doctors in the Social Security Agency. When inspecting a hospital, the
human expert goes through a small sample of the prescriptions associated by the hospital and then the agency charges the hospital by paying the amount acquired by multiplying the proportion of the fraudulent claims seen in the sample and the total cost of the prescriptions issued by the hospital in that inspection era. This method is both costly to conduct and does not guarantee any efficiency coefficient.
When considering the immense amount of data associated with the health care system, it is trivial that any system dealing with prescription fraud should be automated and fail-safe to a considerable degree. Since nearly half of the spending of the SSA is on the medicament which was around 10.5 billion TL in 2008 [5], we see that the cost of the fraudulent prescriptions to the Social Security Agency is not tolerable. Thus, any system should be able to find the prescriptions that constitute a certain fraud probability assessed by the user. This probability should be such that the system functions with minimum amount of false negatives, that is to say minimum amount of fraudulent prescriptions being left undetected. This probability coefficient should be determined considering the human expert revising necessary for the output of the system. That way, the cost efficiency should be maintained.
Having revised the necessities of a cost effective system, we can conclude that such a system should incorporate the appropriate data mining methodologies enabling an automated, rapid, and efficient online structure that can be integrated with the electronic online provision systems already in use.
Our proposition for such a system is based on certain risk measurements calculated for each of the patient’s features compared to the common practice. We also propose to detect each pair of medicaments in the prescription since a pair may be in contraindication. An alike risk measurement is taken for each medicament pair in the prescriptions. The risk measurement is based on the assumption that, fraudulent behavior related to a certain feature is rare when considering the total data set. The data set we work on is a set of 26,419 real world prescriptions.
Next chapter is on the literature review conducted for both general fraud detection, health care fraud detection methodologies, and outlier detection, which is largely employed for fraud detection. This survey indicates that there are three main types of fraud detection techniques proposed for health care. These are supervised, unsupervised, and hybrid systems of two. Since we work on a data set without any prior knowledge on prescriptions’ label to be fraudulent or not, our proposed system is an unsupervised one.
The third chapter focuses on the data structure in hand, the revised methodologies in the literature to see if those are applicable to our problem, our methodology proposal, and the related risk formulations.
The forth chapter gathers the application outputs and the computational results. We briefly go over the offline and online processing as well as their outputs. We give the results of applications on the real world data with an emphasis on the offline and online applications. The validations of the system’s efficiency are conducted by validation study comparing the system outputs with those of a human expert labels.
We will conclude by a revision of the proposed system and further study directions.
Chapter 2
LITERATURE REVIEW
There are various resources relating to fraud detection. Fraud detection being a relatively large field, most of the papers on this subject consider outlier detection as a primary tool. Nonetheless, health care fraud detection studies are limited. When we come to the more specific field of prescription fraud detection, we see that there is no other study in this particular field. In this chapter, we focus on fraud detection, outlier detection and health care fraud detection studies in the literature.
As stated earlier, fraud detection automates transaction investigation efforts. In this regard, evolved and customized algorithms for the data in hand to check are the best possible answer for this business critical problem. We see that, the studies in this field mainly compromise of artificial intelligence, data mining, expert systems, fuzzy logic, statistics and visualization. The main shortcomings of data mining-based fraud detection research are that the lack of publicly available real data for experimentations and the lack of published methods. Even though studies continue for more effective solutions, there are commercially available data mining software with the claim to be competent to detect fraud in many sector specific cases.
2.1. FRAUD DETECTION LITERATURE BY SUBJECT
When we group the studies regarding fraud detection, we see that most of the studies group around administrative fraud detection, credit card fraud detection, telecommunications fraud detection and insurance fraud detection.
Internal fraud meaning the loss due to acts of a type intended to defraud, misappropriate property or circumvent regulations, the law or company policy, excluding diversity / discrimination events, which involves at least one internal party [6]. This type of fraud being stated to be one of the operational risks by the Basel Committee is a big problem involving accounting, financial statement and occupational fraud. There are studies in the literature to pinpoint internal fraud by Lin et al., (2003) proposing a Fuzzy Neural Network for Assessing the Risk of Fraudulent Financial Reporting; by Bell and Carcello, (2000); by Fanning and Cogger, (1995) proposing a neural network approach; by Summers and Sweeney, (1998) focusing on an empirical analysis on misstated financial statements; by Beneish, (1997) proposing a model providing assessments of the likelihood of manipulation in financial reports; by Green and Choi, (1997) proposing another neural network for assessing the risk of management fraud. Kim et al., (2003) focuses on an anomaly detection approach for fraud detection in retail sector. For this, implementing features of the human immune system is proposed.
When we consider the insurance fraud; home insurance is a field studied by Bentley, (2000), proposing fuzzy rules and by Von Altrock, (1997), proposing fuzzy logic. Crop insurance is studied by Little et al., (2002) applying data mining methodologies. Automobile insurance is studied by Phua et al., (2004) in which a classification of skewed data is made; by Viaene et al., (2004) proposing implementing Naive Bayes for claim fraud diagnosis; by Brockett et al., (2002) proposing Principal Component Analysis for fraud classification; by Stefano and Gisella, (2001) proposing a fuzzy expert system; by Belhadji et al., (2000) proposing a system based on the systematic use of fraud indicators; and by Artis et al., (1999) on modeling types of automobile insurance fraud behavior.
For medical/health care insurance fraud detection, there are a number of studies in the literature. Yamanishi et al., (2004) propose applying finite mixtures. Major and Riedinger, (2002) define a hybrid knowledge and statistical-based system named as EFD as in Electronic Fraud Detection. Williams, (1999) proposes evolutionary hot spots data mining. He et al., (1999) incorporates a hybrid system of genetic algorithms and k-nearest neighbor method. Cox, (1995) proposes a fuzzy system. Yang, W. and Hwang S. (2006) propose a process-mining framework for health care fraud detection. Ortega et al., (2007) incorporate a data mining methodology on multilayer perceptron neural networks.
There are two types of credit fraud detection, one is on screening credit applications and the other is the credit card transactions. Wheeler and Aitken, (2000) describe an application of case-based reasoning for eliminating fraud in credit approval process. For credit card transactions there are studies by Fan, (2004); Chen et al., (2004); Chiu and Tsai, (2004); Foster and Stine, (2004); Kim and Kim, (2002); Maes et al., (2002); Syeda et al., (2002); Bolton and Hand, (2001); Bentley et al., (2000); Brause et al., (1999); Chan et al., (1999). They propose systematic data selection, support vector machines, a web-based scheme, predictive modeling, neural classifiers, Bayesian and neural networks, parallel granular neural networks, unsupervised profiling methods, fuzzy Darwinian detection, neural data mining, and distributed data mining, respectively.
For telecommunications fraud, there is subscription abuse and phone call abuse. Cortes et al., (2003); Cahill et al., (2002); Rosset et al., (1999), have worked on subscription fraud, proposing dynamic graphs, data mining, rule based induction, respectively. Kim et al., (2003); Burge and Shawe-Taylor, (2001); Moreau et al., (1999); Murad and Pinkas, (1999) have studied the phone- call fraud problems. These studies focus on support vector machines, unsupervised neural network, hybrid systems and unsupervised profiling, respectively.
Other less studied fraud detection problems are e-business, government tax and customs’ fraud. Barse et al., (2003) and McGibney and Hearne, (2003) focus on video web-sites and voice-over-ip telecommunications fraud, respectively. Bhargava et al., (2003) and
Sherman, (2002) propose methodologies to monitor online sellers and online buyers, respectively, by automated systems. Bonchi et al., (1999) studied tax fraud. Shao et al., (2002) has worked on customs’ fraud.
2.2. AVAILABLE DATA FOR FRAUD DETECTION
The literature survey by Phua et al., 2004, reveals that publicly available data for fraud detection is limited to a small automobile insurance database screened by the same author. This survey indicates that telecommunications and credit fraud detection are the domains where large databases with many attributes can be found. Whereas for insurance and internal fraud, studied databases are limited. There are even studies on 100 examples available. Nonetheless, attribute numbers for the insurance and internal fraud studies can be as high as 150. The paper with largest database on insurance fraud is by Williams, 1999, with 40000 examples [1,24].
The employed attributes in the literature are either binary, numerical, categorical or a combination of those. The attributes for medical insurance databases are patient demographics (age and sex), treatment details (services), and policy and claim details (benefits and amount) [1].
Data mining methodologies in the literature either use training data with fraud/legitimate labels, examples of legal transactions or data with no labels to indicate fraud or legitimacy.
2.3. INCORPORATED METHODOLOGIES
We can group the existing methodologies of fraud detection as being supervised, unsupervised, or as being hybrids of the above. These data mining methodologies are described as:
2.3.1. Supervised Approaches
Supervised algorithms are trained by previously labeled training set of fraudulent and legitimate transactions. Then, the algorithms allocate mathematical methodologies to assign scores of similarity with the fraudulent profiles. The most popular applications of supervised algorithms are Neural networks are support vector machines (SVMs).
Kim et al. (2003) define SVM ensembles with for telecommunications subscription fraud. Barse et al. (2003) propose a multi-layer neural network to handle synthetic database of Video-on-Demand. For credit card fraud detection Syeda et al. (2002) propose fast rule generation by fuzzy neural networks on parallel machines. A feed-forward Radial Basis Function (RBF) neural network with three-layers was proposed by Ghosh and Reilly (1994). This neural network was trained in two phases. It was used to assigning risk scores to new credit card transactions in every two hours.
Maes et al. (2002) conducted a comparison study between neural networks and Bayesian networks. This study incorporates the STAGE algorithm for Bayesian networks. Back propagation algorithm was used to train the neural networks. The results indicate that even thought Bayesian networks are more accurate and needs a short training time, they are slower to be applied for new instances. Such a Bayesian Network was developed by Ezawa and Norton (1996), which has four stages and two parameters. This paper asserts that all the methods of regression, nearest neighbor, and neural networks are too slow for their data in hand. Decision trees were also problematic with some discrete variables in the dataset. Viaene
et al. (2004) propose AdaBoosted naive Bayes (fully independent boosted Bayesian network)
with weight of evidence formulation for scoring. When compared with unboosted and boosted naive Bayes, the proposed method had slightly better accuracy.
Some other methodologies are decision trees, rule induction, and case-based reasoning. Fan (2004) introduced systematic data selection to mine concept-drifting, possibly insufficient, data streams. The paper proposed a framework to select the optimal model from
four different models (based on old data chunk only, new data chunk only, new data chunk with selected old data, and old and new data chunks). The selected old data is the examples which both optimal models at the consecutive time steps predict correctly. The cross validated decision tree ensemble is consistently better than all other decision tree classifiers and weighted averaging ensembles under all concept-drifting data chunk sizes, especially when the new data chunk size of the credit card transactions are small. With the same credit card data as Fan (2004), Wang et al. (2003) demonstrates a pruned classifier C4.5 ensemble which is derived by weighting each base classifier according to its expected benefits and then averaging their outputs. The authors show that the ensemble will most likely perform better than a single classifier which uses exponential weighted average to emphasize more influence on recent data.
Rosset et al. (1999) presents a two-stage rules-based fraud detection system which first involves generating rules using a modified C4.5 algorithm. Next, it involves sorting rules based on accuracy of customer level rules, and selecting rules based on coverage of fraud of customer rules and difference between behavioral level rules. It was applied to a telecommunications subscription fraud. Bonchi et al. (1999) use boosted C5.0 algorithm on tax declarations of companies. Shao et al. (2002) apply a variant of C4.5 for customs fraud detection. Case-based reasoning (CBR) was used by Wheeler and Aitken (2000) to analyze the hardest cases which have been misclassified by existing methods and techniques. Retrieval is performed by threshold nearest neighbor matching. Diagnosis utilize multiple selection criteria (probabilistic curve, best match, negative selection, density selection, and default) and resolution strategies (sequential resolution-default, best guess, and combined confidence), which analyze the retrieved cases. The authors claim that CBR had 20% higher true positive and true negative rates than common algorithms on credit applications.
As for the statistical modeling, Foster and Stine (2004) employ least squares regression and stepwise selection of predictors. They assert that traditional statistical methods are effective to be used for fraud detection. Belhadji et al. (2000) propose the cooperation of human experts for choosing best indicators (attributes) for fraud detection. Then, they
calculate conditional probabilities of fraud for each indicator. As the third step, Probit regressions are used to define the most important indicators. Prohit regression is used for fraud prediction on automobile property damages. The flexible thresholds are adjustable for customization regarding any company’s fraud policy. In another study on automobile insurance data, Artis et al. (1999) make a comparison between multinomial logit model (MNL) and nested multinomial logit model (NMNL) on a classification problem. Both models provide estimated conditional probabilities for the three classes.
Some other techniques are expert systems, association rules, and genetic algorithms. Nonetheless the papers on the above mentioned techniques do not make efficiency or effectiveness comparisons with any existing techniques. Major and Riedinger (2002) have created an expert system to detect medical insurance fraud in which expert knowledge is integrated with statistical techniques. Pathak et al. (2003), Stefano and Gisella (2001) have studied fuzzy expert systems. Chiu and Tsai (2004) define Fraud Patterns Mining (FPM) algorithm, transformed from Apriori, in order to mine credit card data. Bentley (2000) proposes genetic programming with fuzzy logic for data classification on real home insurance claims and credit card transaction data.
2.3.2. Semi-supervised Approaches
Kim et al. (2003) present a five-step fraud detection method. First, rules are generated randomly by association rules algorithm Apriori; then rules are applied on legitimate labeled transaction database and any rule matching this data is eliminated. Third, the rules that are left are used for screening. Any rules, which cannot detect any anomalies, are eliminated. Fourth, any rule that can detect anomalies are refined by tiny random mutations. In the last step, the successful rules are retained. This proposed methodology is tested on retail transaction processing system internal fraud data.
For telecommunications fraud detection, Murad and Pinkas (1999) employ profiling. Profiling is attained by summarizing the calls daily and by overall levels of normal behavior
of each account. Clustering algorithm with cumulative distribution distance function is used to define the common daily profiles. When the profile’s call duration, destination, and quantity exceed the threshold and standard deviation of the profile an alert is raised.
2.3.3. Unsupervised Approaches
In the area of telecommunications fraud detection, Cortes et al. (2001) study temporal evolution of large dynamic graphs. The graphs are built up by the sub graphs named as Communities of Interest (COI). Exponential weighted average method is used to update sub graphs daily. COIs are built up by the mobile phone accounts using call quantity and durations. The study had revealed specifications of the telecommunication fraudsters. Burge and Shawe and Taylor (2001) use a recurrent neural network to identify account behavior profiles.
In medical insurance domain, Yamanishi et al. (2004) presented the unsupervised SmartSifter. The algorithm can work with categorical and continuous variables. SmartSifter investigates statistical outliers by Hellinger distance. On automobile insurance data, Brockett
et al. (2002) propose employing Principal Component Analysis of RIDIT scores on
rank-ordered categorical attributes.
In credit card transactions, Bolton and Hand (2001) present Peer Group Analysis in screening inter-account behavior changes by time by comparing the cumulative weekly mean amount between the account in question and the similar accounts. Bolton and Hand (2001) present Break Point Analysis to screen intra-account behavior changing over time. This method is used to detect any significant peaks in spending of an account. The t-test is used to rank the accounts.
2.3.4. Hybrid Approaches Supervised Hybrids
There are studies in the literature integrating supervised algorithms like neural networks, Bayesian networks, and decision trees. Chan et al. (1999) try to combine naive Bayes, C4.5, CART, and RIPPER classifiers. The results give better efficiency on credit card transactions. Phua et al. (2004) propose back propagation neural networks, naive Bayes, and C4.5 as classifiers. A single meta-classifier is used to identify the best base classifier among those, and then integrate the base classifiers’ predictions on automobile insurance claims. Ormerod et al. (2003) use a rule generator to adjust the weights of the proposed Bayesian network. Kim and Kim (2002) define a decision tree algorithm to classify the data in hand. They use a weighting function to compute fraud density, and then a back propagation neural network is used to generate a weighted risk score on credit card transactions. He et al. (1999) use genetic algorithms to compute optimal weights of the attributes, then the k-nearest neighbor algorithm is employed to classify the general practitioner (GP) dataset.
Supervised/Unsupervised Hybrids
Labeled data is used for supervised and unsupervised hybrids in telecommunications fraud detection. Cortes and Pregibon (2001) propose the use of daily updated telecommunication account summaries (signatures). The fraudulent labeled signatures are then added to the training set. This set is then used for training the supervised algorithms such as tree, slipper, and model-averaged regression. The authors assert that fraudulent calls have nature of late night activity and long call durations. Cortes et al. (2003) propose a graph-theoretic method. This method is used to visually detect fraudulent international calls. Cahill
et al. (2002) compute a risk score to each call regarding its similarity to fraudulent profiles
and dissimilarity to the account’s signature. The signatures are updated with low-score calls. In this updating process, recent calls are given more weight than older calls.
Moreau et al. (1999) indicate that supervised neural network and rule induction algorithms perform better than two types of unsupervised neural networks in identifying the shifts between short and long term account behavior profiles. They used AUC as the performance measure.
There are studies in which unsupervised approaches are used to classify the insurance data into clusters for incorporating supervised approaches. A three step procedure is proposed by Williams and Huang (1997) in which: k-means is employed for cluster detection, C4.5 is used for decision tree rule induction, and domain knowledge, then statistical summaries and visualization tools are utilized for rule evaluation. Williams (1999) employs a genetic algorithm for the second step to generate rules. This enables the user to explore the rules. in automobile injury claims, Brockett et al. (1998) propose a technique using Self Organizing Maps (SOM) for clustering just before employing back propagation neural networks
On medical providers’ claims, He et al. (1997), use hybrids of back propagation neural networks and SOMs in order to screen the classification results. Brause et al., (1999) present RBF neural networks for screening the outputs of association rules for credit card transactions.
2.4. OUTLIER DETECTION
Outlier detection methods have been suggested for numerous applications, such as credit card fraud detection, clinical trials, voting irregularity analysis, data cleansing, network intrusion, severe weather prediction, geographic information systems, athlete performance analysis, and other data mining tasks [60].
Outlier detection methods in the literature are: • Univariate methods
• Multivariate methods
Another classification of outlier detection methods is between: • Parametric (statistical) methods and
• Nonparametric methods that are model-free
Assuming a known underlying distribution of the observations, statistical parametric methods are based on statistical estimates of unknown distribution parameters. Outliers are defined to be the observations that deviate from the model assumptions by statistical methods. Papadimitriou et al., (2002) state that statistical parametric methods are often unsuitable for high-dimensional data sets and for arbitrary data sets without prior knowledge of the underlying data distribution.
Data mining methods are in the class of non-parametric outlier detection methods. These methods are called to be distance-based. Being able to work on large databases, these methods mostly incorporate local distance measures [62,63,64,65,66,55]
Clustering techniques constitute another class of non-parametric outlier detection methods. Points in small sized clusters are labeled to be outliers.
Detection methods for spatial outliers compose another class of non-parametric outlier detection methodologies. Such methods look for locally deviating instances regarding the neighbor observations.
Earlier studies in univariate outlier detection literature are built on the assumption of the data being identically and independently distributed from a known distribution [60] Another assumption under which many other works are conducted is that distribution parameters and the type of the expected outliers are known as well. It is trivial that these assumptions do not hold for real world data in general.
For observations with multivariable attributes, multivariate analysis is performed. This enables to identify the interactions among different variables. Ben Gal, I. (2005) gives a simple example as illustrated in Figure 1 for this need. This is an example of points plotted on two dimensions on x and y axis. It is intuitive that there is one outlier in this case, which is a multivariate outlier but not univariate. If we consider each attribute (x and y coordinates)
separately, the outlier point is not an outlier in either of the measures. Therefore, outlier detection should consider the relationships between any two attributes.
Figure 1: Scatter Plot of a sample on x and y coordinates
Thus, multivariate outlier detection procedures can either be statistical or data mining based. As stated earlier, statistical methods are based on the assumption of known distributions. The statistical methods of multivariate outlier detection try to identify the outliers as being the points that are stated being away from the center of the data distribution. The measurement of this distance can be done by a number of different distance measures. The effectiveness of the outlier detection procedure can be increased by incorporating robust estimates as in one-dimensional procedures. The most prevalent estimates are the distribution mean and the variance-covariance [67].
As stated earlier, data mining methodologies are mostly non-parametric, not needing the assumption of prior knowledge of the data distribution model. Data-mining methodologies are formed to handle large databases that are multi-dimensional. The sub groups of this category are:
• Distance-based methods, • Clustering methods, • Spatial methods.
As a non-parametric data mining methodology, distance-based methods were first proposed by Knorr and Ng (1997, 1998). The first definition of a distance based outlier is that being so if the observation in question is placed at a distance r from at least a β percent of the rest of the observations. Acuna and Rodriguez (2004) underline that this definition is problematic since it necessities the determination of r and β and a ranking for the outliers. The time complexity of the algorithm based on this definition is where number of the attributes (features) is p and n is the size of the sample. Therefore, it is impractical to be used in large datasets. Another problem of this definition is that, if the data set has dense and sparse regions, definition turns to be inadequate as stated in Ramaswamy et al., (2000) and Papadimitriou et al., (2002).
) (pn2
O
Another definition of outliers is presented by Ramaswamy et al., (2000). This definition can be stated as: given two integers v and l (v < l), outliers are defined to be the top
l sorted observations having the largest distance to their nearest neighbor. A critique of
this latter definition is that the information on the closer neighbors is lost when considering only the nearest neighbor. Another way to overcome this drawback is to define outliers to be the observations of which the average distance to the nearest neighbors is large. Acuna and Rodriguez, 2004 points out that the drawback of this latter definition to be the longer computational time needed.
th v th v th v
As for clustering based methods, these methods define small-sized clusters including a cluster of one observation to be outlier. Partitioning around medoids (PAM), Clustering large
applications (CLARA) by Kaufman and Rousseeuw, (1990); and a fractal-dimension based
method by Barbara and Chen, (2000) are among the examples for such methods. We need to underline that designed for clustering; these methodologies aren’t really for outlier detection. As stated in Papadimitriou et al. (2002), the outlier detection criteria are usually implicit and clustering procedures do not easily convey these criteria.
The next group of non-parametric methodologies being spatial methods, these are relevant with the above-mentioned clustering methods. This methodology’s applications are mostly seen in domains that convey spatial information, like, ecology, geographic information systems, transportation, climatology, location-based services, public health and public safety.
A spatial outlier is a spatially referenced object whose non-spatial attribute values are significantly different from the values of its neighborhood [72]. The authors classify the spatial methodologies by two groups of quantitative tests and graphic approaches.
The first group of methods presents tests to identify spatial outliers from the rest of database. Two representative approaches in this category are the Scatter plot by Haining, (1993) is an example of this group of methods.
Graphic methods employ visualization of spatial data, highlighting the outliers. Haslett
et al., 1991, Panatier, 1996 propose Variogram clouds and pocket plots for graphic outlier
detection, respectively. Multidimensional scaling (MDS) was presented by Schiffman et al. (1981). Like in a map, MDS illustrates the analogy of observations. Penny and Jolliffe (2001) present metric and non-metric MDS reformulations.
The method for detecting spatial outliers in graph data set by Shekhar et al. (2001, 2002) employs the distribution property of the difference between the value of an attribute and the average attribute value of the neighbors. Shekhar, et al., (2003) present an approach to make a comparison between spatial outlier-detection methods.
2.5. HEALTH CARE FRAUD DETECTION
There are three groups of health care fraud detection studies. The first group uses supervised methodologies. The second group incorporates unsupervised algorithms. The third group uses multiple methodologies of one or both of the first two.
Predictive supervised algorithms examine all previously labeled transactions to mathematically determine how a standard fraudulent transaction looks like by assigning a risk score [1]. As a supervised fraud detection method, neural networks seem to be the most popular ones. Here are the supervised fraud detection studies in the literature:
Ormerod et al. (2003) propose the usage of a Bayesian Network. They present a Mass Detection Tool (MDT) for detection of medical insurance fraud. Ethnography is the core element of the algorithm for specifying needs and process, capture expertise, and design an interface for triggering fraud indicators while capturing unexpected anomalies detected by claims handlers. The MDT uses a dynamic Bayesian Belief Network of fraud indicators, The system employs automated knowledge updating to keep up with dynamically changing fraud, adding new indicators that emerge from patterns of repeated anomalies [52].
Chan CL et al. (2001) introduces a Fuzzy Bayesian Classifier. This research combines the Bayesian classifier and the Fuzzy Set Theory to create a new data mining methodology. Bayesian classifier, based on Bayesian inference, is one of the data mining techniques that can be used for classification problems. Bayesian classifier classifies by incorporating all features influencing the classification result. The Bayesian classifier, having a good power of interpretation of the result, needs to associate different probability distributions when dealing with continuous attributes, which increases the complexity of the computation. To overcome this, Fuzzy set theory is exercised to transform the continuous attributes into discrete ones. This system is then used in analyzing health insurance fee data. 80% of the data set was used to train the Fuzzy Bayesian Classifier and then, the system was tested on the 20% of the data. The true positive rate (sensitivity) of the classifier is 0.639 and the true negative rate (specificity) is 0.968 [53].
Ortega et al. (2007) describes another medical claim fraud/abuse detection system based on data mining used by a Chilean private health insurance company. The proposed detection system employs multilayer perceptron neural networks (MLP). The entities involved in the medical fraud problem are as: medical claims, affiliates, medical professionals
and employers. The multilayer perceptron neural network is trained for the features of all these entities. The proposed fraud detection system is shown to detect 75 fraudulent cases per month [58].
Unsupervised algorithms are relatively less incorporated as a health care fraud detection tool. There were two examples seen in the literature survey in the process of making this thesis.
The first one is the Electronic Fraud Detection (EFD) proposed by Major et al. (2002) which introduces the usage of an expert system. Electronic Fraud Detection (EFD) is designed to assist the Investigative Consultants in the Managed Care & Employee Benefits Security Unit of the Travelers Insurance Companies in the detection of frauds committed by health care providers [23]. The database that EFD is designed for has never been investigated manually and it has few positive examples. In order to get through these problems, EFD incorporates two levels of knowledge discovery techniques. In the first level, in order to highlight the unusual provider behavior, EFD incorporates expert knowledge and statistical information assessment. The 27 behavioral heuristics employed in EFD are used to screen and to measure the provider behavior in question. The rules seek to identify providers which seem to deserve a human expert investigation. Then, new rules are built by machine learning in order to enhance the screening efforts. Pilot operations had been carried out to analyze 22,000 health care providers. Then a prototype system got implemented in SAS Institute's SAS System, AICorp's Knowledge Base Management System, and Borland International's Turbo Prolog.
The second unsupervised methodology is proposed by Yamanishi et al. (2004) and named as SmartSifter which is an outlier detection engine addressing the problem from the viewpoint of statistical learning theory. The proposed methodology, SmartSifter works online to identify outliers, incorporating the online unsupervised training of a finite mixture model on the information in hand. Every time there is a new entry to the system, SmartSifter runs to
learn the new probabilistic model. The output of the SmartSifter is score given for the new entry. In the case of a high score, the new entry is said to have a high risk to be an outlier. The superiority of SmartSifter are identified to be it being adaptive to changing sources of data; its output being a score which has a easily understandable meaning; it being computationally inexpensive; and it being able to work with both categorical and continuous variables. SmartSifter’s experimental applications have been shown to identify meaningful rare cases in real-life health insurance pathology data from Australia's Health Insurance Commission [22].
Hybrid methods consist of a combination of supervised and unsupervised methods or concatenating two or more methods in one of the supervised/unsupervised groups.
Williams et al. (1999)present the hot spots methodology. The proposed methodology incorporates a multi-strategy in an interactive approach to identify important nuggets. First, the methodology employs data mining. Then, the system screens the outcoming models in order to identify the important nugget. The system is then used on insurance and fraud applications[24].
He, H. et al. (1999) studied the medical fraud detection problem regarding the General Practitioners (GP). The features to classify GP profiles are weighted by genetic algorithms. Then, these weights are imposed in K-Nearest Neighbor algorithm in order to detect practice profiles. Then, the practice profiles are classified by the Majority Rule and the Bayesian Rule. The results are found successful in classifying GP practice profiles in a test dataset. This study is said to open the way towards its application in the medical fraud detection at Australia’s Health Insurance Commission (HIC) as a routine application [25].
There are some commercial products and publicly available products in the market that claim to be effective medical fraud detection tools. These are:
• SPSS : Clementine 10 • Karypis Lab: CLUTO
• SAS Institute : Enterprise Miner (EM)
Being a data-mining tool for large-scale databases, Clementine 10 employs “anomaly detection” feature that permits it to be used for fraud detection. The incorporated anomaly detection scheme can simplify analysis and scoring, improve insight, and facilitate the use of these insights in operational deployments. Nonetheless, we haven’t encountered any successful application of the software to medical fraud detection problem.
CLUTO being freely available is a family of computationally efficient and high-quality data clustering and cluster analysis programs and libraries that are well suited for low- and high-dimensional data sets and for analyzing the characteristics of the various clusters. CLUTO is utilized for clustering data sets arising in many diverse application areas including information retrieval, customer purchasing transactions, web, GIS, science, and biology, thus can be used for fraud detection.
SAS Enterprise Miner streamlines the data mining process to create accurate predictive and descriptive models based on analysis of vast amounts of data from across the enterprise. There are organizations using SAS data mining software to detect fraud, anticipate resource demands, increase acquisitions and curb customer attrition. The software provides multiple advanced predictive and descriptive modeling algorithms, including market basket analysis, decision trees, gradient boosting, neural networks, linear and logistic regression, and more.
SAS EM and CLUTO have been applied to a large real-life health insurance dataset [62]. Experimental results indicate that CLUTO is faster than SAS EM while SAS EM provides more useful clusters than CLUTO.
2.6. PERFORMANCE MEASURES
In order to conclude that a study is successful, some performance measures should be defined and fulfilled. As revealed by Phua, 2004, many studies consider the possible cost savings or profits to be the success indicators. Phua et al., 2004; Chan et al., 1999; Fawcett and Provost, 1997 define explicit cost. Wang et al., 2003 employ benefit models. For telecommunications fraud, Cahill et al., 2002, outlines scoring an instance (a phone call in this case) by dividing the similarity measure of it to known fraud examples divided by the dissimilarity measure of it to known legal examples.
The unsymmetrical nature of the fraud imposes false positive and false negative error costs to unequal. These costs are unstable, changing by time and changing from example to example. Since a false negative example can be highly costly and a false positive error only costs for the human expert screening time, a false negative error is mostly more costly than a false positive error.
Therefore, lately, supervised algorithms based fraud detection methodologies no longer use assessments on true positive rate (correctly detected fraud divided by actual fraud) and accuracy at a chosen threshold (number of instances predicted correctly, divided by the total number of instances). Some employ Receiver Operating Characteristic (ROC) analysis (true positive rate versus false positive rate). Viaene et al. (2004), seek to maximize the Area under the Receiver Operating Curve (AUC). Caruana and Niculescu-Mizil (2004) argues that the most effective way to assess supervised algorithms is to use one metric from threshold, ordering, and probability metrics; and they justify using the average of mean squared error, accuracy, and AUC.
Lee and Xiang (2001) define entropy, conditional entropy, relative conditional entropy, information gain, and information cost for semi-supervised methodology assessment.
Ghosh and Reilly, 1994, illustrate other measurements like the speed of detection defined by detection time over time to alarm, the number of types of fraud revealed by the system and the format of the detection being online or offline.
When considering insurance fraud detection, some human expert involvement is imposed. Von Altrock (1995) asserted their system to perform better than human experts. Brockett et al. (2002) and Stefano and Gisella (2001) have found their work to be successful even to consistent human expert outcomes. Belhadji et al., 2000 and Williams, 1999, both defend the role of human experts in a fraud detection system.
Chapter 3
MATHEMATICAL FORMULATIONS
Since most of the fraud detection papers focus on nonlinear, black-box supervised algorithms as neural networks, we can assert that less complex, reliable and faster algorithms are needed for such a research. Given that our database does not have fraudulent and legitimate labels for the transactions, our only data mining option for fraud detection is an unsupervised approach.
For auditing medical transactions, it is obvious that we need two tools. One is for batch screening/auditing and the other is for online/on time transaction control. This imposes building up two systems that are working interactively. Clearly, the online system needs to incorporate strategies to overcome the need for re-processing the whole batch of prescriptions in every new transaction. Besides these needs, the data structure, and size are the other design considerations. We try to fulfill these requirements under the assumption that the fraudulent cases are outliers in the database.
Since many outlier detection algorithms in the literature are designed for the specific problem in hand, and since there is no other prescription fraud detection work available in the literature, we need to consider our design needs and try to build up an efficient tool for the problem.
3.1. DATA STRUCTURE
Since data mining tools are developed regarding data structure, as well as the dimension and the size of the database in hand, first we need to analyze our database structure. We work on a database of 87,785 prescribed drugs in 2007 and 2008, stored in Excel 2007 spreadsheet format. The initial database provided us with 9 features (attributes). These 9 features are:
• Commercial name of the prescribed drug, • Barcode number of the drug,
• Prescription number, • Patient number, • Age,
• Sex,
• ATC code of the drug, • ATC name of the drug,
• Diagnosis for which the drug is prescribed.
Anatomical Therapeutic Chemical (ATC) codes were initially recommended by the WHO Regional Office for Europe in 1981. In the ATC system, drugs are divided into fourteen main groups (1st level), with one pharmacological/therapeutic subgroup (2nd level). The 3rd and 4th levels are chemical/pharmacological/therapeutic subgroups and the 5th level is the chemical substance. The complete classification of Simvastatin illustrates the structure:
C: Cardiovascular System
C10: Serum Lipid Reducing Agents
C10A: Cholesterol and Triglyceride Reducers C10AA: HMG CoA Reductase Inhibitors C10AA01: Simvastatin
When examining the transactions, we noticed that the ATC code and ATC names given in the database are not compatible with the above scheme. Moreover, there were drugs that were given different ATC codes when recurred. Thus, we decided to eliminate these attributes that could have been very helpful in classifying the drugs. Therefore, we decided to add active principle ingredient of the medicament to our database. For this, we have used the price lists of 2007 published by the Health Care Ministry, which is an extensive resource on commercially available drugs including the active ingredients, pharmacy and depot prices. We have matched the ingredients and the prices by an Excel Visual Basic Macro code. Nonetheless, the list lacked the information on about 2500 prescribed drugs that were left blank for price and ingredient features after executing the Macro code. We have inserted the related prices on these manually. Unfortunately, even manually we were not able to identify some active ingredients of some drugs that are not currently in the market. Thus, we decided not to use active ingredients as a feature in the database.
The next step was to decide on the features to involve in the procedure. It is trivial that age and sex are critical features that medical doctors consider in prescribing medicaments. Diagnosis is the core feature to judge the fraudulency of a prescription. Price should give us an idea of the level of spending per prescription, thus it is also important. So, the features that we are to consider in prescription fraud detection are:
• Commercial name of the prescribed drug, • Market price of the prescribed drug, • Prescription number,
• Age, • Sex,
• Diagnosis for which the drug is prescribed,
3.2. REVISED METHODOLOGIES
In the the search for an efficient algorithm for prescription fraud detection, we have incorporated some of the existing methodologies for this problem. Among these algorithms are: association rules, infrequent item set mining and k-means.
3.2.1. Frequent Item Set Mining/Association Rule Learning
Association rule learning, being a popular method in data mining for revealing interesting relations within databases, was the first data mining methodology that we studied for the prescription fraud detection. The executable Apriori by Chriatian Borgelt was used as the data-mining tool. This tool is also incorporated in the commercial data-mining tool Clementine by SPSS. As for the application in our database, we defined the frequency threshold very low for the algorithm to give us infrequent item sets. After having run the code on the prescription database for the item sets of ATC codes in prescriptions, the results were found insignificant by the medical doctor Çağdaş Baran.
3.2.2. Infrequent Item Set Mining
Infrequent item set mining is a new algorithm for minimal infrequent item set mining. This algorithm aims to identify the rare item sets seen in a large database [81]. The algorithm
Minit presented by Haglin and Manning (2007), is designed to serve as a tool for mining those
rare item sets. We have made use of Minit’s open-source code for mining the infrequent item sets in our database.
Consider a feature specification for patients as for sex and age interval. Let the set F be the set of the prescriptions that this specified group of patients has been prescribed. Assuming that finding a rare item set of drugs in this dataset of prescriptions would mean that this rare item set of drugs are from a fraudulent transaction, running Minit on the set F would give us those fraudulent transactions in the data set.
We have made several trials for incorporating this methodology for the 2007 prescriptions data that has 57,128 drugs. We have conducted trials on the domains that were the meaningful classifications for our database:
• Women, • Men, • Infants, • Children, • Adolescents, • Men adults, • Women adults, • Women adolescents, • Men adolescents.
The trials revealed such a big amount of infrequent item sets that we need to consider using other scalable methodologies for prescription fraud detection on our large database.
3.2.3. Clustering
Clustering is a methodology for partitioning the observations in hand into k clusters. Since the nature of our database do not impose a particular k, we need to define an algorithm in which the number of clusters is flexible. Here, we try to cluster the prescriptions, thus the observations to work on are prescriptions that are defined to be item sets of medicaments.
For this purpose we have developed a novel algorithm. First let us define similarity and quality measures. We define the similarity function as: sim(p1,p2)= p1∩ p2 p1∪p2 , where p1 and p2 are item sets. On the other hand, our quality measure is
∑
i
i p c
sim( , )2 ,
where c is the centroid of an item set.
Please note that these measures are novel in the sense that they are modifications of notations already in use in the literature.
To initialize, we define the first observation to be the centroid. Then we calculate the quality regarding this first centroid. In the next iteration, we list all items in the data set and rank them according to their occurrence frequencies. We take the first ranking item, put it in the centroid and calculate the quality measure. Then we take the second ranking and add this item to the centroid and calculate the quality regarding this new centroid, and so on. If an item in the list decreases the previously calculated quality, we define the centroid to be the one defined in the previous step. After having updated the centroid, we now arrange the clusters. We calculate the similarity between the observations and (item sets) and the defined centroid for each observation. For the first iteration if the similarity measure between the item set and the centroid is bigger than zero, then this item set rests in the initial cluster. If the similarity is zero for an item set, this item set defines a new centroid.
After having completed the initialization, we enter the second iteration. In this iteration, we recalculate the quality measures for each cluster as we did in the first iteration. That way a new centroid is defined for each of the clusters. Then, we recalculate the similarity measures between the item sets and centroids. If a similarity measure is below the threshold, the item set defines a new cluster; else it remains in the existing cluster. The iterations terminate if there is no new cluster to create.
With this algorithm, we aimed to create a non pre-defined number of clusters of the dataset. This way we hoped to find fraudulent prescriptions (outliers), which can be defined to be small clusters. Unfortunately, this clustering approach based on quality measures, proved to be sub-optimal in the tests. That is the reason we consider other approaches here.
3.3. METHODOLOGICAL DESIGN
As stated in the previous section, we have a domain of 6 dimensions, meaning that we have 6 different features to consider for this database which are; prescription number, medicament name, diagnosis, age, sex, and price. If we are to find the fraudulent transactions, it is clear that we are involved with a multivariate study. Nonetheless, if we explicate the nature of the data in hand, we see that the correlated features are:
• Medicament and Diagnosis, • Medicament and Age, • Medicament and Sex,
• Diagnosis and the total cost of drugs prescribed for this diagnosis, • Medicament and Medicament interactions in a prescription.
Since there is no correlation between the rest like age and sex; we do not need to get involved with this cross-feature. Now, let’s consider the interactions between diagnosis and age as well as diagnosis and sex. There can be specifications like pediatric diagnoses or women illnesses. Then shall we consider these cross-features? The answer is no, since any such diagnosis should convey specific medicaments in the prescription. These specific medicaments should reveal any mismatching between the diagnosis and age or sex. These arguments transform our domain of 6 dimensions to sub-domains of 2 dimensions which are illustrated by the above mentioned interactions. Therefore, our problem is refined to deal with five two-dimensional spaces. Working with incidence and risk matrices which are to be defined in the next sections and having two parts of consideration as online and offline processing, our methodology’s flow chart is as:
Yes No Incidence Matrices New Prescription Insert the Prescription to P.A. Tool Historical Prescription Database Compute the Prescription Risks Legal Alarm for Investigation Pre-processing Compute the Prescription Risks Generate Incidence Matrices Fraudulent Prescriptions Generate Report for the Given Thresholds
Prescription Risks Allow the transaction Add Prescription to the Database Update Incidence Matrices ONLINE SYSTEM OFFLINE SYSTEM
Figure 2: Flow chart of the integrated offline and online systems