Macroeconomics of Climate Change in a Dualistic Economy Copyright © 2018 Elsevier Inc.
http://dx.doi.org/10.1016/B978-0-12-813519-8.00002-9 All rights reserved. 13
Patterns of Growth in Dual
Economies: Challenges of
Development in the 21st Century
Literature regarding the basics of classical development emphasizes on the relationship between economic growth and changes in production struc-ture. It also allocates special properties to industry, and more specifically to the ability of industrialization to create and combine a series of comple-mentarities, scale properties, and external economies to generate a sustain-able cycle of resource mobilization, increasing productivity, rising demand, income, and economic growth.
Changes in the global economy have contributed to the renewed discussions on the role of structural transformation in achieving sustained economic growth and development. The catch-up failure of many devel-oping regions, which are often associated with “traps” and downturns (i.e., low-development traps, middle-income traps, and premature deindustrial-ization); the end of windfall export gains led by the commodity price boom in 2000s; and the continued vulnerability of many developing regions to external shocks have also added to this discussion (UNCTAD, 2016).
The dual relationship between climate change and development serves as yet another important factor. On one hand, the effects of climate change create serious challenges to development; however, on the other hand, pri-oritization of economic growth and development has had major conse-quences on climate change and vulnerability. In its basic form, emission control and effective mitigation require not only the transformation of production systems but also the transformation of energy systems, includ-ing movinclud-ing away from traditional high-carbon energy sources (a phase-out of coal-fueled power plants), increasing fuel efficiency, deploying advanced renewable technologies, and implementing measures to increase energy efficiency (IEA, 2008).
This chapter attempts to bring all of these elements together within the context of developmental challenges for the 21st century. To this end, the broad contours of growth and adjustments in the global economy are
studied before, during, and after the 2008–09 global crisis. Four general pat-terns emerge from this analysis including the stagnation of wage incomes, the declining investment efforts, the consequent decline in the growth rates of productivity, and the compensatory rise in corporate and household in-debtedness. This chapter continues with a deeper investigation of the struc-tural sources of deindustrialization and the widening duality in both labor markets and technological diffusion. Finally, these ideas are linked with the macroeconomics of global climate change and the implications of the feed-back effects of the economy, resource-use, and environmental-degradation nexus.
2.1 PATTERNS OF GROWTH AND ADJUSTMENT
IN THE GLOBAL ECONOMY
The 21st century began with prolonged recession, lopsided growth, and widening income inequalities, consequently producing social exclusion, segmentation, and escalating regional social conflicts. The eruption of the financial crisis in the United States in September 2008 produced negative growth rates and led to the total collapse of global product in 2009, the first time this had happened since the great depression in the 1930s. The ensuing adjustment pathways did not bring the expected recovery, as the centers of the global economy and its peripheries drifted into stagnation and mount-ing debt and experienced rismount-ing inequalities in income and wealth, deepen-ing segmentation of precarious global workdeepen-ing environments, and increased dualities along formal and informal jobs.
These factors led to this period being termed the great recession, and highlighted the prolonged strains of missing spikes of new growth and the turtle habitat of the global economic system. Since the start of the crisis, the average annual rate of growth of per capita income of the world economy has averaged 1.5%. This is a noticeable slowdown against the so-called “golden era” of global capitalism, which roughly encom-passed the post-World War II period. Of note is the decline in the rate of per capita income growth in the developed world, which fell from an average of 3.5% during 1950–80 to 1.1% during the post-2009 great recession.
Although the average growth rate of per capita income seems to have increased for the developing world as a whole (Table 2.1), this is ob-served to be mostly contained to China and other Asian economies. In contrast, a decline in the growth rate by more than 50% was observed
for Latin America, and divergence for the sub-Saharan African economies (Tables 2.2 and 2.3).
This “new normal” has set the stage as a new vocabulary has emerged to characterize the dilemmas of attempting to narrate isolated (and unsus-tained) episodes of growth within an overall mass of stagnation and income polarization. For example, traditional concepts of “developing economies” or “industrial and finance capital” became neutral terms, such as “emerging markets” or “market players.” New mystified jargon such as “Quantitative easing,” “decoupling,” and “the zero bound” have also been implemented
A thorough explanation of the nature and causes of the great recession is beyond the focus of this study. Nevertheless, it is pertinent to identify its dis-tinguishing (and structural) features including the stagnation of wages, the declining investment effort, the decline in the rates of productivity growth, and the rise in corporate and household indebtedness.
2.1.1 Stagnant or Falling Real Wages Across
the Global Economy
The collapse of the Soviet system and the opening of the Chinese and Indian markets on the global platform have together added 1.5 billion new workers to the global economically-active labor force. This has led to a doubling of the labor force and a reduction of the global capital-labor ratio by 50%. With the intensified pressures of unemployment, wage earners have witnessed a “race to the bottom,” in terms of their wage remunerations, social rights, and working conditions. Complemented by neoliberal policies invoking flexibility and privatization, the global labor force had suffered serious informalization and vulnerability, deterioration of income distribu-tion, and increased poverty.
Table 2.1 Per capita income growth rates (%) in the world economy
1951–80 1981–2015 2001–10 2010–15 Developed economies 3.5 1.8 1.2 1.1 United States 2.3 1.8 0.9 1.4 Developing economies 2.7 3.8 5.8 4.0 Africa 1.8 1.2 3.0 1.8 Latin America 2.6 1.3 2.4 1.1 Asia 2.8 5.0 7.0 4.9 China 2.3 7.7 11.1 7.2 Global 2.7 2.1 2.1 1.5
Source: UNCTAD, 2016. Trade and Development Report. Structural Transformation for Inclusive and Sustained Growth. United Nations publications, New York and Geneva; TDR, Table 2.2.
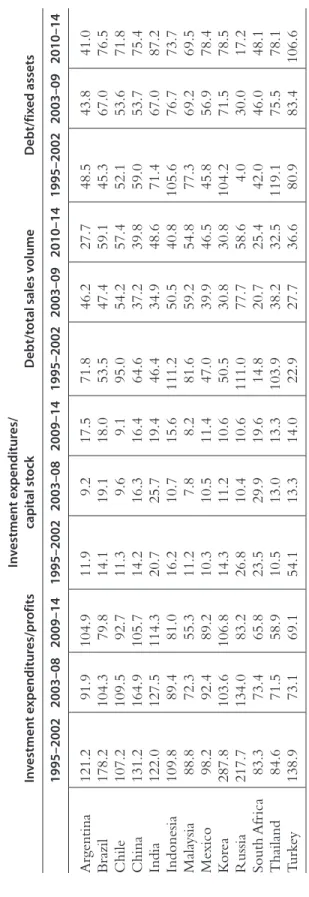
Table 2.2 Nonfinancial c or por ations: in vestmen t expenditur
es and debt indica
tors (%) In vestmen t e xpenditur es/pr ofits In vestmen t e xpenditur es/ capital st ock Debt/t otal sales v olume Debt/fix ed assets 1995–2002 2003–08 2009–14 1995–2002 2003–08 2009–14 1995–2002 2003–09 2010–14 1995–2002 2003–09 Argentina 121.2 91.9 104.9 11.9 9.2 17.5 71.8 46.2 27.7 48.5 43.8 Brazil 178.2 104.3 79.8 14.1 19.1 18.0 53.5 47.4 59.1 45.3 67.0 Chile 107.2 109.5 92.7 11.3 9.6 9.1 95.0 54.2 57.4 52.1 53.6 China 131.2 164.9 105.7 14.2 16.3 16.4 64.6 37.2 39.8 59.0 53.7 India 122.0 127.5 114.3 20.7 25.7 19.4 46.4 34.9 48.6 71.4 67.0 Indonesia 109.8 89.4 81.0 16.2 10.7 15.6 111.2 50.5 40.8 105.6 76.7 Mala ysia 88.8 72.3 55.3 11.2 7.8 8.2 81.6 59.2 54.8 77.3 69.2 Mexico 98.2 92.4 89.2 10.3 10.5 11.4 47.0 39.9 46.5 45.8 56.9 K or ea 287.8 103.6 106.8 14.3 11.2 10.6 50.5 30.8 30.8 104.2 71.5 Russia 217.7 134.0 83.2 26.8 10.4 10.6 111.0 77.7 58.6 4.0 30.0 South Afr ica 83.3 73.4 65.8 23.5 29.9 19.6 14.8 20.7 25.4 42.0 46.0 Thailand 84.6 71.5 58.9 10.5 13.0 13.3 103.9 38.2 32.5 119.1 75.5 Turk ey 138.9 73.1 69.1 54.1 13.3 14.0 22.9 27.7 36.6 80.9 83.4
Table 2.3 I nv estmen t expenditur es and a ver age labor pr oduc ts in selec ted c oun tr ies R at e of g ro wth in vestmen t e xpenditur es (%) R at e of g ro wth of a ver age labor pr oduc tivit y (%) R at e of Gr owth of Labor P roduc in I ndustr y (%) 1970– 79 1980– 89 1990– 99 2000– 07 2010– 14 1970– 79 1980– 89 1990– 99 2000– 07 2010– 14 1970– 79 1980– 89 1980– 89 2000– 07 2010– 14 De veloped economies 3.4 2.5 2.6 4.8 0.9 3.1 1.8 1.6 2.1 0.8 2.5 2.8 3.1 2.8 Sub-Saharan Afr ica 4.2 − 0.8 1.9 9.1 7.4 1.8 0.3 0.6 2.9 2.3 0 − 0.2 − 0.7 0.5 Latin Amer ica 7.1 − 2.8 5.2 5.9 5.4 1.9 − 2.0 1.2 1.3 1.5 1.3 − 1.7 2.2 1.5 Argentina 3 − 7 9.7 6.6 2.0 1.2 − 2.8 3.7 0.3 2.2 1.7 − 1.4 6.9 − 0.7 − Brazil 9.4 − 1.6 1.8 2.6 1.8 4.2 − 1.2 1.3 0.8 0.8 3.4 − 2.8 2.9 0.0 − Chile − 1.0 4.4 7.3 8.3 5.2 1.3 − 0.8 3.8 1.7 1.7 − 0.3 − 0.5 6.2 0.1 − Mexico 7.3 − 2.7 4.8 3 3.2 1.3 − 1.6 0.1 0.8 1.3 0.6 − 1.7 0.4 0.6 East Asia 10.4 8.7 6.8 14.1 9.3 3.0 6.3 6.3 6.0 4.2 0.8 4.9 9.1 6.4 China 7.2 6.5 13.8 12.5 8.1 1.2 6.5 7.8 8.7 7.2 − 1.6 4.8 10.4 7.1 K or ea 16.3 11.0 4.5 3.7 1.7 4.7 6.1 4.9 3.3 1.2 3.2 5.0 7.7 5.6 South East Asia 10.8 5.0 2.4 4.7 5.7 3.6 2.4 2.6 2.8 3.2 2.5 1.5 1.8 2.5 Indonesia 13.6 7.4 1.3 6.7 6.6 3.7 1.9 1.8 3.2 4.9 3.2 − 0.4 2.3 2.4 Mala ysia 14.2 4.7 4.0 3.7 9.1 4.8 2.5 3.5 3.0 1.9 0.2 2.0 0.9 4.0 The Philippines 10.4 − 0.5 1.7 3.1 7.0 1.9 − 1.0 0.1 2.1 4.8 4 − 2.9 − 1.0 1.9 Thailand 6.5 8.6 − 3.5 7.4 2.7 5.3 4.6 4.4 3.2 2.8 2.5 5.9 2.3 1.9 South Asia 6.5 3.1 5.6 8.1 4.7 1.3 1.8 2.6 2.8 3.8 1.8 1.2 3.1 1.3 India 3.9 6.3 6.8 12.5 3.8 0.5 1.8 2.9 4.1 5.0 2.3 1.3 0.7 3.3 W est Asia 10.7 − 0.8 3.1 10.8 − 2 2.9 − 3.5 0.4 1.2 − 1.7 3.0 − 2.1 1.4 2.6 − Turk ey 4.4 9.2 3.0 6.8 2.2 2.6 2.5 1.1 4.0 1.2 5.0 − 0.4 0.6 2.6 − Source : UNCT AD , 2016 . T rade and De velopment Repor t. Str uctural T ransfor
mation for Inclusi
ve and Sustained Gr
owth.
United Nations pub
lications,
Ne
w
York and Gene
Global unemployment initially hit the young. For example, in its 2016 World Employment and Social Outlook, the International Labor Organi-zation (ILO) reported that open unemployment in those aged 15–24 had reached 71 million. Of these, 53.5 million resided in the newly emerg-ing market economies, the so-called dynamic manufacturers of the world. The rate of youth unemployment in these economies was estimated to be 13.6%, while the global average stood at 13.1%
Problems for the young are not limited to the threat of unemployment. According to the ILO report, poverty was also a serious threat to those youths who were unable to find a job. The ILO reported that 156 million young workers lived under conditions of absolute poverty. Researchers set the limit of absolute poverty at USD 3.10 per day, and found that this figure amounted to 37.7% of those who were employed. Therefore one-third of the employed youth were working under conditions of absolute poverty.
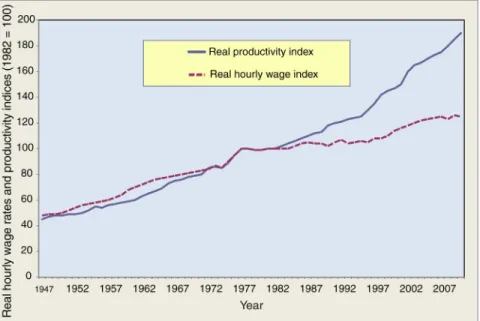
The declining trend in wage remunerations is most vividly seen for the US economy in Fig. 2.1. In this figure the hourly real wage rates in US private manufacturing are contrasted against real labor productiv-ity throughout the post–World War II period. During 1950–80 the rise of real wages was in tandem with productivity; however, 1980 changed
Figure 2.1 Real hourly wage rates and productivity in USA private manufacturing
(1982=100). (Modified from Economic Policy Institute, Washington DC. http://www.epi.
this scenario and signaled a different regime in the global economy. This is depicted best in David Harvey’s seminal observation that “something sig-nificant has changed in the way capitalism has been working since about 1970” (Harvey, 1989, p. 192).
As Fig. 2.1 attests, the link between labor productivity and real wages was broken after 1980. This was known as the “age of neoliberal reform,” which was characterized by increased flexibility of the labor markets, a re-duced role of the social welfare state, and an intensified commercialization of the public services. However, what lay at the heart of this restructuring was the ascendancy of finance over industry, a global process of finan-cialization, which imposed its logic of short-termism, liquidity, flexibility, and mobility over the objectives of long-term industrialization, sustainable development, and poverty alleviation within social welfare-driven states. Financialization is a loose term, and no consensus exists among econo-mists on its definition. In line with Arrighi’s The Long Twentieth Century, Krippner (2005, p. 172) defined it as a pattern of accumulation in which profits accrue primarily through financial channels rather than through trade and commodity production. Epstein (2005, p. 3) stated that “finan-cialization means the increasing role of financial motives, financial markets, financial actors and financial institutions in the operation of domestic and international economies.” In the following chapter, financialization is con-sidered as a phenomenon, which is described by increasing financial mo-tives, and the volume and impact of financial activities within and among countries.
A large number of developing countries have suffered deindustrializa-tion, informalizadeindustrializa-tion, and worsening of the position of wage labor under these conditions, thus resulting in a deterioration of income distribution and increased poverty. Many of these phenomena have occurred in tandem with the onset of neoliberal reform, which has imposed the rapid liberalization of trade and the premature deregulation of indigenous financial markets. Thus all economies (industrialized or peripheral) have experience wage income collapses and a fall in the income share of wage labor in aggregate domestic products. This could only have been sustained via increased indebtedness and speculative ventures and not investments in real fixed capital.
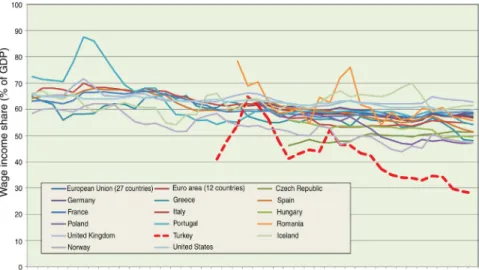
The concomitant erosion of incomes has been a common observa-tion in all the global economies. A direct reflecobserva-tion of this assessment is portrayed in Fig. 2.2, where the wage income share (as a ratio of re-spective GDP levels) is documented. The figure uses data from the UN AMECO database and shows that income compensation for almost all
major economies has been on a declining trend since the early 1970s. The decline of wage costs is expected to lead to a general tendency of the rise of profitability of capital.
2.1.2 The Consequent Rise in Profitability did not Lead
to the Warranted Investment Push
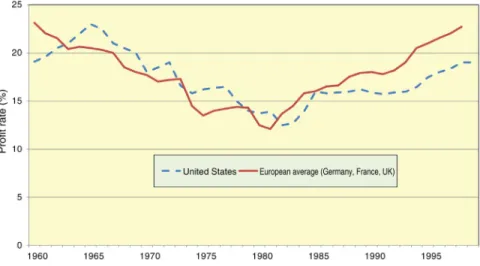
Evidence supports the proposition that the post-1980 period offered a viable environment for expanding the profitability of global capital. For example, Orhangazi (2008) supported his theories of financialization of the US economy using his calculation of the profit rate in nonfinancial corpo-rations over the postwar era. Orhangazi reported a secular decline of the profit rates of the nonfinancial corporations after the second half of the 1980s. After an extended period of restructuring during the 1980s, under the supply-side economics of Ronald Reagan and Paul Volcker, the profit-ability was observed to rise. Orhangazi’s findings were also supported by the work of Duménil and Lévy (2001, 2004). In their analysis of the profitabil-ity of capital in the United States and Europe, they reported the behavior of the rate of profit (as measured by the ratio of net product minus total cost of labor) to the value of the stock of physical capital. Their data corroborated Orhangazi’s findings with even more pronounced tendencies. As clearly Figure 2.2 Adjusted wage share: total economy: as percentage of GDP at current
market prices (compensation per employee as percentage of GDP at market prices per person employed). (Data taken from European Commission Economic and Financial Affairs, AMECO database).
shown in Fig. 2.3, the post-1980 patterns of profitability revealed a break-through for private capital returns in United States and Europe.
What is hidden beneath the path of aggregate profitability in Fig. 2.3 is the financialization of the patterns of accumulation. To fully account for the divergent patterns of finance over industrial profitability, Fig. 2.4A and B shows yet another aspect: it was actually the rise of financial returns that increased aggregate profitability. As stagnation of industrial profit rates deepened, the rise of financial profit opportunities compensated for such losses. Financialization was then the major response of capital in its quest for expansion, profits, and further expansion.
It was at this juncture that the introduction of debt instruments under post-1980 financialization enabled the middle classes to become a compo-nent of final demand. During a period of falling incomes, newly created debt instruments helped the American (and other economies) working class to become part of the consumerist culture. As the level of private savings to the gross domestic product fell to negative ratios, household debts rapidly accumulated. Therefore financialization was opportune, not only in terms of compensating the loss of industrial profitability, but also for expanding the consumption power for middle-income households that would have otherwise experienced significant income losses.
Data from the Bank of Settlements revealed that nongovernmental cor-porate debt accumulation has been the driving force behind this episode. Figure 2.3 Profit rate in the private sector, USA and Europe. (Duménil, G., Lévy, D., 2001. Costs and benefits of neoliberalism. A class analysis. Rev. Int. Political Econ. 8 (4), 578–607).
Accordingly, nonfinancial corporate debt in the developing emerging mar-ket economies rose from USD 9 trillion in 2008 to USD 25 trillion in 2015, almost doubling as a ratio to GDP from 57% to 104% (Table 2.2). Taking data from selected economies in Table 2.2, the basic message is that invest-ment expenditures have been on a declining trend in comparison to both aggregate returns to capital (profits) and the installed levels of capital stock. Figure 2.4 (A) US: Profit rate of nonfinancial corporations. (B) France: profit rate of
non-financial and non-financial corporations. (Duménil, G., Lévy, D., 2001. Costs and benefits of neoliberalism. A class analysis. Rev. Int. Political Econ. 8 (4), 578–607).
The most rapid declines were observed in countries, such as Korea, Turkey, and Russia; however, no country has displayed an opposing (positive) trend. The third and fourth column blocks in Table 2.2 reveal that accumulated debt has fallen against total sales, but has risen against fixed assets.
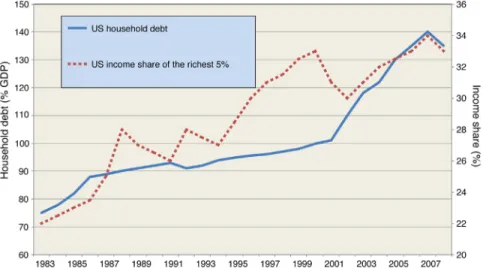
Another characteristic of the debt problem has been the positive corre-lation between the rise of household debt and income concentration at the upper scale. Data on US household debt reveals that (as a ratio to GDP) it rose from 75% in the early 1980s to in excess of 130% by the end of 2010. As a parallel development, a rise in the income share of the richest 5% of the population was observed from 22% to 34% (Fig. 2.5).
These observations lead us to propose that, on the one hand, indebted-ness enabled the maintenance of effective demand despite falling incomes and declining productivity; however, it also led to the expansion of casino capitalism as new financial instruments were created and the global financial markets turned into a melting soup.
Meanwhile, the advent of financialization led to the short-term and highly-volatile expansion of hot finance. With the ascendance of finance over industry, loanable funds were provided for the expansion of lucrative products of speculative finance. Investment expenditures on fixed capital also stagnated and formed the basis for the faltering productivity gains and expanding structural unemployment. Increasing poverty levels, worsen-ing income distribution, and intensification of social exclusion and social Figure 2.5 USA household debt and income share of the richest 5%. (Modified from Michael Robert: Is inequality the cause of capitalist crises? Available from: http:// thenextrecession.wordpress.com/).
violence were the unavoidable outcomes as deindustrialization became a real threat to the viable future of the global economy.
2.1.3 Decline in Productivity
The divergence of investment priorities away from industry toward specu-lative finance has taken its toll on fixed investments in the global economy, especially in industry. The overall decline in fixed investments was observed to be one of the “stylized facts” of the first 2 decades of the 21st century. As documented in Table 2.3, the growth rate of fixed investment expendi-ture in the developed world slowed significantly from an annualized rate of 3.4% in the 1970s to less than 1.0% during 2010–14. The rate of investment growth fluctuated in sub-Saharan Africa, but the decline was most visible in West Asia and Latin America. In addition, many of the “tigers” in the South Asia region also seem to suffer from a decelerating pattern of investment expenditure.
Deceleration of fixed investment expenditure was, not surprisingly, a factor that explained one of the greatest enigmas of current times: an overall decrease in the rate of productivity. The second and third sets of columns in Table 2.3 report the average labor productivity, and Figs. 2.6 and 2.7A–B show total factor productivity (TFP) growth rates across selected countries. Labor productivity, particularly in the industrial sectors, was negative in many countries during the great recession, and seems to be persisting into the 3rd decade of the 21st century. Industrial labor productivity growth was
Figure 2.6 Productivity growth slows down in the core. (OECD, Available from: www.
reported as zero in Latin America, while East Asia showed sustained, and yet volatile, rates of growth.
A comparison of TFP between the 1st decade of the 21st century and the early 2010s shows that the deceleration was significant in many devel-oped countries (Fig. 2.6). The productivity growth gap between the 1st and 2nd decade was most visible in the United States and Japan, and although Germany and France seemed to have achieved some progress, their perfor-mances were still below their respective historical averages.
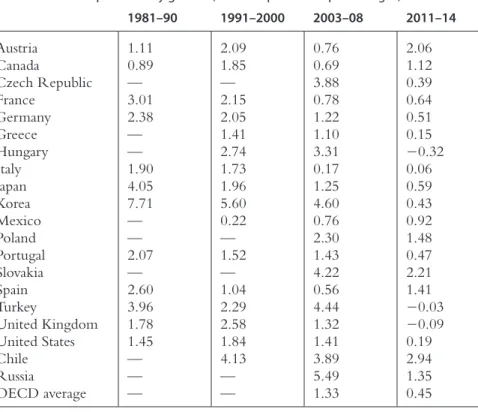
Comparisons across longer time periods also revealed similar observa-tions. Data in Table 2.4, and Fig. 2.7 illustrate that the declining produc-tivity growth rates were the cause of the great recession in the post-2010 period. Table 2.4 indicates that the slowdown in the rate of productivity Figure 2.7 (A) USA total factor productivity index (2011=1.00). (B) Turkey: total factor
was already part of historical reality for most OECD countries at the turn of the century. In comparison to the 1980s, only two countries (Austria and Canada) achieved increased rates of productivity growth. In contrast, Hungary, Turkey, and the United Kingdom had negative productivity gains, while the OECD average fell sharply.
At this juncture it might be useful to refresh our understanding of the historical trends in the rate of productivity growth. Fig. 2.7 documents TFP growth over a longer time period in two case studies: (1) the United States, which is the center of the global economic system; and (2) Turkey, which is the main focus of this study. Penn World Table data from the University of Groningen shows that US TFP had two main surges (in the 1950s and in 1980–2000) and two plateaus of deceleration between these surges (in the 1970s and the current phase). Conversely, TFP growth was both volatile and erratic in Turkey, a typical observation seen in the most emerging econo-mies of the developing world.
These historical observations were carried over to the future projec-tions in the OECDs 2014 policy paper on “Policy Challenges for the Next Table 2.4 Rate of productivity growth (values expressed as percentages)
1981–90 1991–2000 2003–08 2011–14 Austria 1.11 2.09 0.76 2.06 Canada 0.89 1.85 0.69 1.12 Czech Republic — — 3.88 0.39 France 3.01 2.15 0.78 0.64 Germany 2.38 2.05 1.22 0.51 Greece — 1.41 1.10 0.15 Hungary — 2.74 3.31 −0.32 Italy 1.90 1.73 0.17 0.06 Japan 4.05 1.96 1.25 0.59 Korea 7.71 5.60 4.60 0.43 Mexico — 0.22 0.76 0.92 Poland — — 2.30 1.48 Portugal 2.07 1.52 1.43 0.47 Slovakia — — 4.22 2.21 Spain 2.60 1.04 0.56 1.41 Turkey 3.96 2.29 4.44 −0.03 United Kingdom 1.78 2.58 1.32 −0.09 United States 1.45 1.84 1.41 0.19 Chile — 4.13 3.89 2.94 Russia — — 5.49 1.35 OECD average — — 1.33 0.45
50 Years” OECD (2014). The projections stated that the global economy would likely slow from its yearly average of 3.6% during 2014–30 to 2.7% in 2030–60, and the growth rate of the developed world would slow to as little as 0.5% by 2060. It was also estimated that greenhouse gas (GHG) emissions (from industrial processes and fossil fuel combustion) would rise twofold, increasing from 48,700 to 99,500 million tons by 2060. As a conse-quence, the negative effects of climate change would likely lead to produc-tion and income losses of 1.5%–5% across Asia and East Asia.
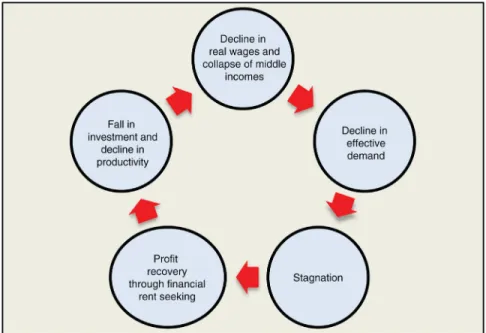
These observations revealed a vicious circle, whereby a decline in wage incomes and the collapse of middle incomes led to a fall in effective de-mand and subsequent stagnation. The post-1980 scenario saw profit recov-ery through financial rent seeking, albeit by diverging saving funds away from fixed investments toward financial rentier activities with cutthroat and damaging speculative bubbles, and through the significant deceleration in productivity gains (Fig. 2.8).
The main aim of this manuscript is to break this vicious circle. In the flowing pages, viable alternative policy scenarios, such as the activation of green employment and green growth development strategies, are suggested to address the problems of duality and segmentation by utilizing the abil-ity of these instruments to combat climate change. A deeper analysis of the
current challenges facing the developing world (i.e., structural transforma-tion, deindustrializatransforma-tion, and duality) are initially discussed.
2.2 DEVELOPMENTAL IMPORTANCE OF STRUCTURAL
CHANGE AND INDUSTRIALIZATION
Economic development involves growth and structural change, and eco-nomic growth is intrinsically linked to changes in production structure. In its broadest meaning, successful structural transformation is associated with a shift in the share of output and employment from low- (agriculture) to high-productivity activities (Ros, 2000). This has typically meant a de-creasing share of agriculture in total value added and employment, and an increasing share of industry and services. This long-term process has been accompanied by a shift in the labor force from rural to urban areas, and the continuous reallocation of employment from agriculture to services and industry.
However, this process is not simple and it does not achieve the final target. “Successful” structural change involves adopting and adapting to existing technologies, diversifying production activities, and upgrading production structures across the economy (Amsden, 2001). Hence the overall process strongly follows the idea of “cumulative causation,” which was put forward by Young (1928) and Schumpeter (1939) to explain eco-nomic growth and development. The idea was cultivated and structured further for the analysis of structural change (Hirschman, 1958; Kaldor, 1966; Myrdal, 1957)1 and emphasizes that at the heart of structural change lies the process of “cumulative causation,” which reinforces and increases the pace of economic growth. Industrial expansion creates employment, increases incomes and demands, and leads to increased productivity.
Kaldor’s framework (Kaldor, 1966, 1967) provides a thorough theoretical basis and a set of empirical regularities that emphasize the dynamics of cu-mulative causation. The framework emphasizes the central role of industry (specifically manufacturing) by bringing together the notions of “engine of growth” sectors, “economies of scale,” and “sectoral shifts” in an informative way. The framework recognizes that manufacturing plays an important role in generating production linkages and pulling the rest of the economy, thus 1 The idea reappears in more recent analyses of industrial take-off (Matsuyama, 1992; Murphy
et al., 1989) and in new economic geography literature (Combes et al., 2008; Harris, 1954; Krugman, 1991).
producing productivity gains through dynamic economies of scale. High-productivity gains in manufacturing create technological externalities to the rest of the economy. Thus Kaldor derived conditions that linked growth output, employment growth, and productivity within and among different sectors of the economy, which are now known as Kaldor’s growth laws2.
Broadly speaking, Kaldor’s Growth Laws emphasize that industrializa-tion is critical to both faster economic growth and structural transfor-mation. The main argument of the laws is that there is a strong causal relationship between the growth of manufacturing output and the growth of manufacturing productivity. This is based on the characteristics of indus-try, which offer special prospects for capital accumulation and the acquisi-tion of new technologies, and provide greater opportunities for dynamic economies of scale. Manufacturing growth not only has spillover effects on other sectors but is also associated with the reallocation of resources and employment from other sectors (normally with lower productivity levels), therefore aggregate productivity growth of the economy is positively as-sociated with the growth of manufacturing output and employment3. Thus manufacturing tends to have a greater impact on aggregate output and productivity4.
The composition of demand will progressively turn toward services, a sector that will incorporate a growing share of the work force due to its slower gains in productivity. The classic structural transformation in the economy described by Kuznets (1973) therefore involves a shift from agri-culture to nonagriagri-culture and subsequently from industry to services. 2 Kaldor’s laws, as a set of empirical regularities emphasizing the sectoral composition of
output and interallocation of labor from low- to high-growth sectors and the dynamics of productivity, may also be considered to set the foreground for (endogenous) growth models that do not rely on diminishing returns to capital and that recognize sectoral differentiation.
3 Kaldor focuses on productivity gains for the overall economy to highlight that it is not only
important that resources are reallocated from low- to high-productivity (manufacturing) activities to increase average productivity levels (the notion of temporary structural bonus,
Baumol et al., 1985, 1989), but rather that this must raise the average productivity growth over time (the notion of dynamic structural change bonus).
4 Such effects spread to the whole economy and lead to “cumulative causation” through a
variety of linkages. Manufacturing has the strongest Hirschmanian-type (Hirschman, 1958) backward (expanding demand for its inputs) and forward (expanded production possi-bilities for downstream) input–output linkages. Moreover, industry also serves as the focal point of learning linkages through the generation of technology and knowledge spillover. Reallocation effects further reinforce income linkages through Kuznetsian channels of rural–urban migration, and through multiplier effects of changing consumer demand due to higher incomes generated in the “pulling sector” of the economy.
Both supply and demand factors are significant in this process. The demand-based argument follows the shifts in consumption structure as countries move toward higher levels of per capita income. As per capita income increases, the share of agriculture initially decreases due to low-income elasticity of demand for its products, and thus the share of man-ufactured goods increases (Engel’s Law)5. As income growth continues, consumption preferences move from the manufacturing to the services sector. The supply-based explanation follows the argument that industrial manufacturing is the leading sector of technological upgrading, and innova-tion and productivity growth are generally higher in this sector compared to the other sectors of the economy. Thus rapid productivity growth implies a reduction in the share of manufacturing employment, but not necessarily in the share of value added (Rodrik, 2015).
2.2.1 Myths and Miracles: Trends in Structural Change
in Developing Countries
The changes in the sectoral composition of output and employment (rela-tive to GDP per capita) in the period since 1970 largely confirm the dynam-ics of economic growth described in the previous section; however, there are some very important differences and caveats. Most advanced economies with existing high-income levels saw a reduction in the relative weight of manufacturing output and employment and an increase in the relative weight of services. Complementarities in these economies ensured a steady rise in “modern services” (i.e., transportation, energy, communication, and finance), which were able to produce “decent” jobs in terms of productivity and remuneration. As the economies moved to higher levels of GDP per capita, the shares of agricultural and services employment declined and in-creased, respectively. Fig. 2.9 depict the shares of developed and developing countries in world manufacturing value added during 1970–2013. In 1970, developing countries accounted for 30% of global industry value added in current USD prices and 19.5% in constant 2005 USD prices. In nominal terms, the increasing trend for the developing economies in the 1970s was followed by a collapse during the 1980s and 1990s (due to the debt cri-sis and real depreciation of the currencies of developing country), and a recovery with a higher rate of growth in the 2000s. In 2010, developing 5 One implication of this economic-development process is that countries specializing in
agriculture-based or commodity-based primary production will eventually face demand obstacles to growth.
economies had a higher share of global industry value added than advanced economies. In real terms, the share of developing economies continued to increase slightly during 1970–2013, and reached 45% in 2013. Therefore from a low base in 1970 (and from a much lower base when the immedi-ate aftermath of World War II is considered), developing economies have experienced significant increases in industrial production. The distinction between developed and developing countries, in terms of real per capita in-come and associated sectoral shares of output and employment, is also clear. For industry in general, and the manufacturing sector in particular, there is a point beyond which the shares started to decline.
“Deindustrialization” has generally been associated with the growth of advanced economies, and the term is used to define the secular decline in manufacturing employment, a phenomenon that had already started in the 1960s. Therefore deindustrialization in developed economies is con-sidered a natural result of the shift from manufacturing toward services6. Deindustrialization out of economic dynamism assumes that industrializa-tion has already exploited the expansion period and has reached its final stages (Cruz, 2015). It also assumes that the services sector has matured to absorb new workers in high-quality jobs. Deindustrialization in advanced economies generally occurs when industrialization has already raised overall 6 The early contributions of Baumol (1967), Fuchs (1968), and Rowthorn and Ramaswamy
(1997, 1999) provided a framework to analyze the possible explanations (and contributions) of the phenomenon.
productivity, disseminated its technological capacities, and consolidated a domestic market (UNCTAD, 2016).
However, deindustrialization alone is not sufficient to describe the path that many low- and middle-income developing economies have experienced since the 1980s. With some exceptions (largely in Asia), developing economies have also been subject to substantial deindustri-alization, especially since the 1980s; however, these countries began at levels of per capita income that were much lower than when advanced economies started to deindustrialize; a phenomenon labeled as “premature deindustrialization.”7
The spread of industry/manufacturing to developing countries oc-curred largely during the post-World War II period. Manufacturing has since emerged as a crucial sector in the economies of developing econ-omies, perhaps fundamentally changing the structure of global industrial production and trade. Large quantities of industrial activity and industri-al production have moved from advanced to developing countries; some developing economies have displayed periods of rapid catch-up (i.e., East Asian late-industrializing countries), while some have experienced periods of collapsing growth (i.e., Latin America and Africa).
However, the development observed in advanced economies has only partially been replicated in developing countries. These uneven experiences are seen using the indicator of “industrial convergence.” Fig. 2.10 displays the manufacturing share of GDP relative to that of the average of advanced G7 countries. The figure shows that there has been a tendency for develop-ing countries to narrow the industrialization gap. This tendency is closely related to the trends and associated positional changes of the developed and developing countries, and it is also a result of the deindustrialization of the advanced economies. Nevertheless, regional differences in the narrowing of the industrialization gap are apparent; for example, Asian countries have not only been successful in closing the gap, but in some cases (East and South East Asia) they have overtaken advanced countries in industrialization. However, the collapse of the manufacturing sector in transition economies, and the limits of the Latin American industrialization process, are also ap-parent in Fig. 2.10. One of the most striking observations from the figure is that, as of 2010, countries in sub-Saharan Africa have been unable to narrow the industrialization gap with developed economies, and have displayed re-gression with respect to the variable under concern. Hence the considerable 7 See Palma (2005, 2008), Rodrik (2015), and Tregenna (2009) for further discussions on the
regional unevenness in the industrialization efforts and performances of developing countries in the post-1970 period are emphasized, with Latin America and sub-Saharan Africa experiencing failures and East and South East Asia experiencing major improvements.
On closer inspection, there has been clear decline in the share of output and employment provided by agriculture. However, several middle-income countries, and some least developed countries, have experienced relative declines in their shares of manufacturing output and employment before reaching per capita income levels that were significantly lower than those historically observed in advanced economies. Such tendencies could im-ply a fundamental break from previous norms, with services replacing (or at least complementing) manufacturing as an engine of economic growth (Dasgupta and Singh, 2005, 2006). However, it could also be argued that this is far from being “a proper experience of industrialization” (Rodrik, 2015), and is rather a process of “killing of the necessary increasing returns sector of the periphery” (Reinert, 2008). Such discussions are also relevant for questions of whether natural resource-based industries, which often depend Figure 2.10 Industrial convergence or divergence using the share of manufacturing
in GDP as a percent of that of advanced G7 countries. EA_AS, East Asia; LA+CA, Latin America and the Caribbean; NR_AF, North Africa; SE_AS, South-east Asia; SO_AS, South Asia; SS_AF, Sub-Saharan Africa; TRANS, Transition Economies. (UNSD).
on static comparative advantage, could significantly contribute as comple-mentary engines of growth (Cimoli and Katz, 2003; Lawrence, 2005; Mc-Millan et al., 2014).
The diversity in the performance of developing economies also points to different relationships between economic growth and structural change (as outlined earlier). Table 2.5 provides data used to obtain a better under-standing of the links between growth and structural change in develop-ing regions. For example, the table presents the crucial macroeconomic elements of structural transformation including the GDP growth, share of manufacturing value added, aggregate employment growth, and labor pro-ductivity growth.
Two major points that arise instantly are the contrasts between the de-veloping regions, and the contrast between pre- and post-1980 for a num-ber of developing economies. With the exception of East Asia and South Asia (and sub-Saharan Africa post-2000), no developing region was able to maintain the annual GDP growth rates of the 1970s in the proceeding periods. The sharp decrease in GDP growth in Latin America, West Asia, and North Africa in the 1980s was concomitant with a sharp decrease in industry output growth during this time.
However, the regions that experienced reductions in GDP growth post-1980 did not experience an instant parallel decline in employment. Thus the adjustment of low-output growth rates fell onto lower labor productiv-ity growth rates. The average annual productivproductiv-ity growth during the 1980s was −1.9% for Latin America and −0.9% in sub-Saharan Africa.
Such employment-generating dynamics were clearly not sustainable in Latin America, at least not in industry. Thus employment growth in dein-dustrializing Latin America continued at rates that were comparable to that of industrializing Asia during 1980–2000, only at much lower productivity growth rates and in nonindustry sectors of the economy (i.e., in services and informal sectors, which are often associated with commodity booms). The North African countries in Table 2.5 (i.e., Egypt, Morocco, and Tuni-sia) and Turkey are examples of economies that tried to maintain some de-gree of industrialization with little structural changes to sustain productivity growth. The high growth rates seen in these countries in the 1970s has been decreasing, and has often swung abruptly between boom and bust depend-ing on the global economic conditions.
Thus the uneven performances in developing regions lies not in their differing abilities to generate industrial employment or the over-all economy, but in their remarkably different capacities to generate and
Table 2.5 Elemen ts of struc tur al tr ansf or ma tion Dev eloped coun tries La tin A merica
and the Caribbean East Asia South East Asia South Asia Sub -S ahar an A frica Nor GDP g ro wth (%) 1970s 4.1 4.5 7.3 7.3 3.0 3.4 6.1 1980s 2.7 1.4 8.1 5.4 4.7 2.4 4.5 1990s 1.5 2.6 4.9 4.9 4.8 2.9 3.4 2000–07 3.4 3.9 7.6 5.1 5.6 4.5 4.5 2010–14 1.2 3.1 6.6 4.8 5.8 5.4 2.4 Emplo yment g ro wth (%) 1970s 1.0 3.0 3.5 3.6 1.6 3.0 2.8 1980s 0.9 2.8 2.6 3.0 2.9 3.2 2.2 1990s − 0.1 2.2 1.5 2.3 2.3 2.2 2.4 2000–07 1.3 2.6 1.4 2.3 2.8 2.7 3.3 2010–14 0.3 2.0 1.3 1.6 2.0 3.1 1.6 Labor pr oducti vity gr owth (%) 1970s 3.1 1.7 3.7 3.6 1.3 0.5 3.3 1980s 1.8 − 1.9 5.8 2.4 1.8 − 0.9 2.3 1990s 1.6 1.2 5.0 2.6 2.6 0.2 1.0 2000–07 2.1 1.1 5.0 2.8 2.8 2.7 1.2 2010–14 0.8 1.3 4.1 3.2 3.8 2.7 0.8 Man uf actur ing v alue- added shar e (%) 1970s 26.4 21.7 28.3 17.7 16.2 12.7 20.8 1980s 22.8 20.8 34.9 22.3 19.3 14.8 17.0 1990s 20.6 21.6 34.2 24.5 20.5 15.6 20.0 2000–07 16.8 17.5 30.1 26.6 18.9 11.6 18.0 2010–14 14.7 14.5 29.4 23.1 17.7 9.6 16.7 Source : Compiled fr om GGDC-10 sector database , UNSD , WDI, KILM, TED .
sustain productivity growth. Most developing regions, with the excep-tion of Asia, have seen an increasing productivity gap relative to advanced economies. Only a few countries have shown the ability to catch up, or at least keep up, with the productivity dynamics of advanced economies, while simultaneously maintaining the dynamics for employment genera-tion (Fig. 2.11A–D).
80 70 60 50 40 30 20 10 0 50 45 35 30 25 20 15 10 5 0 40 1970 1972 1974 1976 1978 1980 1982 1984 1986 1988 1990 1992 1994 1996 1998 2000 2002 2004 2006 2008 2010 1970 1972 1974 1976 1978 1980 1982 1984 1986 1988 1990 1992 1994 1996 1998 2000 2002 2004 2006 2008 2010
China India Indonesia Malayasia
Philippines Singapore South korea Thailand
Argentina Bolivia Brazil Chile
Peru Mexico Costa Rica Colombia (A) (B)
Labor productivity (USD/wor
ker)
Labor productivity (USD/wo
rk
er)
Figure 2.11 Relative labor productivity (% of developed countries, 2005 USD/worker) in
(A) Asia, (B), Latin America, (C) North Africa, and (D) sub-Saharan Africa. (Compiled from GGDC-10 sector database).
2.2.2 Potential Consequences of Premature Deindustrialization
Following the argument that industry is crucial for building production and links to sustain aggregate productivity growth, premature deindustrializa-tion would mean a reduced growth potential and reduced possibilities for convergence. Thus premature deindustrialization represents a pathological state as it has the potential to stop the economy from achieving its full growth, employment, and resource utilization potential (Singh, 1977).35 30 25 20 15 10 5 0 25 20 15 10 5 0 1970 1972 1974 1976 1978 1980 1982 1984 1986 1988 1990 1992 1994 1996 1998 2000 2002 2004 2006 2008 2010 1970 1972 1974 1976 1978 1980 1982 1984 1986 1988 1990 1992 1994 1996 1998 2000 2002 2004 2006 2008 2010
Egypt Morocco South Africa
Botswana Ethiopia Ghana Kenya Malawi
Mauritius Nigeria Senegal Tanzania Zambia
(C)
(D)
Labor productivity (USD/wor
ker)
Labor productivity (USD/wor
ker)
In line with the theoretical discussions presented in the previous tions, manufacturing tends to be the most technologically dynamic sec-tor and it exhibits unconditional convergence (Rodrik, 2013). Thus when premature deindustrialization occurs, the manufacturing sector weakens as the engine of growth. The prospect for sustaining aggregate productivity growth is also likely to simultaneously decline, as the economy becomes de-prived of the increasing returns-to-scale sector that provides the necessary environment to achieve technological progress, skill acquisition, and insti-tutional deepening. As the ability to generate sustained productivity growth is crucial for achieving structural transformation, stagnating productivity growth would eventually be associated with lower capital accumulation, employment, and income.
Slowdown in the economic growth rate leads to aggregate productivity stagnation, which coupled with declining investments, generates insufficient jobs and lower quality jobs. With a large surplus of labor in agricultural and other primary services, and with informal economies of considerable size, premature deindustrialization and lack of structural transformation place immense constraints on developing countries dynamically transforming their economies (i.e., with output, employment, and productivity growth) toward long-term development objectives.
Slow economic growth is associated with increased underutilization of resources, and a lack of structural transformation will also act as an addition-al factor in resource misaddition-allocation. The whole process will have adverse ef-fects on productivity. The dynamics for employment generation in modern sectors of the economy will be weak, and in such an environment, labor will be absorbed by low-productivity sectors (mostly auxiliary services) and the informal sector (i.e., low-quality jobs and low wages). These dual-economy conditions, coupled with reallocation effects and shifts in the structure of production, would further contribute to slow productivity growth. The ap-parent differences in productivity between sectors implies substantial losses in aggregate productivity. High unemployment and flexible labor markets put no pressure on wages and create no incentive for further investment to stimulate productivity growth. Thus slow economic performance and slow productivity growth create the basis for the growing (cyclical) underutiliza-tion of resources that characterize a low-growth environment, reflecting the conditions for reverse causality to take action and leaving a narrow space for any structural transformation to come about.
After a successful period of growth and development from the 1950s, the post-1980 period for many developing countries was characterized
by export-led growth strategies based on liberalization of the commodity and financial markets. In the context of export-led growth and liberalized trade, premature deindustrialization creates further challenges for successful transformation. Under such conditions, investments and domestic linkages to substitute imported capital goods are severely hindered, if not fully re-strained. Thus the country may become an exporter of (even manufactured) goods, mainly produced by imported capital goods and inputs. Therefore the (tradable) manufacturing sector would be deprived of all backward and forward linkages, reducing its potential to pull along the economy. Hence export-led growth cannot generate dynamics of sustained growth for the overall economy (Cruz, 2015).
Building upon such foundations, a broader perspective on structural change and growth emphasizes the growth and export performance of modern sectors of the economy. It stresses the importance of constantly generating new activities as well as the ability of these activities to ab-sorb surplus labor and promote integration with domestic sectors of the economy (Ocampo, 2008). Industry tends to have a greater potential for inducing deeper domestic integration. Domestic linkages not only trace the whole production process from raw materials to semifinished products, but they also trace to other sectors of the economy including modern services of transportation and communication and ancillary services. The degree of domestic integration of the economy further influences the ability of the domestic market to contribute to high and sustained growth.
2.3 DUALITY IN ECONOMIC THEORY: A SUMMARY
AND IMPLICATIONS
The narrative used to describe the consequences of premature deindus-trialization in developing countries, in effect, illustrates the framework to comprehend the relationship between structural transformation and economic growth. In developing economies, structural transformation is a multidimensional phenomenon that requires adopting and adapting to technologies, rapidly accumulating physical and human capital, substituting imports, and entering manufactured goods and services into world markets (Ocampo, 2008). Therefore analyzing the experiences of different develop-ing regions and countries is important to understand the nature of relation-ships between growth and structural change.
UNCTAD (2003) effectively outlined the process of structural trans-formation that leads to sustained productivity and economic growth.
The accumulation of capital leads to the employment of surplus labor and the use of underutilized resources in the production process, which is key to raising capita income and living standards in an economy. It is a crucial variable for growth and structural change as it simultaneously allows the expansion of production capacity and effective demand, and it also carries strong complementarities with other elements that determine long-term growth. Long-term economic success depends on sustained improvements in productivity via the acquisition of skills and technological progress. Thus each worker producing more from a given level of effort provides the basis for rising incomes and living standards. Therefore it is productivity gains, and not simply additional employment, that characterizes accumulation and growth. Such a process is invariably associated with structural changes in output and employment. This occurs through shifts in economic activities across agriculture, industry, and services, and through upgrading to high-er value-added activities within each sector with the introduction of new products and processes. The importance of structure to the development process is partly due to the fact that the overall level of income is closely related to the allocation of resources among sectors.
One theoretical alternative that contributes to our understanding of the causal relationships between structural transformation and economic growth embodies the notion of the “dual economy,” which has been built on contributions by Boeke (1953), Chenery and Syrquin (1975), Hig-gins (1956), Jorgenson (1961, 1966, 1967), Lewis (1954), and Ranis and Fei (1961). The dual-economy model served as one of the basic models of development theory for several decades after World War II, and it is also the basis of a vast amount of literature in development economics. Schol-ars including Mundlak (2000), Ros (2000); Temple (2005a,b); and Vollrath (2009a,b)8, emphasize the importance of considering and representing the interdependencies of different sectors, subsistence wages, patterns of unem-ployment and underemunem-ployment, labor market imperfections, and savings, and allowing explicitly for the possibility of (qualitatively) different types of growth.
Based on the conceptualization by Lewis (1954), the theory proposes a “dual structure” for developing countries, where two (or multiple) econo-mies with fundamentally different structures coexist and interact in a coun-try. One economy is usually regarded as the traditional sector, which is 8 Gollin (2014); Lombardo (2012); Rangazas and Mourmouras (2013); and Temple (2005a)
characterized by a stagnant backward structure that relies on elementary production technologies, unskilled labor, and natural resources. The other economy is represented as the modern sector, and utilizes advanced capital-intensive technologies and skilled labor. The interdependence among the economy sectors (which exhibit different asymmetric structures in terms of their productivity, labor and capital markets) and household saving and consumption behavior often leads to multiple qualitatively different equi-libria, which leaves ample room for policy intervention. Hence the theory allows the analysis of factor misallocation, urban unemployment, migration, informality, and international variations in productivity, and hence the in-teraction between growth and structural change.
In its basic form, the “dual-economy model” supposes a small open economy with two sectors and two factors of production. The traditional (agricultural) sector contains an abundant endowment of (unskilled) labor working with very low (near zero) productivity and for subsistence wage. Conversely, the modern (industrial) sector employs labor at a rate that is higher than the subsistence wage provided in the traditional sector. The “transfer” of surplus labor from the traditional sector to the modern sector affects aggregate labor productivity. It also contributes to the development of the modern sector by producing an investment fund financed by the surplus production in the traditional sector (Jorgenson, 1961; Ranis and Fei, 1961; Ruttan, 1968). Thus the model provides the basis for understand-ing: (1) the conditions for the breakdown of economic transformation that leads to sustained growth; (2) the characterization of the “turning point” at which the economy ceases to be “underdeveloped”; and (3) the implica-tions of technological change in agriculture (i.e., how innovaimplica-tions under the Green Revolution affect agricultural technology and productivity).
“Modern sector dualism” (Bertrand and Squire, 1980) uses the basic ideas of the traditional dual-economy models, but focuses more on labor market imperfections or market imperfections (which carry effects onto the labor markets). When wages or marginal products of labor are not equalized among the sectors of the economy, the aggregate TFP and dynamics of eco-nomic growth will inevitably be influenced by reallocation of labor from one sector to another. Wage differentials have been linked to spatial separa-tion between tradisepara-tional (rural) and modern (urban) sectors of the economy, therefore the “duality” framework can be further developed to study and understand the dynamics of urbanization and urban unemployment. Work by Harris and Todaro (1970), and the open economy version developed by Corden and Findlay (1975), provide the basis for analyzing informality
(urban unemployment) and the general equilibrium implications of rural– urban migration. More recent studies that have used dual-economy models to study the dynamics of informality, urbanization, and the relationship be-tween urbanization and economic growth include Banerjee and Newman (1993), Henderson (2010), Rauch (1993), and Yuki (2007).
The framework is especially relevant for studying the effects of eco-nomic dualism on income inequality and poverty (Bourguignon, 1990; Bourguignon and Morrisson, 1998; Temple, 2005b; Yuki, 2007). Deriving the conditions when economic growth becomes conducive for an egalitar-ian distribution of income, and how the share of the traditional sector in the economy interacts with these conditions, becomes especially important in the context of structural change and deindustrialization.
If the two sectors were also associated with geographical differences (i.e., the modern sectors are urban and the traditional sectors are rural), house-holds living and producing in different regions may also show behavioral differences. Such differences would be visible in the households’ decision to save, invest in education and human capital, and reproduce. This would therefore have important consequences on the dynamics of productivity and growth (Das et al., 2015; Masson, 2001; Rangazas and Mourmouras, 2013).
Finally, the duality framework can also be extended to study the interac-tions between environmental policies and economic growth. De Oliveira and Lima (2015) analyzed the dual relationship between pollution abate-ment policies (which affect modern sectors of the economy) and envi-ronmental quality affecting labor productivity. Their analysis shed light on the impact of environmental policies on profitability in the modern sector, savings, productivity, and growth dynamics. Furthermore, the conditions under which the country is led to an “ecological development trap” (i.e. the presence of a pollution abatement mechanism that operates when the cur-rent level of environmental quality is below its maximum attainable level) can also be analyzed.
2.4 MACROECONOMICS OF THE ENVIRONMENT
Existing evidence on the global economy suggests that growth over the next century is likely to be erratic and highly uneven. For example, an OECD (2014) report claims that the world economy will significantly slow down during the next 50 years. OECD researchers argue that this prognos-tication rests on two important factors: (1) the duality and unevenness of income distribution across functional and regional sense, with a consequent
rise in social exclusion and conflict; and (2) environmental pollution due to the threat of climate change. This section deals with the implications of economic growth in a dualistic manner for sustainability, resource use, envi-ronment, and climate change.
2.4.1 Sustainability, Resource Use, and the Environment
in a Dual World
Extensive research, particularly since the beginning of the 1970s, has fo-cused on the relationship between economic growth, the utilization of natural resources, and the changes in environmental quality. Studies have suggested that Earth has exceeded its ecological boundaries, especially since the Industrial Revolution (Hahnel, 2010). This is easily demonstrated by the ecological footprint indicator, which shows the geographical area required by human beings to meet the natural resource needs of various economic activities, which serve consumption at the end. Data from the Global Foot-print Network in 2010 stated that Earth cannot supply in 1 year the amount of natural resources warranted by our current annual consumption level, and consequently the stock of natural resources are rapidly declining. The authors observed that by 2010, 102 out of 139 countries had produced greater consumption footprints than their own biocapacities. It is possible for countries to consume more than the regeneration capacity of their own resources only if they import resources from other countries, otherwise their natural resource stocks would deplete. It is clear that none of these paths are sustainable in the long run. Moreover, the fact that some countries meet the deficit between their consumption levels and their biocapacities through imports cannot be ignored, as this exacerbates global inequalities in natural resource use and will have adverse social implications on a global level.
The first international document to introduce the concept of sustain-ability was a report entitled “World Conservation Strategy,” which was pub-lished in 1980 by the IUCN, UNEP, and WWF (IUCN, 1980). In this report, sustainable development was defined as a development process that does not restrict posterity’s right to access resources. The concept was popu-larized by the well-known “Our Common Future” report, also known as the Brundtland Report, published by WCED (1987).
Sustainability entails sustained resources. Human activities mainly de-pend on three types of capital: physical, human, and natural resources. As the literature has grown, the notion of sustainability has been redefined into two categories: “strong” and “weak” sustainability. Weak sustainability asserts
that the three main forms of capital are perfect substitutes for one another. According to this view, a country that achieves economic growth through exporting coal or other nonrenewable natural resources (which will de-plete) cannot be claimed to be on an unsustainable path. If the country in question has used the revenue it generated from the sale of its irreplaceable natural resources to increase its physical or human capital, this means that its capital has increased in one form while decreasing in another, thus leaving the total capital stock intact. One key factor that leads to weak sustainabil-ity is technological advances and innovations; for instance, recycling tech-nologies or products (i.e., synthetic fiber) allow the same levels of demand to be met using fewer natural resources. Conversely, the notion of strong sustainability dismisses most of these assumptions, particularly the “perfect substitution” assumption. According to this concept, a positive change in one type of capital cannot be substituted for a negative change in another. For example, when a decrease in oil stocks occurs due to overconsumption, transference of oil revenue into education, physical capital (i.e., machinery and equipment), or natural capital (i.e., creating new forests) does not mean that the level of total capital stock is kept constant. One problem of weak sustainability is that while the precise monetary value of physical capital can be measured, it is impossible to properly convert human and natural capi-tal into monetary terms. The weak sustainability approach merely regards forests as sources of fuel and raw materials for various industries. The only fully-measurable element here is the economic value of wood, which can be traded on the market. From an ecological perspective, forests are entities that do not only provide wood, but they provide various services to dif-ferent species and play a part in significant cycles (i.e., water and nitrogen cycles). Although it is possible to quantify the ecosystem services that forests provide using certain valuation methods, these estimates will prove to be deficient since they exclude services that have not yet been specified in a scientific manner. Therefore according to the principle of strong sustainabil-ity, natural resources cannot be perfectly substituted for physical capital. The conservation and enhancement of natural resources are necessary processes for the perpetuation of human beings, and therefore also constitute the main conditions for the sustainability of economic activities. Deficiencies in identifying ecosystem services have brought forth a principle called the “precautionary principle.” Adopted by the strong sustainability approach, this principle states that if the possible future effects of an activity (e.g., producing food and feed products from genetically modified organisms) cannot be fully identified, this activity should not be undertaken.
Economic growth is generated by the integration of three main types of capital (physical, natural, and human) using technology. Sustainability of economic growth implies that the growth path should not diminish the amount of these three forms of capital. Environmental sustainability means that the pressure and destruction inflicted by economic growth on nature (which is measurable by the ecological footprint) should be equal to or less than nature’s regeneration capacity (biocapacity). This can be achieved in two ways: (1) by transforming production and consumption patterns using various incentives and regulations, or (2) by substituting artificial products for natural ones through technology and innovation, or benefiting to a greater extent from existing natural resources by enhancing the efficiency. Both of these sustainability measures depend on human and physical capital stock, as well as on institutional structure. In other words, an economic growth path under a certain institutional and political frame may increase the pressure on nature, while the same growth path under a different frame may alleviate such pressure. Although the attributes of the growth path depend heavily on structural and geographical factors as comparative advantages (i.e., being rich in natural resources and having suitable soil and climate conditions), it cannot be claimed that the adopted policies and institutional factors do not matter. For this reason, comparative advantages are observed as dynamic processes, contrary to their static depiction on theoretical grounds.
The pressure on nature takes many forms including the depletion of renewable (i.e., fish stocks) or nonrenewable (i.e., oil) resources, increased levels of solid wastes, increased GHG emissions leading to climate change, loss of ecosystem services, and the deterioration of land use. The first sub-stantial impact of human activity on nature took place with the transition to settled agriculture, and the second boom resulted from the Industrial Revolution (WorldWatch Institute, 2015). However, the question of the economic growth impact on nature (environmental quality) has only oc-cupied economists’ agendas since the end of the 1960s. The relationship between growth and the environment has been investigated in many dif-ferent schools over the years. One group that studies mainstream “environ-mental economics” argued that the negative effects of growth on nature stemmed from lack of markets, and suggested that nature be made subject to market mechanisms just like manufactured goods. The mainstream “in-terventionist” school claimed that a social optimum should be reached by means of taxation and regulation, basing their arguments on the assumption that negative effects (negative externalities) are indicators of market failure. Conversely, “political ecology,” an approach that is outside the mainstream,
renounces the view that nature is a natural resource reserve and asserts that confining the issue to lack of markets, the existence of market distortions, or failure may obscure the power relationships among actors. According to this standpoint, nature has inherent rights and it is not adequate to commodify it or subject it to the same procedures as other human-made raw materials, intermediate goods, or products.
The roles attributed to economic growth in mainstream economic thoughts are not confined to the economic sphere; for example, it is widely anticipated that economic growth will bring about solutions to social and ecological problems as well. In the literature regarding the impact of growth on the environment (environmental quality), one of the most prevalent hypotheses states that environmental pollution increases with economic growth at low-income levels. Thus pollution is expected to diminish when a certain income level is reached. This indicates the presence of an inverted U-shaped relationship between income and environmental pollution, and the resultant curve is called the environmental Kuznets curve (EKC). This hypothesis rests on the application, in the realm of environment, of the re-lationship between income distribution inequality and per capita income, identified by Kuznets in the 1950s. A standard EKC analysis estimates the impact of a selected per capita income indicator (and its square) on a se-lected environmental pollution indicator (e.g., GHG emissions) using a regression equation. The EKC hypothesis claims that growth will have a negative impact on environmental quality until a per capita income thresh-old is reached; however, further income growth will improve environmen-tal quality thereafter. This relationship materializes through three channels: scale, composition, and technology. A rise in per capita national income will lead to a corresponding growth in the population and consumption. When the scale increases, the pressure on nature will follow suit. However, these factors will also cause the income threshold to be exceeded after a while, after which access to cleaner technologies will become easier and this technological transformation will alleviate the pressure on nature. Conse-quently, when income growth exceeds a certain threshold, production will shift toward cleaner sectors as societal environmental awareness improves. This denotes the composition channel, which functions to relieve the pres-sure on nature. The implications of these theoretical anticipations is that low- and middle-income countries could continue to grow without having to take into account the degradation of nature, as environmental quality will automatically increase after a certain income level is reached. However, the crucial point is the determination of this threshold. Furthermore, actual