Novel signal processing techniques for remote sensing applications
Tam metin
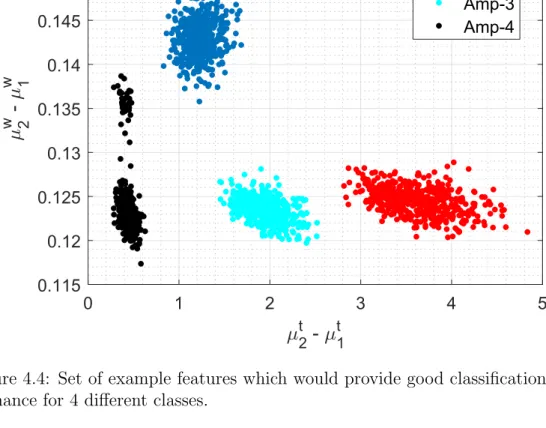
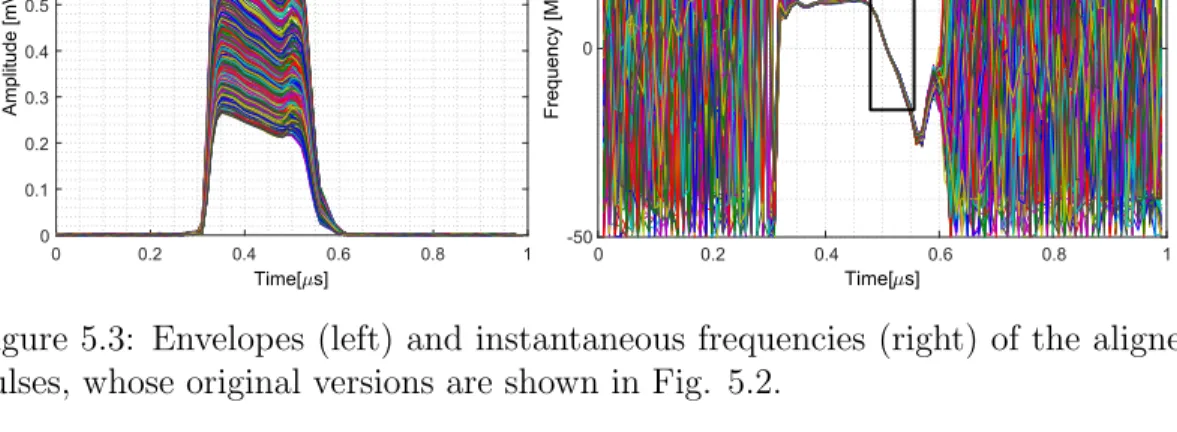
Şekil


Benzer Belgeler
Instead, in accor- dance with our goal of bringing widely used computer graphics methods to optical field and hologram computa- tion, we adopt a diffraction model as given by
Anneler ile yapılan bu çalışmanın genelinde; çocuğun bakımı, annenin çalışma durumu, annelik algıları, annelik deneyimindeki güçlü ve zayıf yönler, anne- baba
10 In particular, Iran, which has the longest common border with Central Asia, as well as fervently active foreign policies, heightened Turkish concerns (and those of the
Overall, in this chapter, we introduce an online sequential prediction algorithm that i) process only the currently available data without any storage, ii) efficiently implements
Taksim Talimhane Receppaşa Cad. Sanatlar Okulu
(7,8) Bu işlemde kompansatuar hiperhidrozis riski daha düşük olmakla birlikte daha kompleks bir yöntem olup, operasyon süresi daha uzun ve rekürrens ihtimali daha yüksek olduğu
Endoskopik torakal diskektomi toraks kavitesinde spinal kanalı önden çok rahat bir görme açısı sağladığı için, orta hatta kalsifiye disklerde dahil olmak üzere tüm
O T U Z ÎK Î yıl içinde dilim izde tiyatro tekniğinin değişik bö lümleri ile ilgili yedi kitap çıkm ıştır; bunlardan bir maki- yaj, ikisi diksiyon
