PHOTOCATALYTIC NOX OXIDATION AND STORAGE UNDER AMBIENT CONDITIONS FOR AIR PURIFICATION
A THESIS
SUBMITTED TO THE DEPARTMENT OF CHEMISTRY
AND THE GRADUATE SCHOOL OF ENGINEERING AND SCIENCE OF BİLKENT UNIVERSITY
IN PARTIAL FULFILLMENT OF THE REQUIREMENTS FOR THE DEGREE OF
MASTER OF SCIENCE
By
ASLI MELİKE SOYLU July 2012
To My Family
and Deniz
i
I certify that I have read this thesis and that in my opinion is it is fully adequate, in scope and quality, as a thesis of the degree of Master in Science
………..
Asst. Prof. Dr. Emrah Özensoy (Supervisor)
I certify that I have read this thesis and that in my opinion is it is fully adequate, in scope and quality, as a thesis of the degree of Master in Science
………..
Prof. Dr. Deniz Üner
I certify that I have read this thesis and that in my opinion is it is fully adequate, in scope and quality, as a thesis of the degree of Master in Science
………..
ii
Approved for the Graduate School of Engineering and Science
………..
Prof. Dr. Levent Onural
Director of the Graduate School of Engineering and Science
iii
ABSTRACT
PHOTOCATALYTIC NOX OXIDATION AND STORAGE UNDER AMBIENT CONDITIONS FOR AIR PURIFICATION
ASLI MELİKE SOYLU M.S. in Chemistry
Supervisor: Asst. Prof. Dr. Emrah Özensoy July, 2012
Air pollution is one of the most serious environmental problems in both urban and rural settings with a direct impact on human health. A variety of chemical compounds can be associated with air pollution and gaseous nitrogen oxides (NOx),
such as NO and NO2, are especially among the most hazardous environmental
pollutants. NOx abatement can be efficiently performed at elevated temperatures (i.e.
T > 300oC), however, an important challenge in air purification is the abatement of gaseous NOx species under ambient conditions (i.e. at room temperature and under
regular atmospheric conditions). Photocatalytic systems offer promising opportunities in order to tackle this important environmental challenge, as these systems can be tailored to efficiently clean/purify air under ambient conditions with the help of ultraviolet (UV) and/or visible (VIS) light.
In the current work, a hybrid technology for the photocatalytic oxidation and storage of gas phase NOx species is proposed where titania based powders are
investigated as candidate photocatalytic materials. With this aim, various components of a thermally activated conventional NOx Storage/Reduction (NSR)
catalyst is combined with a photocatalytically activated NOx oxidation catalyst to
obtain a photocatalytically activated NOx oxidation and storage material. In this
iv
The first set of photocatalysts was prepared by employing Al2O3, a high
surface area support material, in order to disperse the photocatalytically active titania in an effective manner. Using a ―sol-gel co-precipitation method‖, TiO2/Al2O3 binary
oxides were synthesized (where TiO2:Al2O3 mole ratio was chosen to be 0.25, 0.5,
1.0) and characterized by X-ray diffraction, Raman Spectroscopy and BET. For these samples, the effects of specific surface area, calcination temperature and the crystallinity of TiO2 were investigated in relevance to the photocatalytic NOx
oxidation/storage reaction.
Next, an alkali/alkaline earth oxide storage component is added to the TiO2
-Al2O3 mixture and the incorporation of the storage component is achieved via two
different routes; (i) either through ―incipient wetness impregnation‖ of 5 or 10% (w/w) metal nitrate [M(NO3)x] salts on TiO2-Al2O3 and a subsequent calcination to
obtain alkali/alkaline earth oxides [MyO] or (ii) by physically grinding 5 or 10%
(w/w) BaO powder with TiO2-Al2O3 binary oxide to obtain a ternary mixture. For
these samples, the route of metal oxide incorporation (impregnation vs. physical mixture), the type of metal oxide storage component (alkali vs. alkaline earth metal) and the percentage of metal oxide loading (5% vs. 10%, w/w) were examined in photocatlytic NOx oxidation/storage reaction.
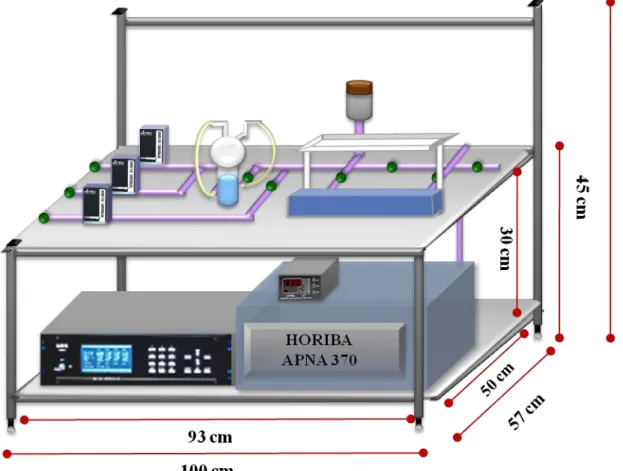
The photonic efficiencies of these samples were tested using a continuous flow system, composed of mass flow controllers, a custom-made UVA-illuminated reaction cell and an ambient chemiluminescence NOx analyzer. Photocatalytic
performance of all samples were compared with that of a commercially available Degussa P25 TiO2 benchmark catalyst. Photocatalytic preformance tests revealed
that the TiO2-Al2O3 binary oxides had much higher NOx storage capacities compared
to Degussa P25 and the further addition of an alkaline earth oxide (BaO) storage component on TiO2-Al2O3 by physical mixing significantly enhanced the NOx
capture in solid state and decreased unwanted gaseous NO2 emission to an almost
negligible level. On the other hand, the ―incipient wetness impregantion‖ of metal nitrates resulted in metal titanate (MxTiyOz) formation on TiO2-Al2O3 binary oxide
and diminished the photooxidation ability of the catalyst.
Keywords: Air Purification, Photocatalytic NOx Oxidation and Storage, TiO2,
v ÖZET
FOTOKATALİTİK YÖNTEMLERLE ODA KOŞULLARINDA HAVA ARITIMINA YÖNELİK NOX YÜKSELTGENMESİ VE DEPOLANMASI
ASLI MELİKE SOYLU Kimya Yüksek Lisans Tezi Danışman: Y. Doç. Dr. Emrah Özensoy
Temmuz, 2012
Hava kirliliği, insan sağlığına doğrudan etkisi bulunan en önemli çevre sorunlardan biridir ve hava kirliliğine katkıda bulunan zehirli gaz türlerinin başında NO ve NO2 gibi azot oksitler (NOx) gelir. Yüksek sıcaklıklarda (T > 300oC)
ısıl-katalitik yöntemler kullanarak NOx türlerini zararsız kimyasallara başarıyla
dönüştürmek mümkündür, ancak aşılması gereken en önemli engellerden biri, NOx
türü gazları oda koşulları (düşük sıcaklık ve basınç şartları) altında zararsız gazlara dönüştürmektir. Bu bağlamda, fotokatalitik süreçler oldukça umut verici bir alternatif olarak karşımıza çıkmaktadır; çünkü fotokatalitik malzemeler, doğru şekilde türevlendirilip, zenginleştirildiklerinde, mor otesi (UV) ve hatta görünür ışık yardımıyla NOx dönüşümlerine imkan tanımaktadırlar.
Bu çalışmamızda, gaz fazı NOx türlerini fotokatalitik olarak yükseltgeyip
depolayacak hibrid bir sistem önerilmiş olup, TiO2 bazlı nanoparçacıklar
fotokatalitik malzeme adayları olarak incelenmiştir. Bu amaçla, ısıl olarak aktive edilen NOx depolama/indirgeme (NSR) sisteminin depolama bileşenleri, fotokatalitik
olarak aktive edilen NOx yükseltgeme katalizörü olan TiO2 ile biraraya getirilmiş ve
fotokatalitik olarak etkinlik gösteren NOx yükseltgeme/depolama malzemeleri elde
vi
İlk grup numuneler, aktif katalizör olan titanyanın yüksek yüzey alanlı bir alttaş (destek) malzemesi (Al2O3) üzerine yayılması yolu ile hazırlanmıştır. ―Sol-jel
birlikte çöktürme metodu‖ ile 0.25, 0.5 ve 1.0 TiO2:Al2O3 mol oranına sahip olacak
şekilde TiO2-Al2O3 karışık oksitleri sentezlenmiş, ardından bu numuneler X-ışını
kırınımı, Raman spektroskopisi ve BET metodlarıyla karakterize edilmiştir. Bu numunelerin yüzey alanı, kalsinasyon sıcaklığı ve içerdikleri TiO2 kristal yapısı gibi
özelliklerinin NOx yükseltgeme/depolama tepkimesi üzerindeki etkileri incelenmiştir.
Bir sonraki aşamada alkali/toprak alkali oksit NOx depolama bileşenleri
TiO2-Al2O3 karışık oksitine eklenmiş ve bu katkılandırma iki farklı şekilde
yapılmıştır. İlk yöntemde, TiO2-Al2O3 üzerine ―ıslak emdirme‖ metodu ile kütlece
%5 veya 10 metal nitrat tuzları eklenmiş ve oluşan malzemenin kalsine edilmesiyle alkali/toprak alkali metal oksit oluşumu hedeflenmiştir. Diğer yöntemde ise TiO2
-Al2O3 karışık oksiti, kütlece %5 veya 10 BaO kristali ile beraber fiziksel olarak
ezilerek toz kaline getirilmiş ve üçlü bir karışım elde edilmiştir. Bu numunelerde, NOx depolama bileşeninin katkılandırılma metodu (ıslak emdirme ya da fiziksel
karışım), eklenen metal oksit çeşitleri ve metal oksit yükleme yüzdesinin (kütlece %5 veya %10) NOx yükseltgeme/depolama tepkimesi üzerindeki etkileri incelenmiştir.
Bahsedilen numunelerin fotokatalitik etkinliği ve verimi, kurduğumuz sürekli akış sistemi ile test edilmiştir. Bu sistem, kütle akış kontrolörleri, özel tasarım UVA-aydınlatmalı fotokatalitik reaksiyon hücresi ve oda koşulu kimyasal ışıldama NOx
analizöründen oluşmaktadır. Degussa P25 tüm testlerde referans malzeme olarak kullanılmıştır. Fotokatalitik performans deneyleri sonucunda TiO2-Al2O3 karışık
oksitlerinin NOx depolama verimlerinin Degussa P25’e kıyasla çok daha yüksek
olduğu görülmüş; bu ikili oksitlere fiziksel karışım metoduyla BaO depolama bileşeni eklenmesinin ise katı fazda NOx depolanmasını kat kat arttırdığı ve gaz
fazda NO2 salınımını yok denecek seviyede tuttuğu anlaşılmıştır. Buna karşılık,
―ıslak emdirme‖ yönteminin TiO2-Al2O3 karışık oksidi üzerinde metal titanat
(MxTiyOz) türleri oluşumuna yol açtığı ve bu durumun da katalizörün
foto-yükseltgeme yeteneğini oldukça azalttığı gözlemlenmiştir.
Anahtar Kelimeler: Hava arıtımı, Fotokatalitik NOx Yükseltgenmesi/Depolanması,
vii
ACKNOWLEDGEMENT
First of all, I would like to express my deepest graditude to my supervisor, Asst. Prof. Emrah Özensoy, who gave me the opportunity to work with him in the field of environmental remediation. This thesis could not have been written without his patient guidance, encouragement and understanding.
I would like to offer my special thanks to Prof. Ömer Dağ and Prof. Deniz Üner for fruitful discussions on this research work, and I am also thankful to Asst. Prof. Özgür Birer for his help on the Diffuse Reflactance UV-VIS measurements.
Special thanks should also be given to our collaborators from Greece, Prof. Christos Trapalis and Dr. Tatiana Giannokopoulou for their valuable guidance in this project, and I greatly appreciated their warm hospitability throughout my visit to N.C.S.R. Demokritos, Athens.
I would like to extend my heartfelt gratitude to our technician Ethem Anber for his help during the construction of the photoctalytic flow reactor system in our laboratory.
I owe sincere and earnest thankfulness to Evgeny Vovk, Zafer Say and Merve Doğaç for their partnership and help during this research and I would also like to thank Seda Şentürk, Emre Emmez, Emrah Parmak and all of the members of our research group for their kind help and friendship.
I would like to thank all past and present members of Chemistry Department where I have learned a lot in the last 7 years. My special thanks go to Övgü Yılmaz and Zeynep Ayça Bölükoğlu who have been a source of continuous joy and motivation throughout this period.
I also wish to acknowledge the financial support provided by the Scientific and Technical Research Council of Turkey (TUBITAK) (Project Code: 109M713).
viii
Last but not the least, I am truly indebted to my parents, my brother, and to Cemal Albayrak for their endless love and encouragement. Words alone cannot describe how grateful I am to have such a caring family... I would be lost without them in this important time of my life and I am eternally grateful for their continuous support.
Finally, this acknowledgement would not have been complete without mentioning Deniz Aksoy, who had always challenged and inspired me to learn more and reach for more than I have ever felt capable of achieving. He was always there for me through good and bad, he never hesitated to lend a hand whenever needed and always cheered me up with his upbeat attitude... Now, all that I can do is to wish that he were here and we could be together once more, but in the end, I know that
the ones that love us never truly leave us.
This thesis is dedicated to the loving memory of Deniz…
ix
TABLE OF CONTENTS
1. INTRODUCTION ... 1
1.1 OVERVIEW ... 1
1.1.1 Effects of Indoor NOx Pollution on Human Health... 4
1.1.2 Catalytic Control of NOx Pollution ... 6
1.2 PHYSICAL PROPERTIES OF TITANIA ... 12
1.2.1 The Crystal Structure of Titania ... 14
1.2.2 Anatase to Rutile Phase Transformation ... 15
1.2.3 Electronic Band Structure of Titania ... 18
1.3 PHOTOCATALYSIS ON TIO2-BASED MATERIALS ... 20
1.3.1 Photocatalytic Oxidation (PCO) on TiO2-based materials ... 24
1.3.1.1 Operational parameters in Photocatalytic Oxidation Experiments 27 1.3.1.2 Photocatalytic Oxidation (PCO) of NO on TiO2-based materials . 29 1.3.1.3 Applications of Photocatalytic NO Oxidation on TiO2-based materials 33 1.4 AIM OF THE STUDY ... 35
2. EXPERIMENTAL ... 37
2.1 .SAMPLE PREPARATION ... 37
2.1.1 PREPARATION OF SOL-GEL TIO2 ... 37
2.1.2 Preparation of TiO2/Al2O3 binary oxides ... 38
2.1.3 Preparation of MxO/TiO2/Al2O3 Mixed Oxides via Impregnation ... 40
2.1.4 Preparation of MxO/TiO2/Al2O3 Mixed Oxides as a Physical Mixture (with Sol-Gel TiAl) ... 42
2.1.5 Preparation of TiO2/γ-Al2O3 Mixed Oxide as a Physical Mixture (with Degussa P25) ... 43
2.1.6 Preparation of MxO/TiO2/γ-Al2O3 Mixed Oxide as a Physical Mixture (with Degussa P25) ... 43
2.2 EXPERIMENTAL SET-UP ... 44
2.2.1 Photocatalytic Flow Reactor set-up ... 44
2.2.1.1 Gas Manifold System ... 46
2.2.1.2 Photocatalytic Flow Reactor ... 48
x
2.1.1.4 Chemiluminescent Ambient NOx Analyzer ... 54
2.3 EXPERIMENTAL PROTOCOLS ... 57
2.3.1 Photocatalytic NOx Oxidation/Storage under UVA Exposure ... 57
2.3.2 XRD & BET ... 62
2.3.3 Raman Spectroscopy ... 63
3. RESULTS AND DISCUSSION ... 64
3.1 PURE TIO2 AND TIO2/AL2O3BINARY OXIDES ... 64
3.1.1 Structural Characterization of the Thermally Treated Pure TiO2 and TiO2/Al2O3 Binary oxides ... 64
3.1.1.1 XRD Experiments ... 64
3.1.1.2 Raman Analysis ... 69
3.1.1.3 BET Analysis ... 72
3.1.2 Photocatalytic Performance Experiments ... 73
3.2 MXO/TIO2/AL2O3TERNARY OXIDES PREPARED VIA IMPREGNATION ... 82
3.2.1 Structural Characterization of the MxO/TiO2/Al2O3 Ternary oxides ... 82
3.2.1.1 XRD Analysis ... 82
3.2.1.2 Raman Experiments ... 88
3.2.2 Photocatalytic Performance Experiments ... 92
3.3 MXO/TIO2/AL2O3TERNARY OXIDES PREPARED VIA PHYSICAL MIXING ... 101
3.3.1 Photocatalytic Performance Experiments ... 101
3.4 PHOTONIC EFFICIENCIES OF THE PHONOS CATALYSTS IN COMPARISON TO LITERATURE DATA ... 106
4. CONCLUSIONS ... 110
5. REFERENCES ... 113
6. APPENDIX ... 124
6.1 PRETREATMENT OF THE SAMPLES:THE EFFECT OF ACTIVATION TIME ... 124
6.2 REGENERATION OF THE PHONOS CATALYSTS ... 125
6.3 PHOTONIC EFFICIENCIES OF PHONOS CATALYSTS ... 128
6.4 UV-VIS ABSORPTION SPECTRA (DIFFUSE REFLECTANCE) AND BAND GAP MEASUREMENTS OF SELECTED PHONOS CATALYSTS... 136
xi
LIST OF FIGURES
Figure 1. The ozone layer within stratosphere [7]. ... 2 Figure 2. Size comparison for particulate matter pollutants [5]. ... 5 Figure 3. Illustration of the general operational principle of NSR catalyst during (a) lean cycle, (b) rich cycle. ... 10 Figure 4. (a) Bulk Gibbs free energy of formation vs. temperature and (b) bulk Gibbs free energy of formation vs. pressure for anatase for anatase and rutile phases. [26] ... 13 Figure 5. Three-dimensional representation of the octahedral arrengement in anatase and rutile phases of titania [26]. ... 15 Figure 6. Plot of cationic dopant types, on account of their ionic radii and valence, categorized by their anatase-to-rutile transition inhibitive or promoting effect [26]. 18 Figure 7. (a) Total and projected densities of states (DOS) of the anatase TiO2
structure (b) Molecular-orbital bonding structure for anatase TiO2 [43] ... 19
Figure 8. Electronic density of states for bulk rutile (upper panel) and anatase (lower panel) phases. The valence band maximum is taken as the zero of energy [45] ... 20 Figure 9. Schematic view of the photoexcitation and the following deexcitation events [46]. ... 21 Figure 10. The potentials for various redox processes occurring on the TiO2 surface
at pH 7 [68]. ... 25 Figure 11. A possible mechanism of NO adsorption on TiO2 [78]. ... 31
Figure 12. A possible mechanism of photocatalytic NO oxidation on TiO2 [78]. .... 32
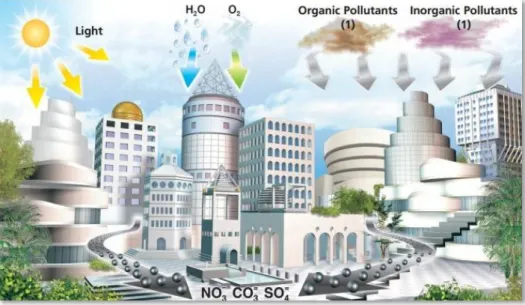
Figure 13. Representative drawing of photocatalytic air purification in urban areas, where (1) shows CO, VOC (Benzene, Toluene, etc.), Methyl Mercaptan(g), Organic chlorinated compounds, Polycondensed aromatic compounds, Acetaldehyde, Formaldehyde and (2) shows NOx, SOx, NH3(g) [87]. ... 33
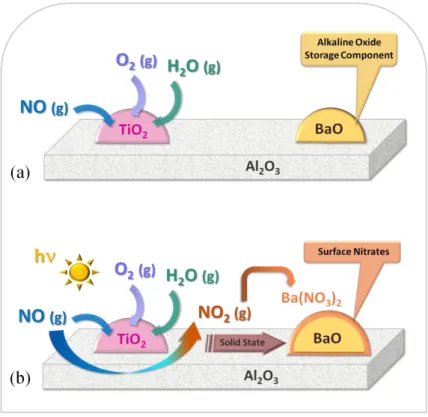
Figure 14. Schematic depiction of the photocatalytic NOx oxidation and storage
(PhoNOS) catalyst and the PhoNOS process. ... 35 Figure 15. Schematic depiction of catalyst regeneration with water ... 36 Figure 16. Components of the Photocatalytic Flow Reactor system, assembled and placed inside the fumehood. ... 44 Figure 17. Simplified schematic of the Photocatalytic Flow Reactor system and dimensions of the aluminum profile. ... 45
xii
Figure 18. Schematic representation of the gas manifold system (topview). ... 46
Figure 19. Gas humidifier bottle, filled with deionized water. ... 47
Figure 20. Photocatalytic flow reactor and the UV-lamp that irradiates the reaction chamber. ... 48
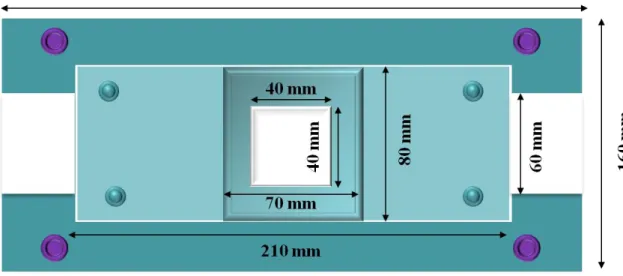
Figure 21. Custom designed photocatalytic flow reactor assembly. ... 50
Figure 22. Dimensions of the sample holder for powder photocatalysts. ... 50
Figure 23. Topview dimensions of the reaction chamber. ... 51
Figure 24. Lateral dimensions of the photocatalytic flow reactor. Brown circles show the positioning of viton O-rings. ... 51
Figure 25. Closed view of the photocatalytic flow reactor and pathway of the flow inside the reactor. ... 52
Figure 26. 8W UVA lamp (Sylvania). ... 52
Figure 27. Photoradiometer for irradiance measurements and its UVA probe (DeltaOhm). ... 53
Figure 28. Response curve for LP471 UVA probe. ... 53
Figure 29. APNA 370 Chemiluminescent Ambient NOx Analyzer (HORIBA) ... 54
Figure 30. Schematic drawing of the Ozonizer unit inside the Chemiluminescent NOx Analyzer [93]. ... 55
Figure 31. Schematic drawing of the Reaction Chamber inside the Chemiluminescent NOx Analyzer [93]. ... 56
Figure 32. Gas flow at the beginning of the initial Dark by-pass period. The blue line represents N2(g), purple line represents O2(g) and pink line is their mixture. ... 58
Figure 33. Gas flow after the opening of NO/N2 valve during the initial Dark by-pass period. The pink line represents N2+O2, green line represents NO(g) and multicolored line is the N2+O2 +NO mixture. ... 58
Figure 34. Gas flow during the dark adsorption, UV-On (Photocatalytically active period) and UV-Off (Dark purging) periods. The pink line represents N2 + O2 mixture, the green line represents NO and the multicolored line is the NO+ N2 + O2 mixture. ... 59
Figure 35. Complete photocatalytic analysis curve at the end of the experiment. .... 60
Figure 36. Schematic depiction the integrated areas for the total NOx (blue area) and NO (blue+black areas) abatement and NO2 (red area) production. ... 61
xiii
Figure 38. XRD patterns of pure TiO2 before and after calcination in air between
(a)150 to 500oC and (b) 600 to 1000oC. ... 66 Figure 39. XRD patterns of the Ti/Al samples before and after calcination in the temperature range of 150-1000oC. (a) Ti:Al mol ratio = 0.25, (b) Ti:Al mol ratio = 0.50 and (c) Ti:Al mol ratio = 1.0. ... 67 Figure 40. Raman spectra of Degussa P25, pure anatase and pure rutile... 69 Figure 41. Raman spectra of pure TiO2 and the Ti/Al samples before and after
calcination in the temperature range of 150-1000oC. (a) Pure TiO2 (b) Ti:Al mol ratio
is 0.25, (c) Ti:Al mol ratio is 0.50 (d) Ti:Al mol ratio is 1.0. ... 71 Figure 42. Performance plots of (a) pure γ-Al2O3 and (b) pure γ-Al2O3 +10% (w/w)
BaO mixture. (c) The photonic efficiencies of the samples (a) and (b) in total NOx
abatement and NO2(g) production. ... 74
Figure 43. (a) Performance plot of Degussa P25 TiO2 (b) The photonic efficiencies
of pure γ-Al2O3 , γ-Al2O3 +10% (w/w) BaO mixture and Degussa P25 TiO2 in total
NOx abatement and NO2(g) production. ... 75
Figure 44. Performance plot s of 0.25 Ti/Al binary oxide samples:(a) uncalcined, calcined for 2h in air at (b)800oC, (c) 900oC, (d) 950oC, (e) 1000 oC. ... 77 Figure 45. Performance plots of 0.5 Ti/Al binary oxide: (a) uncalcined and calcined for 2h in air at (b)150oC, (c) 350oC, (d) 600oC, (e)800oC, (f) 900oC, (g) 1000oC. .... 79 Figure 46. Performance plots of 1.0 Ti/Al binary oxide: (a) uncalcined and calcined for 2h in air at (b)150oC, (c) 350oC, (d) 600oC, (e)800oC, (f) 900oC (g) 1000oC. ... 80 Figure 47. The photonic efficiencies of thermally treated 0.25 Ti/Al, 0.5 Ti/Al and 1.0 Ti/Al series for total NOx abatement and NO2(g) production, in comparison with
Degussa P25 TiO2. ... 81
Figure 48. XRD patterns of 0.5 Ti/Al-900 sample that was impregnated with 5 and 10% (w/w) Ba(NO3)2 and calcined for 4 h at 700oC under Ar(g) atmosphere. ... 83
Figure 49. XRD patterns of (a) 1.0 Ti/Al-800 (b) 1.0 Ti/Al-900 samples that were impregnated with 5 and 10% (w/w) LiNO3 and calcined for 4 h at 700oC under Ar(g)
atmosphere. ... 84 Figure 50. XRD patterns of (a) 1.0 Ti/Al-800 (b) 1.0 Ti/Al-900 samples that were impregnated with 5 and 10% (w/w) NaNO3 and calcined for 4 h at 700oC under
xiv
Figure 51. XRD patterns of (a) 1.0 Ti/Al-800 (b) 1.0 Ti/Al-900 samples that were impregnated with 5 and 10% (w/w) KNO3 and calcined for 4 h at 700oC under Ar(g)
atmosphere. ... 85 Figure 52. XRD patterns of (a) 1.0 Ti/Al-800 (b) 1.0 Ti/Al-900 samples that were impregnated with 5 and 10% (w/w) CsNO3 and calcined for 4 h at 700oC under Ar(g)
atmosphere. ... 85 Figure 53. XRD patterns of (a) 1.0 Ti/Al-800 (b) 1.0 Ti/Al-900 samples that were impregnated with 5 and 10% (w/w) Ca(NO3)2 and calcined for 4 h at 700oC under
Ar(g) atmosphere. ... 87 Figure 54. XRD patterns of (a) 1.0 Ti/Al-800 (b) 1.0 Ti/Al-900 samples that were impregnated with 5 and 10% (w/w) Sr(NO3)2 and calcined for 4 h at 700oC under
Ar(g) atmosphere. ... 87 Figure 55. XRD patterns of (a) 1.0 Ti/Al-800 (b) 1.0 Ti/Al-900 samples that were impregnated with 5 and 10% (w/w) Ba(NO3)2 and calcined for 4 h at 700oC under
Ar(g) atmosphere. ... 88 Figure 56. Raman spectra of the reference pure nitrate salts; LiNO3, NaNO3, KNO3,
CsNO3, Ca(NO3) 2, Sr(NO3)2, Ba(NO3)2. ... 89
Figure 57. Raman spectra corresponding to the 1.0 Ti/Al samples that were impregnated with 5 and 10% (w/w) Ba(NO3)2 and calcined for 4 h at 700oC under
Ar(g) atmosphere. ... 89 Figure 58. Raman spectra corresponding to the 1.0 Ti/Al samples that were impregnated with 5 and 10% (w/w) M(NO3)x and calcined for 4 h at 700oC under
Ar(g) atmosphere; (a) 1.0 800+5%M (b) 1.0 800+10%M (c) 1.0 Ti/Al-900+5%M (d) 1.0 Ti/Al-900+10%M ... 91 Figure 59. Performance plots of 0.5 Ti/Al-900 binary oxides that have been impregnated with (a) 5% (w/w) Ba(NO3)2, (b) 10 % (w/w) Ba(NO3)2 and calcined
for 4 h at 700oC under Ar(g) atmosphere. (c) The photonic efficiencies for total NOx
abatement and NO2(g) production in 1.0 Ti/Al-900 binary oxides that have been
impregnated with 5 and 10% (w/w) Ba(NO3)2. The graph also presents the
efficiencies of non-impregnated 0.5 Ti/Al-900 and Degussa for comparison. ... 93 Figure 60. Performance plots of 1.0 Ti/Al-800 binary oxides that were impregnated with 5% (w/w) M(NO3)x and calcined for 4 h at 700oC under Ar(g) atmosphere; (a)
LiNO3, (b) NaNO3, (c) KNO3, (d) CsNO3, (e) Ca(NO3)2, (f) Sr(NO3)2, (g) Ba(NO3)2.
xv
Figure 61. Performance plots of 1.0 Ti/Al-800 binary oxides that were impregnated with 10% (w/w) M(NO3)x and calcined for 4 h at 700oC under Ar(g) atmosphere; (a)
LiNO3, (b) NaNO3, (c) KNO3, (d) CsNO3, (e) Ca(NO3)2, (f) Sr(NO3)2, (g) Ba(NO3)2.
... 96 Figure 62. Performance plots of 1.0 Ti/Al-900 binary oxides that were impregnated with 5% (w/w) M(NO3)x and calcined for 4 h at 700oC under Ar(g) atmosphere; (a)
LiNO3, (b) NaNO3, (c) KNO3, (d) CsNO3, (e) Ca(NO3)2, (f) Sr(NO3)2, (g) Ba(NO3)2.
... 97 Figure 63. Performance plots of 1.0 Ti/Al-900 binary oxides that were impregnated with 5% (w/w) M(NO3)x and calcined for 4 h at 700oC under Ar(g) atmosphere; (a)
LiNO3, (b) NaNO3, (c) KNO3, (d) CsNO3, (e) Ca(NO3)2, (f) Sr(NO3)2, (g) Ba(NO3)2.
... 98 Figure 64. The photonic efficiencies for total NOx abatement and NO2(g) production
in 1.0 Ti/Al-800 binary oxides that were impregnated with 5 and 10% (w/w) M(NO3)x and calcined for 4 h at 700oC under Ar(g) atmosphere. The graph also
presents the photonic efficiencies of non-impregnated 1.0 Ti/Al-800 and Degussa P25 for comparison.. ... 98 Figure 65. The photonic efficiencies for total NOx abatement and NO2(g) production
in 1.0 Ti/Al-900 binary oxides that were impregnated with 5 and 10% (w/w) M(NO3)x and calcined for 4 h at 700oC under Ar(g) atmosphere. The graph also
presents the efficiencies of non-impregnated 1.0 Ti/Al-900 and Degussa P25TiO for comparison. ... 100 Figure 66. Performance plots of Ti/Al and BaO physical mixtures in the following compositions (a) 0.5-Ti/Al-900+ 5BaO(PM), (b) Ti/Al-800+ 5BaO(PM), (c) 1.0-Ti/Al-900+ 10BaO(PM) , (d) 1.0-1.0-Ti/Al-900+ 5BaO(PM), (e) 1.05-1.0-Ti/Al-900+ 10% BaO(PM) ... 102 Figure 67. Performance plots of Degussa P25 TiO2, -Al2O3 and BaO physical
mixtures in the following compositions (a) 0.5-P25: -Al2O3 mole ratio, (b) 0.5-P25:
-Al2O3 + 5% (w/w) BaO, (c) 0.5-P25: -Al2O3 + 10% (w/w) BaO ... 103
Figure 68. The photonic efficiencies for total NOx abatement and NO2(g) production
in physically mixed Ti/Al/BaO samples, compared with the efficiencies of Degussa P25, 0.5 Ti/Al-900, 1.0 Ti/Al-800 and 1.0 Ti/Al-900. ... 104 Figure 69. The ratio of NOx abatement (storage) and NO2(g) production photonic
Ti/Al-xvi
900, 1.0 Ti/Al-800 and 1.0 Ti/Al-900. Dark green bars represent Ti/Al (sol-gel) based mixtures and light green bars identify P25-based mixtures. ... 105 Figure 70. Performance plots of 300 mg Degussa P25 that has been pretreated under UV light for (a) 1 day (a) 2 days (a) 3 days (a) 9 days. ... 124 Figure 71. The photonic efficiencies of 300 mg Degussa P25 that has been pretreated under UV light for 1 day, 2 days, 3 days, 9 days. ... 125 Figure 72. Performance plot of regenerated 0.5-Ti/Al-900+5BaO (PM), which was washed in water, filtered and dried at room temperature, after the initital performance experiment. ... 126 Figure 73. Performance plot of fresh 0.5-Ti/Al-900+5BaO (W), which was prepared by mixing 0.5-Ti/Al-900 and 5% (w/w) BaO in 50 ml water. The resulting suspension was stirred for 4 h at 80oC until the water evaporated and the remaining powder was dried at 150oC for 1 h. ... 126 Figure 74. The photonic efficiencies of 0.5 Ti/Al-900+5BaO(PM), 0.5 Ti/Al-900, 0.5 Ti/Al-900+5BaO(PM-R) which was washed (regenerated) with water and 0.5 Ti/Al-900+5BaO(W) which was prepared in water, in comparison to Degussa P25. ... 127 Figure 75. UV-VIS Absorption Spectrum (Diffuse Reflectance) of Degussa P25. ... ………...132 Figure 76. UV-VIS Absorption Spectra (Diffuse Reflectance) of (a) 0.25 Ti/Al-900 (b) 0.25 Ti/Al-1000. ... 132 Figure 77. UV-VIS Absorption Spectra (Diffuse Reflectance) of (a) 0.5 Ti/Al-800 (b) 0.5 Ti/Al-900 (c) 0.5 Ti/Al-900 +10BaO (IM) (d) 0.5 Ti/Al-900+ 10BaO (PM) (e) 0.5 Ti/Al-1000 ... 133 Figure 78. UV-VIS Absorption Spectra (Diffuse Reflectance) of (a) 1.0 Ti/Al-800 (b) 1.0 Ti/Al-900 (c) 1.0 Ti/Al-1000 ... 134 Figure 79. Approximate band gap energies (eV) of the selected PhoNOS catalysts. Blue arrow indicate 0.25 Ti/Al samples, green arrows show 0.5 Ti/Al samples and purple arrows indicate 1.0 Ti/Al samples. ... 135
xvii
LIST OF TABLES
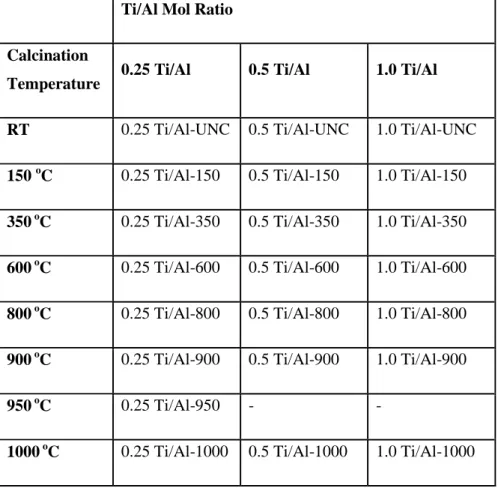
Table 1. Standard regulation of atmospheric pollutants from mobile sources in the European Community (1993-2014) [18] ... 7 Table 2. Air quality index (AQI) for Nitrogen Dioxide [22]. ... 11 Table 3. Properties of the anatase and rutile phases [26]. ... 13 Table 4. Common synthesis methods of titanium dioxide and resultant phases (Amorph: Amorphous, A: Anatase, R: Rutile) [26] ... 16 Table 5. Excitation energy types used in photo-processes [42]. ... 22 Table 6. Bandgap energies (eV) of various semiconductors and their respective colors [42]. ... 23 Table 7. Calcination temperatures of the synthesized TiO2 samples. ... 37
Table 8. Compositions and calcination temperatures of the synthesized TiO2/Al2O3
binary oxides ... 39 Table 9. Compositions and calcination temperatures of the ternary oxide NOx
oxidation/storage materials, prepared from 0.5 TiO2/Al2O3 via impregnation. ... 40
Table 10. Compositions and calcination temperatures of the ternary oxide NOx
oxidation/storage materials, prepared from 1.0 TiO2/Al2O3 via impregnation. ... 41
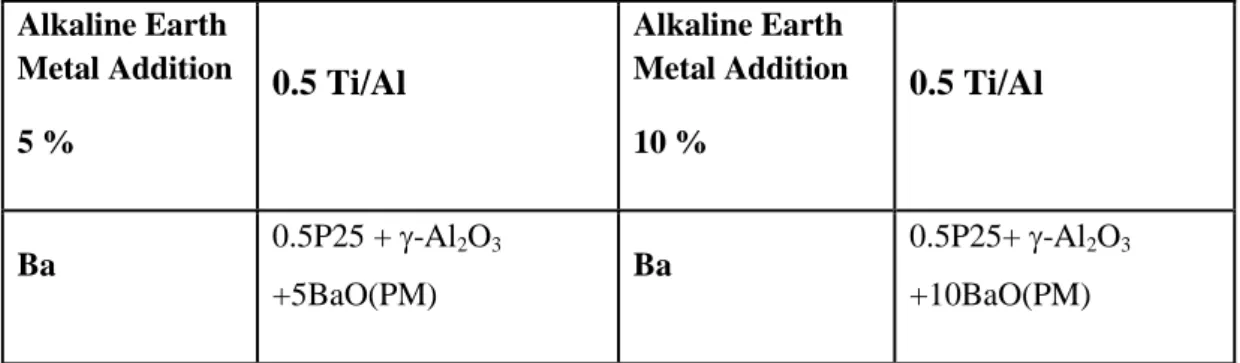
Table 11. Compositions and calcination temperatures of the ternary oxide NOx
oxidation/storage materials, prepared from sol gel TiO2/Al2O3 via physical mixing. 42
Table 12. Compositions of the ternary oxide NOx oxidation/storage materials,
prepared from Degussa P25 via physical mixing. ... 43 Table 13. BET Specific surface areas (in m2/g) of the samples calcined within 150-1000oC. ... 73 Table 14. The photonic efficiency percentages for all tested samples (calculated for the first hour of UVA irradiation). ... 128 Table 15. The number of moles of oxidized NO(g), stored NOx and produced NO2(g)
by all tested samples (calculated for the first hour of UVA irradiation). ... 132 Table 16. Absorption edge wavelengths (nm) and approximate band gap energies (eV) of the selected PhoNOS catalysts. ... 138
1
1. INTRODUCTION
1.1 Overview
Atmospheric pollution is a major problem brought on by industrialization and urbanization, and many forms of air pollution disturb the delicate balance of life on earth. The eventual damage is not just on the environment but also on the human health, which is heavily at risk in polluted areas. The contaminants that generate air pollution are emitted from many diverse sources. While biogenic emissions (such as microbial breakdown of organic materials) and emissions coming from nonliving
natural sources (such as volcanic eruptions) have some impact on the deterioration
of atmospheric contaminant levels, it should be noted that the anthropogenic
emissions that occur as a result of human activity remains as the main source of air
pollution [1].
The contaminants that cause air pollution are basically divided into two subcategories; primary pollutants and secondary pollutants[1]. Primary pollutants are the ones that are directly released into the atmosphere and they can be listed as such:
Sulfur Dioxide (SO2), produced from fossil fuel combustion at power plants
(73%) and other industrial facilities (20%) [2].
Nitrogen Oxides (NOx), produced by emissions from cars, trucks and buses,
power plants, and off-road equipment [3].
Carbon Monoxide (CO), the majority of which comes from mobile sources [4].
Volatile Organic Compounds (VOCs), emitted from a wide range of sources, including fossil fuel combustion, industrial activities, and natural emissions from vegetation and fires [1].
Suspended particulate matter (SPM), a complex mixture of extremely small particles and liquid droplets, produced by organic chemicals, acids (such as nitrates and sulfates), metals, soil or dust particles [5].
Toxic metals (Pb, Cd, Hg etc.), introduced through petrol, paints, batteries, hair dye products etc. [6]
2
In the atmosphere, these primary pollutants may combine to form bigger molecules or they may break down by photolysis / thermal decomposition to produce lighter chemicals. These chemicals are known as secondary pollutants and one of the most destructive products of such reactions is ―ground-level‖ ozone (O3). O3 is
highly oxidative and toxic for both humans and vegetation [1]. It should be stated that although the ozone in the stratosphere has a critical role in protecting life by constituting a UV-shield against the sun (Figure 1 [7]), ground-level ozone is designated as the ―bad‖ ozone since it is a major component of smog, which is harmful to the respiratory system, especially in children [8].
In United States, the Clean Air Act requires Environmental Protection Agency (EPA) to set National Ambient Air Quality Standards for six common air pollutants [9]. These commonly found pollutants (also known as "criteria pollutants") are particle pollution, ground-level ozone, carbon monoxide, sulfur oxides, nitrogen oxides and lead. In Turkey, Ministry of Health is responsible for monitoring air pollution levels. A total of 171 monitoring stations are distributed among 69 city centers and these stations continously measure SO2 and particulate matter (PM)
levels. In particular, Ankara-Sıhhiye station also monitors carbon monoxide (CO) and NOx emissions [10].
3
Listed above among the primary air pollutants, gaseous nitrogen oxides (NOx,
such as NO and NO2) are a group of highly reactive gases. According to the U.S.
Environmental Protection Agency (EPA) Clean Air Act, having high levels of NOx
in the atmosphere leads to some major environmental and health-related problems. Some of these problems can be described as photochemical smog generation and toxic solid particulate formation with sizes less than 2.5 micron. Formation of ground level ozone (a detrimental secondary pollutant) is another consequence of high NOx
levels in the atmosphere, because CO(g) or short-lived VOCs react with NOx and
produce tropospheric ozone in polluted environments [1]:
VOC + OH• → HO2• + other products (1-a)
CO + OH• → HO2• + CO2 (1-b)
HO2• + NO → OH• + NO2 (2)
NO2 + hν (λ < 440 nm) → NO + O• (3)
O• + O2 + M → O3+ M (4)
Along with producing ―bad‖ ozone in troposphere, high concentrations of NOx
derivatives at the upper levels of the atmosphere results in the depletion of ―good‖ ozone in stratosphere, thus impairing the UV-shield of Earth with the following reactions [11]:
NO + O3 → NO2 + O2 (5)
NO2 + O → NO + O2 (6)
O + O3 → 2 O2 (7)
NOx species also contribute to acid rains by reacting with water vapor and some
other air pollutants such as SO2. Last but not the least, having relatively large heat
capacities compared to other atmospheric gases (such as CO2), NOx species play a
4
1.1.1 Effects of Indoor NO
xPollution on Human Health
The general population gets exposed to nitrogen oxides primarily by breathing, however, combustion sources (such as coal burning power plants) or areas with heavy motor vehicle use pose a threat of higher NOx exposure to people
who live nearby. Furthermore, gas stoves and heating appliances which use wood and kerosene as fuel, produce more nitrogen oxide as compared to other alternatives. Finally, tobacco smoke contains nitric oxide (NO) and nitrogen dioxide (NO2), so
people who smoke or breathe in second-hand smoke may be exposed to higher levels of NOx [12].
The most common manifestations of low level NOx (<50 ppm) exposure are
pulmonary symptoms such as cough, dyspnea (labored breathing), chest tightness/pain, choking, wheezing or rales. Other acute symptoms may include irritation of mucous membranes (including the eyes), light-headedness, agitation/confusion, weakness, fatigue, nausea, abdominal pain and even loss of consciousness [13] . Exposure to low levels can also result in fluid build-up in the lungs (pulmonary edema), 1 or 2 days after exposure [12].
Breathing high leves of NOx (>100 ppm) however immediately causes rapid
burning, spasms, swelling of tissues in the throat/upper respiratory tract, reduced oxygenation of body tissues, build up of fluid in lungs and in more serious cases death [12].
It should be noted that although nitric oxide (NO) constitutes the major portion of atmospheric NOx, it reacts readily with oxygen to form NO2, which is
even more toxic than NO and can be a source of acute lung injury with pneumonitis and fulminant pulmonary edema, even at low doses [14]. The pulmonary injury related specifically to NO2 exposure occurs as a result of NO2 conversion to HNO3
(nitric acid) and HNO2 (nitrous acid) in the distal airways where type 1 pneumocytes
and ciliated airway cells are directly affected. NO2 initiates free radical generation in
terminal bronchioles which results in protein oxidation, lipid peroxidation and subsequent cell membrane damage. Macrophage and immune function is also altered by NO2, causing impaired resistance to infection [13].
5
Apart from these direct effects, NOx species also react with ammonia,
moisture, and other compounds to form small particles (<2.5 μm) in the air andwhile the primary particles are emitted directly from a source (such as construction sites, unpaved roads, fields, fires, etc.), these nitrogen oxide related particules (formed in atmospheric reactions) are known as secondary particles and they make up most of the fine particle pollution [5].
These fine particles are especially pernicious since they are absorbed deeply into the lungs and even into the bloodstream. Exposure to particle pollution triggers a variety of problems, including [5]:
premature death in people with heart or lung disease, nonfatal heart attacks,
irregular heartbeat, aggravated asthma, decreased lung function,
increased respiratory symptoms, such as irritation of the airways, coughing or difficulty breathing.
6
Another subsidiary damage of NOx on human health comes from its role in
the generation of ground level ozone, a highly toxic compound. Breathing in ozone has some deleterious consequences, including chest pain, coughing, throat irritation, and congestion. It can aggravate bronchitis, emphysema, asthma and chronic exposure to ozone carries the risk of permanent scarring to lung tissue [8].
The first and foremost stage of combatting NOx related health-problems is to
reduce the production of nitric oxides and since a large amount of the NOx emission
occurs as an outcome of fuel oil combustion in motor vehicles [15], the prevention of noxious emission from the automobile engines is necessary. Several approaches for NOx abatement have been tried in automotive catalyst industry and some of these
methods shall be discussed in the next section.
1.1.2 Catalytic Control of NO
xPollution
In 1952, Haagen-Smit formulated the relationship between atmospheric NOx
species and the formation of photochemical smog in Los Angeles [16], since then there has been an ever increasing interest on the control of NOx emissions. In United
States, the first regulations on NOx emission came in late 1969 and they were enacted
in California by the local ―Air Pollution Control District‖ [17]. In 1991, Environmental Protection Agency (EPA) has published Tier 1 standards for light-duty vehicles in the U.S. and these rules were progressively introduced between 1994-1997. Then, in 1999, more stringent Tier 2 standards were adopted to be phased in between 2004-2009 and this set of standards also brought in additional changes for larger vehicles. Finally, Tier 4 standards are designed for 2008-2015 and these regulations require the emission of NOx to be reduced by about 90% compared
to Tier 2 standards, down to 0.40 g/kW-h [18].
Similarly, Europe is also taking its measures against NOx emissions and
EURO 6 AECC regulations (Emission Control Technologies and Euro 5/6 Emission Legislation) state that by the end of 2014, diesel engines should not emit more than 0.08 g of NOx per km travelled [19]. Table 1 shows the evolution of standard
7
regulation of atmospheric pollutants from both gasoline and diesel engines in the European Community [18]:
gasoline engine
standard regulation a CO HC NOx HC +NOx
Euro 1 (1993) 2.72 0.97 Euro 2 (1996) 2.20 0.5 Euro 3 (2000) 2.30 0.20 0.15 Euro 4 (2005) 1.00 0.10 0.08 Euro 5 (2009) 1.00 0.10 0.06 Euro 6 (2014) 1.00 0.10 0.06 a
Measured from New European Driving Cycle (g/km)
diesel engine
standard regulation a CO NOx HC +NOx particulates
Euro 1 (1993) 2.72 0.97 0.14 Euro 2 (1996) 1.00 0.90 0.10 Euro 3 (2000) 0.64 0.50 0.56 0.05 Euro 4 (2005) 0.50 0.25 0.30 0.025 Euro 5 (2009) 0.50 0.18 0.25 0.005 Euro 6 (2014) 0.50 0.08 0.17 0.005 a
Measured from New European Driving Cycle (g/km)
In order to meet up with the expectations of these demanding regulations, the automotive catalyst industry has come up with several solutions to limit the pollutant emissions. Three of such important and widely used technologies can be listed as:
Three-Way Catalysts (TWC)
Selective Catalytic Reduction (SCR) NOx Storage/Reduction (NSR)
Table 1. Standard regulation of atmospheric pollutants from mobile sources in the European Community (1993-2014) [18]
8
Most of the commercially available Three-way catalysts (TWCs) contain noble metals (such as Pt/Rh and/or Pd/Rh) dispersed on a washcoat made up of Al2O3, CeO2, ZrO2, CaO, MgO and La2O3 [20]. As the name implies, TWCs enable
the removal of three different post-combustion products (NOx, CO and
hydrocarbons) in three concurrent reactions: the reduction of nitrogen oxides (NOx)
to N2 and O2, the oxidation of carbon monoxide (CO) to carbon dioxide (CO2) and
the oxidation of unburned hydrocarbons (HC) to CO2 and H2O .
2NOx → xO2 + N2 (8)
2CO + O2 → 2CO2 (9)
CxH2x+2 + [(3x+1)/2]O2 → xCO2 + (x+1)H2O (10)
The efficiencies of these reactions depend critically on the air to fuel ratio of the engine and TWCs perform best in the conventional gasoline engines where the A/F is around 14.5:1 [21].
Consequently, for lean burn engines where the A/F is around 25:1, TWCs do not work effectively, hence another catalytic conversion technology was required for NOx abatement in high air to fuel ratios. Selective Catalytic Reduction (SCR) is one
of these methods and it uses either ammonia (NH3) or urea ((NH2)2CO) as the
selective reductant to reduce the NOx in thefollowing reactions [15]:
4NH3 + 4NO + O2 → 4N2 + 6H2O (11)
4NH3 + 2NO + 2NO2 → 4N2 + 6H2O (12)
However, SCR also includes many competitive and nonselective reactions with oxygen and may produce secondary emissions, such as N2O, NO, NH4NO3,
NH4-NO2, NH4HSO4, and (NH4)2SO. Among these secondary emissions, ammonium
nitrate (NH4NO3) has a tendency to form at low temperatures and is explosive. This
product may also deposit in the pores of the catalyst, rendering it temporarily deactivated. Furthermore, sulfur in the diesel fuel leads up to the formation of SO2
and SO3 in oxidative conditions and NH3 can combine with these products to form
9
catalytic units. Besides, NH3 (necessary for SCR) itself is toxic, corrosive, difficult to
handle and a primary/secondary pollutant on its own. Urea has also various significant limitations as a reducing agent in SCR applications, such as its relatively high freezing point (-11oC), which makes it unacceptable in winter conditions for several countries. [15].
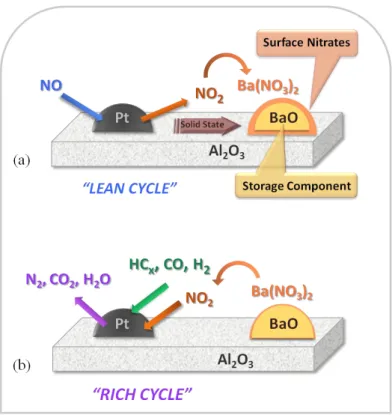
Another catalytic conversion technology proposed for the lean-burn engines is the NOx Storage-Reduction (NSR) method, also known as the Lean NOx Trap
(LNT). This system works under alternating fuel lean and fuel rich periods, during which NOx is oxidized/stored and reduced consecutively. In the lean period (60-120
sec), the major component of NOx in the diesel exhaust, NO, is oxidized over a
precious metal (such as Pt, Pd and/or Rh) and the product NO2 is captured on a
storage component (such as BaO, K2O etc.) in the nitrate (NO3-) form (Figure 3a)
[21]. In the shorter rich period (5-15 sec) these nitrates are reduced into N2(g) and
O2(g) while the unburned hydrocarbons are oxidized to CO2(g) and H2O(g). The
catalyst is regenerated by the end of the rich period and the storage sites are ready for the next lean period [21] (Figure 3-b).
NO
NO2
Ba(NO3)2 (13)
Ba(NO3)2 BaO + NO2 N2+CO2+H2O (14) O2 Pt O2 Ba HC, H2, CO HC, H2, CO Pt
10
Nevertheless, NSR catalysts have serious limitations as well, such as a high affinity towards sulfur compounds in the exhaust fume, which are adsorbed on the storage sites as sulfates and block those sites for NO2 adsorption. Unfortunately, this
binding is rather irreversible since the decomposition of sulfates requires higher temperatures than that is needed for nitrates. This poisoning occurs as a result of the higher thermodynamic stability of the sulfate species compared to the corresponding nitrates [15].
Many different types of catalytic converters in motor vehicle engines work for the same important aim; to reduce the emissions of NOx into the atmosphere.
Unfortunately, these systems cannot completely eradicate NOx pollution and still we
have nitric oxides in the air in spite of all these efforts. In the U.S., EPA has set National Ambient Air Quality Standards (NAAQS) for NO2 and according to these
standards, the hourly average for NO2 should not exceed 0.100 ppm while the yearly
average limit is set to an even lower value of 0.053 ppm [22].
Figure 3. Illustration of the general operational principle of NSR catalyst during (a) lean cycle, (b) rich cycle.
11
In order to assess the air quality, EPA has also developed the color coded Air Quality Index (AQI) System, as shown in Table 2 below [22]. The level needed to violate the federal health standard for any pollutant corresponds to an AQI of 100 for that pollutant. Thus for NO2, an AQI of 100 corresponds 0.053 ppm (averaged over
24 hours) while an index value of 201 corresponds to an NO2 level of 0.650 ppm
(averaged over 24 hours). After this point (0.650 ppm), one starts to experience the short-term health effects for NO2.
Table 2. Air quality index (AQI) for Nitrogen Dioxide [22]. EPA Air Quality Index (NO2) Levels of Health Concern Cautionary Statements 0 - 50 Good None 51 - 100 Moderate None
101 - 150 Sensitive Groups Unhealthy for None
151 - 200 Unhealthy None
201 - 300 Very Unhealthy
Children and people with respiratory disease, such as asthma, should limit
heavy outdoor exertion.
301 - 500 Hazardous
Children and people with respiratory disease, such as asthma, should limit moderate or heavy outdoor exertion.
In cities with high air pollution, the hourly NOx levels can climb up to 0.320
ppm near motorways during the rush hours [23]. Hence comes the second stage of combatting NOx related health-problems, which is to reduce the levels of atmospheric NOx. This aim, however, has to be realized at ambient conditions (at RT
and under regular atmospheric conditions), since NOx(g) as a post-combustion
12
For this aim, photocatalytic systems can be proposed as a promising solution since they can be tailored to efficiently clean/purify air under ambient conditions with the help of ultraviolet (UV) and/or visible (VIS) light. In search of the perfect photocatalyst, titanium dioxide (TiO2) has been studied extensively by many
researchers since Fujishima and Honda demonstrated the semiconductor capabilites of rutile TiO2 in water-splitting reaction in 1972 [24].
1.2 Physical Properties of Titania
Photocatalytic activity of titanium dioxide depends critically on its degree of surface crystallinity [25], therefore it is very important to know the properties of TiO2 crystalline phases. Under normal atmospheric pressures, titanium dioxide has
three polymorphs; rutile (stable), anatase (metastable) and brookite (metastable). Although other high-pressure phases of TiO2 are also reported (such as; TiO2-II
[Srilankite], cubic fluorite-type, pyrite-type, monoclinic baddeleyite-type, cottunnite-type polymorphs [26]), these phases are of little importance for the photocatalytic research & development platform and they will not be further explored in this thesis. In terms of abundancy among the TiO2 polymorphs, anatase and rutile phases
are significantly more common compared to the rarely found brookite, and although brookite also shows photoactivity [27-29], the field of photocatalysis is focused almost completely on anatase and rutile crystalline phases, making these former two polymorphs much more important in their photocatalytic applications compared to brookite.
Regarding the bulk thermodynamic stability, rutile is the more stable polymorph at all temperatures/pressures up to 60 kbar, where TiO2-II becomes the
thermodynamically stable phase [30]. Under ambient conditions, there is a small difference in the Gibbs free energy of formation between the bulk forms of these three polymorphs of TiO2 (4-20 kJ/mol), suggesting that anatase and brookite are
almost as stable as rutile under conventional temperatures and pressures. However, at elevated temperatures, anatase is transformed into rutile and thermodynamic studies show that negative pressures are required for the Gibbs free energy of anatase to be
13
lower than that of rutile (Figure 4), thus the transformation of anatase to rutile is irreversible [26].
It should be noted that due to surface free energy and surface stress effects, the relative stability of TiO2 polymorphs may be reversed when the particle size
decreases. At normal temperature and pressure, anatase is the most thermodynamically stable crystal structure for a particle size less than 11 nm, while between 11-35 nm, brookite presents the highest stability and for a particle size greater than 35 nm, rutile is the most stable phase [30].
Some of the fundamental properties of anatase and rutile are given below in Table 3 [26]:
Table 3. Properties of the anatase and rutile phases [26].
Property Anatase Rutile
Crystal Structure Tetragonal Tetragonal
Atoms per unit cell 4 2
Figure 4. (a) Bulk Gibbs free energy of formation vs. temperature and (b) bulk Gibbs free energy of formation vs. pressure for anatase for anatase and rutile phases. [26]
14
Property Anatase Rutile
Space group I 41/amd P 42/mnm
Lattice parameters (nm) a= 0.378 b= 0.951
a= 0.459 b= 0.296
Density (g/cm3) 3.89 4.25
Calculated indirect band gap (eV) (nm) 3.23-3.59 345.4 – 383.9 3.02-3.24 382.7 – 410.1
Experimental band gap (eV) (nm) ~3.2 ~387 ~3.0 ~413 Refractive Index 2.54 2.79 Hardness (Mohs) 5.5-6 6-6.5
Bulk Modulus (GPa) 183 206
1.2.1 The Crystal Structure of Titania
In both anatase and rutile, the crystal structure contains chains of TiO6 octahedra where each Ti4+ is surrounded by six O2- ions. However these crystal structures differ from one another by how the octahedra is distorted and how the octahedra chains are assembled in each case. In rutile, the distortion of the octahedra is slightly orthorhombic; yet in anatase, TiO6 octahedron is significantly distorted
and its symmetry is even lower than orthorhombic. Again in rutile, an octahedron is surrounded by 10 neighboring octahedra (two shared edges and eight shared corners), while in anatase each octahedron has eight neighbors (four shared edges and four shared corners), as depicted in Figure 5.
15
Also in anatase, Ti-Ti distances are larger compared to rutile (0.378 and 0.304 nm in anatase vs. 0.357 and 0.296 nm in rutile), but on the other hand, Ti-O distances are shorter in anatase (0.193 and 0.198 nm in anatase vs. 0.195 and 0.198 nm in rutile) [31]. Electronic band structures and mass densities of each polymorph is affected by these variations in their respective lattice structures.
1.2.2 Anatase to Rutile Phase Transformation
The formation of either anatase or rutile crystalline phase during TiO2
synthesis depends primarily on the synthesis route and synthetic parameters. However, in general anatase forms as the initial crystalline TiO2 phase for many of
the synthesis protocols that take place at low temperatures, and the rutile phase is typically observed at elevated temperatures. [26]. This phenomenon can be explained from a thermodynamic point of view via Ostwald’s step rule which states that ―the
first phase to form will be the one possessing the least surface energy with respect to the reactants‖ [32]. Therefore, the relatively lower surface free energy of anatase
may lead to the rapid crystallization of this phase instead of rutile, although the Gibbs free energy of formation for bulk rutile is lower. Another explanation can be proposed from a structural perspective, the relatively less-constrained (and less dense) molecular structure of the anatase may be easier to be rearranged from the titanium-oxygen lattice of the amorphous reactants [32].
Figure 5. Three-dimensional representation of the octahedral arrengement in anatase and rutile phases of titania [26].
16
That being said, rutile can also be crystallized at low temperatures using hydrothermal methods, during which titania is precipitated directly from a liquid phase. However apart from this technique, high-temperature treatment is the most common way to obtain rutile crystals. Table 4 outlines various synthesis methods and the resultant phases of TiO2 [26].
Table 4. Common synthesis methods of titanium dioxide and resultant phases (Amorph: Amorphous, A: Anatase, R: Rutile) [26]
Synthesis Method Mechanism
Phases formed
Amorph A R A+R
Room Temp. hydrolysis of TiCl4
Precipitation from room temperature solutions of TiCl4
Room Temp. sol-gel synthesis
Hydrolysis of TiCl4 or an
organometallic compound
Flame pyrolysis of TiCl4
Combustion of TiCl4 with
oxygen; used in industrial processes
Synthesis Method Mechanism
Phases formed
Amorph A R A+R
Solvothermal/ Hydrothermal
Precipitation of TiO2 from
an aqueous or organic solution at elevated temperatures
Chemical Vapor Deposisiton (CVD) Spraying of Ti-bearing solution
Physical Vapor Deposition (PVD) Deposition of evaporated Ti and its subsequent17
The anatase to rutile transition (referred also as the ART) is a reconstructive process and in pure anatase, rutile may start nucleation at (112) twin interfaces of anatase, because these sites are structurally similar to rutile [33, 34]. In the transformation product, the (112) planes of anatase are kept as the newly formed (100) rutile planes [26] and an overall volume contraction (c.a. 8%) is observed as the c-axis is contracted during the process [35, 36]. Higher mass density of the rutile phase is explained by this decrease in the volume.
The ART is both temperature and time dependant, and several factors play a role in the exact temperature that is required for the transition to start and the time for it to be completed. Such parameters for undoped anatase can be listed as;
• Particle size • Nature of sample container • Particle shape (aspect ratio) • Impurities
• Surface area • Heating rate • Volume of sample • Atmosphere
It is generally considered that pure bulk anatase starts to transform when it is heated around ~600oC in air. Nonetheless, temperatures ranging from 400 to 1200oC have been reported [35, 37, 38] for the ART, owing to the differences in the above-listed factors.
The kinetics of the anatase to rutile transition are also strongly dependent on the presence of dopant atoms which may either facilitate or hinder the ART [39]. In this regard, the resulting effect depends critically on the size, the valence and the
content of the dopant. For cationic dopants, cations with smaller radii and lower
valence (<4) are known to promote the transition while cations with larger radii and higher valence (>4) can inhibit it [26].
Since the oxygen sublattice determines the structural stability of anatase and the reorganization of the bonds en route to the rutile formation, the transition is largely affected by the changes in the oxygen sublattice. If a cation with low valence substitutes a Ti4+, site, an increase in the oxygen vacancies is observed to obtain charge neutrality; this can facilitate the rutile transition. If, however, a cation with higher valence is substituted for a Ti4+, then this requires the annihilation of the existing oxygen vacancies, which impedes the rutile transition.
18
Figure 6 shows a plot of the inhibiting and promoting dopant atoms. [26].
The effects of anionic dopant addition on the anatase-to-rutile transition is not very well known in the literature, however with a similar reasoning, it may be argued that the anionic dopants that can fill in the oxygen vacancies (such as F- [40] or N3- [41]) might increase the structural stability and inhibit the phase transformation [26].
1.2.3 Electronic Band Structure of Titania
In a semiconductor, the valence band (VB) and the conduction band (CB) are separated with a small yet non-zero band gap (Eg). The range for the VB-CB
seperation lies between 0 to 4.0 eV for a semiconductor [42] and accordingly, titania is classified as a semiconductor.
Figure 6. Plot of cationic dopant types, on account of their ionic radii and valence, categorized by their anatase-to-rutile transition inhibitive or promoting effect [26].
19
The density of states (DOS) of TiO2 consists of Ti eg, Ti t2g (dxz, dyz anddxy),
O pσ and O pπ. The upper valence band is composed of three main regions; the lower
energy σ bonding region (mainly contributed by O pσ), the middle energy π bonding
region and the high energy O pπ states. These O pπ states at the top of the valence
band are non-bonding, since here the hybridization with Ti-d states is almost negligible. [43, 44]. On the other side, the conduction band can be decomposed into two regions; Ti eg (> 5eV) and and Ti t2g (< 5eV) bands. In anatase, the main peak of
t2g band is idenfied to be mostly dxz+dyz states (antibonding π*) and the nonbonding
dxy state lies at the bottom of the conduction band. Figure 7 shows the DOS of
anatase TiO2 structure and its derived molecular orbital diagram [43].
Figure 7. (a) Total and projected densities of states (DOS) of the anatase TiO2
structure (b) Molecular-orbital bonding structure for anatase TiO2 [43]
20
For the rutile, a nonbonding dxy feature is less significant, because rutile
phase is denser than anatase and has smaller Ti-Ti distances, so the t2g orbitals at the
bottom of the conduction band provide metal-metal interactions and lie lower than in the case of anatase [43, 44]. As a result of this, rutile has a smaller gap between its valence and conduction bands. Figure 8 gives a comparison of the calculated electronic density of states (DOS) for bulk rutile and anatase structures [45].
In bulk limit, it is both experimentally determined and theoretically calculated that anatase has an indirect band gap of ~3.2 eV while rutile has a direct band gap around 3.0 eV [25, 26, 30, 43, 46, 47]. Kavan et al. [48] experimentally showed that the difference between the band gap of anatase and rutile phases occurs mainly as a result of the change in the position of the conduction band edge, and the CB edge for anatase lies ~0.2 eV higher than that of rutile.
1.3 Photocatalysis on TiO
2-based materials
The principle of photocatalytic reactions on semiconductor surfaces can be described simply in the following way; if a photon with energy equal to or greater than the band gap energy (hν≥Eg) of a semiconductor is absorbed by that material, a
valence band electron (e-VB) is excited to the conduction band, leaving a positively
charged hole (h+) behind and this process creates an electron-hole pair.
Figure 8. Electronic density of states for bulk rutile (upper panel) and anatase (lower panel) phases. The valence band maximum is taken as the zero of energy [45]
21
These pairs, also known as the charge-carriers, diffuse to the surface of the material and there, they react with the surface-adsorbed species and decompose them [44, 46].
After the initial excitation, the electron-hole pair may reach different outcomes under different circumstances. The photoinduced electron may migrate to the semiconductor surface and reduce an electron acceptor, which is generally oxygen in aerated conditions (Figure 9, Pathway C). The hole, on the other hand, can also migrate to the surface and combine with an electron of a donor species (such as H2O or OH-), oxidizing the donor in turn (Figure 9, Pathway D). However, rather
than undergoing such charge-transfer processes, the electron-hole pair may recombine / annihilate each other and this recombination event may take place either on the surface of the semiconductor (Figure 9, Pathway A) or inside the bulk of the material (Figure 9, Pathway B) [46].
The efficiency of a photocatalytic reaction is measured in terms of quantum
yield, a quantity which is calculated by the number of a specific event occuring per
photon absorbed. Since it is very difficult to measure the actual amount of photons absorbed, all the light that is sent to the surface is assumed to be absorbed, an the Figure 9. Schematic view of the photoexcitation and the following deexcitation events [46].
22
quantum yield calculated in this way is named the ―apparent quantum yield‖ [46]. Electron-hole recombinations decrease the quantum yield and so the efficiency of the photocatalysis depends on the recombination rate in the semiconductor.
Bulk and surface irregularities/defects usually act as charge-carrier traps and affect the recombination rate, however the effect of such carrier traps on the photocatalytic efficiency is much debated [25]; these traps may be beneficial if they promote charge-carrier separation by stabilizing the seperated e- /h+ pair. In this case, trapping helps to retard the recombination event, which in turn increases the photocatalytic efficiency [46]. Another advantage may be if the charge-traps localize charge carriers at TiO2 surfaces where the electron transfer takes place. On the other
hand, trapping can be disadvantageous when the charge carriers are trapped far from the preferred electron transfer sites or if they recombine in these trapping sites [25].
The quantum yield (or photonic efficiency) is also greatly influenced by the irradiation type and source. In order to provide the energy required for the excitation of a semiconductor, various types of electromagnetic radiation (Table 5) can be used, depending on the bandgap of the photocatalyst [42]. Table 6 gives the bandgap energies for different semiconductors [42].
Table 5. Excitation energy types used in photo-processes [42].
Type of EM radiation Wavelength (nm) Energy (eV)
Vacuum UV (VUV) 100-200 12.4 – 6.2
UV-C 200-280 6.2 – 4.4
UV-B 280-315 4.4 – 3.9
UV-A 315-380 3.9 – 3.3
23
Table 6. Bandgap energies (eV) of various semiconductors and their respective colors [42].
Semiconductor Eg (eV) Color
Cu2O 2.2 Red
CdS 2.4 Yellow
Bi2O3 2.7 Yellow
TiO2 (rutile) 3.0 White
TiO2 (anatase) 3.2 White
ZnO 3.2 White
SnO2 3.8 Grey
Having a bandgap of at least 3.0 eV (Rutile), pure TiO2 can be excited with
the high energy portion of the visible light or better with a UV-A source. Also, being relatively cheap, stable and non-toxic, TiO2 is preferred as a photocatalyst in a
multitude of applications, ranging from energy technologies such as hydrogen generation [24, 49, 50] and dye-sensitized solar cells [51, 52] to air and water purification [53-57], as well as self-cleaning tiles [58], non-spotting glasses[59] and self-sterilizing (anti-bacterial) coatings [60, 61].
Anatase and rutile phases of TiO2 are both commonly used as photocatalysts
and in the literature, there is a general perception that anatase is inherently more photoreactive than rutile [25, 30, 46, 62]. It has been suggested that this increased photoreactivity of anatase is due to its slightly higher Fermi level and higher degree of hydroxylation (number of hydroxyl groups on the surface) [62-64]. However, this perception on the anatase photoreactivity may also be a result of its higher relative surface area compared to rutile. It is not easy to compare the activities of titania polymorphs with different surface areas. Recent generation of rutile nanoparticles with particle sizes smaller than 10 nm facilitated a direct comparison between anatase and rutile nanoparticles. Interestingly, many studies showed that these rutile
![Figure 5. Three-dimensional representation of the octahedral arrengement in anatase and rutile phases of titania [26].](https://thumb-eu.123doks.com/thumbv2/9libnet/5947700.123980/34.892.279.701.96.335/figure-dimensional-representation-octahedral-arrengement-anatase-rutile-titania.webp)
![Figure 6 shows a plot of the inhibiting and promoting dopant atoms. [26].](https://thumb-eu.123doks.com/thumbv2/9libnet/5947700.123980/37.892.246.725.194.633/figure-shows-plot-inhibiting-promoting-dopant-atoms.webp)