doi:10.1006/jcat.2001.3413, available online at http://www.idealibrary.com on
Identification, Stability, and Reactivity of NO
xSpecies Adsorbed
on Titania-Supported Manganese Catalysts
Margarita Kantcheva
1Department of Chemistry, Bilkent University, 06533 Bilkent, Ankara, Turkey
Received June 22, 2001; revised September 7, 2001; accepted September 10, 2001
The nature of the NOxspecies obtained on NO adsorption and its
coadsorption with O2at room temperature on TiO2and MnOx/TiO2 catalysts with two different manganese loadings has been studied by means of in situ Fourier transform infrared spectroscopy. In order to obtain information about the potentials of titania-supported man-ganese materials as catalysts for selective catalytic reduction (SCR) of NO by hydrocarbons, the stability and reactivity of the adsorbed NOxspecies toward decane has been investigated. The adsorption
of NO on the support and the catalysts leads to disproportionation of NO to anionic nitrosyl, NO−, its protonated form, NOH, and NO2. On coadsorption of NO and O2 at room temperature, vari-ous kinds of surface nitrates are observed differing in the mode of their coordination. The nitrates on the manganese-containing sam-ples are characterized by significantly lower thermal stability than the NO−3 species on the pure support, titania. The difference in the thermal stability of the nitrates parallels their reactivity toward the reducer (decane). The monodentate and bridged nitrates formed on the manganese catalysts studied are able to oxidize the adsorbed hydrocarbon at temperatures as low as 373 K. A mechanism for the interaction between the surface nitrates and the adsorbed decane is proposed in which the NO−3 and NCO−species are considered as important intermediates leading to dinitrogen formation. The con-centration of the reactive surface nitrates on the MnOx/TiO2catalyst
with manganese content corresponding to a monolayer is consider-ably greater than that on the sample with higher manganese loading. The former catalyst is promising for the SCR of NO by longer chain saturated hydrocarbons. ° 2001 Elsevier Sciencec
Key Words: adsorption of NO and NO/O2; in situ FTIR; TiO2;
MnOx/TiO2; NOxselective reduction by decane; mechanism.
INTRODUCTION
It is believed that selective catalytic reduction (SCR) by hydrocarbons is the most promising way for elimination of nitrogen oxide emissions from diesel and lean-burn engines. However, most DeNOx catalysts do not possess sufficient activity for commercial application due to the poisoning effect of sulfur compounds contained in the fuel. It has been reported (1, 2) that sulfation of TiO2 in a SO2 at-mosphere is difficult, and sulfur-resistant TiO2monolithic
1E-mail: [email protected].
supports have been used in lean-DeNOxcatalysts (3). On the other hand, MnOx species supported on alumina (4, 5), titania (5, 6), and active carbon (7) exhibited a good performance in the removal of NOx by SCR with ammo-nia at low temperatures. Recent investigations have shown that ammonia can be replaced by methane as the reduc-ing agent and manganese(II)-exchanged zeolites (8) are among the most promising catalysts. It thus appeared in-teresting to investigate the potentials of MnOx/TiO2 cata-lytic systems for application to SCR of NOx by higher hydrocarbons.
There are few papers dealing with in situ IR character-ization of the species produced during adsorption of NO and NO/O2coadsorption on manganese–alumina catalysts (9–11) and Mn–ZSM5 (12), and no data have been pub-lished on MnOx/TiO2systems (13).
The aim of this paper is to identify the species formed during NO adsorption and NO/O2coadsorption on titania-supported manganese catalysts by application of in situ Fourier transform infrared (FTIR) spectroscopy and to study their stability and reactivity toward decane. The cata-lysts were prepared using ion exchange and impregna-tion techniques, ensuring two different manganese loadings. Their physicochemical characteristics, nature, and localiza-tion of the active phase have been reported (14). On the surface of the ion-exchanged sample two kinds of man-ganese(III) cations, differing in their coordinative satu-ration and localization, are stabilized. The impregnated catalyst contains a mixture of manganese(III) and man-ganese(II) species.
EXPERIMENTAL
The support TiO2 used was a commercial product (Degussa P25, surface area 52 m2/g) containing 90% anatase and 10% rutile.
Two different catalysts which were obtained by ion ex-change and incipient wetness techniques (14) were studied. The sample prepared by ion exchange (denoted by MnT– IE) contained 1.9 wt% manganese, which corresponded to monolayer coverage. For the impregnated catalyst (4 wt%
479
0021-9517/01 $35.00 c
° 2001 Elsevier Science All rights reserved
480 MARGARITA KANTCHEVA
of nominal manganese content) the notation MnT–I is used.
The FTIR spectra were obtained on a Bomem-MB102 (Hartman & Braun) FTIR spectrometer at a spectral reso-lution of 4 cm−1(256 scans). A specially designed IR cell al-lowed recording of the spectra at ambient temperature and catalyst activation at higher temperatures. The cell was con-nected to a vacuum/adsorption apparatus. Self-supporting discs were used for the FTIR studies.
The samples were activated in the IR cell by evacuation at 673 K for 1 h, heating at 100 Torr(1 Torr = 133.3 N m−2) of oxygen for 1 h at 673 K, and evacuation for 1 h at the same temperature. The spectra of the catalysts thus activated were taken at ambient temperature and used as a background reference.
The nitrogen monoxide (99.9%) was supplied by Air Products. The decane used was of analytical (gas chro-matography) grade.
RESULTS AND DISCUSSION
Adsorption of NO and NO/O2Coadsorption
TiO2
Adsorption of NO at room temperature. The
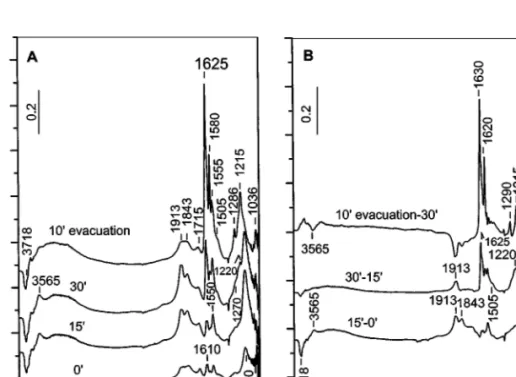
adsorp-tion of NO (10 Torr) on titania at room temperature is a time-dependent process (Fig. 1A). Immediately after introduction of NO into the IR cell (spectrum 00), a band at 1160 cm−1 and weak bands at 1913, 1843, 1710, 1610,
FIG. 1. (A) FTIR spectra of adsorbed NO (10 Torr) at room temperature on the activated TiO2sample for various times and after evacuation at room temperature for 10 min. (B) FTIR subtraction spectra obtained from the spectra in part (A) of the figure.
and 1550 cm−1 are detected. In the OH stretching region a negative band at 3690 cm−1 and weak absorption with maximum at 3565 cm−1are observed. All these bands grow with time except for the bands at 3565, 1160, and 1843 cm−1: they reach saturation in 15 min (compare spectra 150 and 300 and see below). The spectrum taken after 30 min of NO adsorption is characterized by bands at 1913, 1843, 1715, 1625, 1610, and 1580 cm−1 and a weak absorption at about 1500 cm−1. The bands at approximately 1270 and 1220 cm−1appear as high-frequency shoulders to the band at 1160 cm−1. In the OH stretching region a negative band at 3718 cm−1, a positive one at 3565 cm−1, and broad ab-sorption between 3500 and 3000 cm−1are observed. Evac-uation for 10 min at room temperature causes a decrease in the intensity of the bands at 1913, 1843, 1715, and 1160 cm−1 and enhancement of the absorption in the 1625–1200 cm−1 region. The negative band at 3718 cm−1 and the positive absorption at 3565 cm−1appear less intense.
In order to assign the absorption bands observed, the subtraction spectra are considered (Fig. 1B). The spectrum 150–00 shows that the intensities of the bands at 1913 and 1843 cm−1and below 1800 cm−1increase in the first period of 15 min. In the next 15 min (spectrum 300–150) the bands at 3565, 1843, and 1160 cm−1 stop growing whereas the bands at 1625, 1610 (shoulder), 1580, 1550, and 1505 cm−1 (shoulder) rise in intensity simultaneously with the com-plex absorption with a maximum at 1220 cm−1. These changes are accompanied by a considerable growth of the band at 1913 cm−1and additional alteration of the isolated
surface OH groups at 3718 cm−1(negative band). A slight increase in the absorption due to H-bonded hydroxyls (3600–3000 cm−1) is observed.
The region between 1625 and 1200 cm−1 is typical of NO−3 species coordinated to the titania surface (15), and the absorption bands observed can be attributed to bridged (1625 and 1215 cm−1), bidentate (1615, 1580, 1550, and 1215 cm−1), and monodentate (1505 and 1280 cm−1) nitrates. The formation of surface nitrates suggests dispro-portionation of NO on the surface of TiO2and the following reaction can be proposed:
3NO+ OH−= NO2+ NO−+ NOH. [1]
The molecule of NO2is characterized by an IR band at 1612 cm−1due toνas(NO2) vibrations (16, 17). The corre-sponding symmetric mode at 1325 cm−1 is Raman active. When adsorbed on oxide surfaces, NO2 gives rise to an absorption band in the 1642–1605 cm−1 region (13). This region is typical of surface nitrate species as well. For this reason, the weak band at 1610 cm−1(Fig. 1A, spectrum 00) can be tentatively assigned to adsorbed NO2.
The band at 1160 cm−1 can be attributed to theν(NO) stretching mode of NO−species (18). The involvement of surface OH groups in the interaction with NO is supported by the appearance of a negative absorption at 3690 cm−1 and a positive band at 3565 cm−1(Fig. 1, spectrum 00). The latter absorption is characteristic of O–H stretchings in N– OH groups (15–17). The experimental fact that the intensity of the band at 3565 cm−1changes in parallel with that of the band at 1160 cm−1 (see Fig. 1B, spectra (300–150) and (100 evacuation–300)) leads to the assumption that protonated anionic nitrosyl (i.e., NOH) species can form. The N–O–H bending mode is expected to fall in the 1300–1200 cm−1 region but could be covered by the absorption due to low-frequency components of theν3 split modes of the nitrate species. Anionic nitrosyl NO−species have been observed when NO is adsorbed on alkaline earth metal oxides such as MgO (19) and CaO (20) and on lanthanide metal oxides such as CeO2(21) and La2O3(22, 23), giving rise to ab-sorption in the 1195–1100 cm−1 region. Hadjiivanov and Kn ¨ozinger (18) reported also formation of NO− species (band at 1170 cm−1) during contact of NO with the tita-nia surface, assuming disproportionation of NO to NO−, nitrates, and hyponitrite ion, N2O2−2 (absorption band at 1335 cm−1). Under the conditions of our experiments, the latter species (which can arise by dimerization of NO−) is not observed.
The NO2produced by reaction [1] can interact with the surface OH groups, giving nitrate species (15, 24). Indeed, the growth of nitrate bands with time is accompanied by development of a negative band at 3718 cm−1 in the OH stretching region and appearance of H-bonded hydrox-yls (Fig. 1). The following disproportionation reaction has been proposed (15) as possible for the formation of nitrate
species on the titania surface during adsorption of NO2: 2OH−+ 3NO2= 2NO−3 + H2O+ NO. [2] This is a relatively slow process (15, 24). It can be pro-posed that the production of NO2according to reaction [1] is faster than its consumption (reaction [2]). This can ex-plain the growth of the nitrate bands after establishing the equilibrium of reaction [1]. The occurrence of the process described by reaction [2] has been confirmed by adsorption of NO2on deuteroxylated TiO2(24). This means that part of the absorption at 1625 cm−1is due to bending modes of adsorbed water molecules.
The bands at 1913 and 1843 cm−1 fall in the nitrosyl re-gion. However, interpretation of them as linear nitrosyls co-ordinated to two types of coordinatively unsaturated (cus) would be incorrect because the concentration of the more energetic (cus) titanium(IV) cations (α-titanium(IV) sites) is lower than that ofβ-titanium(IV) cations (25). The in-tensities of the bands at 1913 and 1843 cm−1shown in Fig. 1 are reversed (assuming similar absorptivities).
The subtraction spectra in Fig. 1B show that the bands at 1913 and 1843 cm−1increase in intensity within the pe-riod of 0–15 min. However, in the next pepe-riod of 15 min (spectrum 300–150) only the former band grows further in parallel with the bands due to nitrate species. For this rea-son, the band at 1913 cm−1is attributed to NO adsorbed on the titanium(IV) site to which a nitrate (bridged or mon-odentate) ion is coordinated (i.e., to the complex ON–Ti4+– ONO−2). The development of the band at 1843 cm−1 with time follows the behavior of the band at 1160 cm−1due to NO−/NOH species (Fig. 1B). Accordingly, the absorption at 1843 cm−1 is assigned to the complex ON–Ti4+–NO− and/or ON–Ti4+–NOH. The NO−3 and NO−/NOH species differ in their electronegativity, the nitrate ion possessing electron-accepting ability. As a result the electrophilicity of the titanium(IV) cations increases. This leads to enhance-ment of the σ component of the bond between the NO and the titanium cation and a stronger N–O bond in the ON–Ti4+–ONO
2nitrosyl complex (i.e., theν(NO) stretch-ing mode is at higher wavenumber). The nitrosyl band at 1843 cm−1falls below theν(NO) mode of gaseous nitrogen oxide (1876 cm−1), which suggests a π contribution to the bond of adsorbed NO. It can be assumed that NO−/NOH species can act asπ-donor ligands. This leads to an increase in the electron density on the titanium ion. Consequently,
theν(NO) stretching mode is shifted to a lower frequency.
The higher stability of the nitrosyls at 1843 cm−1than those at 1913 cm−1, which is observed on evacuation at room temperature (Fig. 1), is consistent with this assumption and indicates stabilization of the adsorbed NO throughπ-back donation. The proposed interpretation is in agreement with the conclusion made by Hadjiivanov and Kn ¨ozinger (18) that the titanium(IV) cations alone do not form nitrosyls. However, it contradicts the assignment of this pair of bands
482 MARGARITA KANTCHEVA
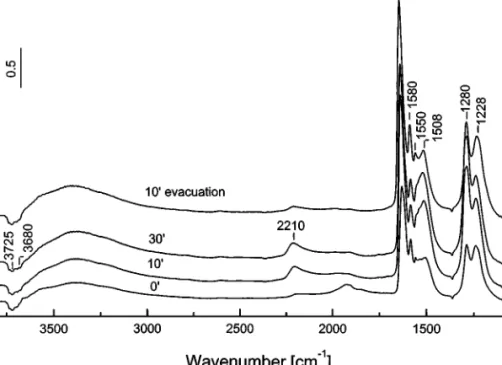
FIG. 2. FTIR spectra of adsorbed NO/O2mixture (28 Torr, NO : O2= 1 : 4) at room temperature on the activated TiO2sample for various times and after evacuation at room temperature for 10 min.
proposed by them. According to Ref. (18), the bands at 1913 and 1848 cm−1 are attributed to Fermi resonance of N–O stretching vibration (in nitrosyl formed on the titanium(IV) site having nitrate species in close proximity) with the Ti4+– N mode at approximately 900 cm−1. The argument for this interpretation is that the bands at 1913 and 1848 cm−1 grow in parallel. However, this is not the case reported here. In addition, the M–N stretching vibrations in nitrosyl complexes appear at lower frequencies (below 650 cm−1 (17)).
Evacuation for 10 min at room temperature causes a strong decrease in the intensity of the band for the NO− species and an increase in the intensities of the bands cor-responding to the nitrates, especially of those due to bridged and bidentate species. This indicates that under these con-ditions, the population of the respective adsorption forms has increased. This experimental fact can be explained as-suming transformation of some monodentate nitrates to bidentate and bridged ones. Another possibility is the oc-currence of the process
NO−+ 2NO2= NO−3 + 2NO [3]
(i.e., under static experimental conditions, the NO−species are stabilized on the titanium(IV) cations, but NO2can ox-idize them during dynamic evacuation). It is difficult to de-cide between these two possibilities from the spectra pre-sented in Fig. 1.
The weak band at 1715 cm−1, which resists evacuation, can be associated with Ti3+–NO species (18). Reduced titanium ions can arise from thermovacuum activation.
Finally the weak negative band at 1360 cm−1(Fig. 1) is due to nitrate ions adsorbed on the NaCl windows of the IR cell.
Coadsorption of NO and O2. Development of the FTIR
spectra with time of adsorption of an NO/O2 mixture (28 Torr, NO : O2= 1 : 4) is shown in Fig. 2. The weak bands in the 2000–1800 cm−1region due to nitrosyl species and de-tected immediately after the introduction of the adsorbates disappear during the contact time, indicating that the ad-sorbed NO is oxidized by oxygen. At the same time, massive absorption develops in the nitrate region. The assignment of bands is the same as described for NO adsorption (see Table 1). The following differences should be noted: (i) de-velopment of a band at 2210 cm−1due to NO+ion (15, 24), and (ii) absence of the bands at 3565 and 1160 cm−1due to NO−/NOH species.
The disappearance of NO−species when NO and O2are coadsorbed has been reported also in Ref. (18) and confirms the low oxidation state of nitrogen.
The thermal stability of the NOxsurface species has been studied under evacuation for 10 min at 373–673 K tem-perature range (the spectra are not shown). The surface nitrates completely disappear from the spectrum after evac-uation at 673 K. It should be pointed out that the spectra obtained on NO/O2 coadsorption on TiO2 are practi-cally identical to those obtained during the adsorption of NO2(15, 24). However, the thermal stability of the surface NOxspecies formed by NO2adsorption is higher: a band at 1550 cm−1has been detected after heating at 673 K and has been interpreted as a bridged nitro–nitrito compound (15).
TABLE 1
Assignment of FTIR Bands Observed on Adsorption of NO and NO/O2Coadsorption at Room Temperature on the Catalysts
Studied
Frequency (cm−1) Possible
Catalyst and mode assignment
TiO2(NO and NO/ 1913 (ν(NO)) ON–Ti4+–ONO−2 O2adsorption) 1843 (ν(NO)) ON–Ti4+–NO−/NOH
1715 (ν(NO)) Ti3+–NO 1630–25, 1215 (splitν3) NO−3 (bridged) 1615, 1215 (splitν3) NO−3 (bidentate) 1580, 1215 (splitν3) NO−3 (bidentate) 1555, 1215 (splitν3) NO−3 (bidentate) 1505, 1286 (splitν3) NO−3 (monodentate) 1160 (ν(NO)) Ti4+–NO−/NOH 3565 (ν(OH)) Ti4+–NOH 2210 (ν(NO)) NO+ MnT–IE (NO 1880 (ν(NO)) Mn3+–NO
adsorption) 1865 (ν(NO)) Mn3+–NO 1645 (high-frequency NO−3 (bridged) 1612 components of NO−3 (bidentate) 1555 splitν3mode) NO−3 (monodentate) 1487 (νas(NO−2)), NO−2 (bridging nitro– 1130 (νs(NO−2)) nitrito) 1200 (ν(NO)) Mn3+–NO−/NOH ∼3550 (ν(OH)) Mn3+–NOH MnT–IE (NO/O2 2155 (ν(NO)) NO+
adsorption) 2033 (ν(NO)) ON–Mn3+–ONO−2 1957 (ν(NO)) ON–Mn3+–ONO−2 1905 (ν(NO)) Mn3+–NO 1870 (ν(NO)) Mn3+–NO 1619, 1248 (splitν3) NO−3 (bridged) 1610, 1248 (splitν3) NO−3 (bridged) 1552, 1276 (splitν3) NO−3 (bidentate) 1514, 1320 (splitν3) NO−3 (monodentate) MnT–I (NO 1875 (ν(NO)) Mn3+–NO
adsorption) 1798 (ν(NO)) Mn2+–NO
∼1850 ON–Ti4+–NO−/NOH
1645, 1220 (splitν3) NO−3 (bridged) 1610, 1220 (splitν3) NO−3 (bridged) 1540–23, 1220 NO−3 (bidentate) 1470, 1423, 1300 (νas(NO−2) NO−2 (nitro–nitrito) 1190 (ν(NO)) Mnn+–NO−/NOH
3565 (ν(OH)) Mnn+–NOH (n= 2 or 3) 1150 (ν(NO)) Ti4+–NO−/NOH 3565 (ν(OH)) Ti4+–NOH MnT–IE (NO/O2 2210 (ν(ON)) NO+
adsorption) 1925–1896 (ν(NO)) ON–Ti4+–ONO−2 1620–10, 1275 (splitν3) NO−3 (bridged) 1570, 1240 (splitν3) NO−3 (bidentate) 1550, 1240 (splitν3) NO−3 (bidentate) 1505, 1320 (splitν3) NO−3 (monodentate)
MnT–IE Catalyst
Adsorption of NO at room temperature. Introduction
of NO (10 Torr, room temperature) into the IR cell (Fig. 3) causes the appearance of two bands at 1880 and
1865 cm−1 in the nitrosyl region, corresponding to two types of Mn3+−NO species in accordance with the exis-tence of two types of manganese(III) cations in the catalyst studied (14) and in agreement with the literature data on MnOx/Al2O3 (9, 10). No bands which can be assigned to adsorbed NO on titanium(IV) sites are observed.
In the low-frequency region, weak bands at 1645, 1612, 1555, and 1487 cm−1 and a complex absorption with maximum at 1200 cm−1 and shoulder at approximately 1130 cm−1are detected. The intensities of the nitrosyl bands decrease slightly after 50 min whereas those of the bands in the 1700–1100 cm−1region increase. With the extent of con-tact time, a relatively strong absorption develops in the OH stretching region, with a simultaneous increase in the inten-sities of the negative bands at 3725 and about 3700 cm−1.
Evacuation for 10 min at room temperature (Fig. 3, spectrum 100 evacuation) leads to almost complete disap-pearance of the Mn3+−NO nitrosyls (very weak band at 1860 cm−1). The spectrum contains strong absorption in
theν(OH) stretching region, with a maximum at 3290 cm−1,
two bands of moderate intensity at 1612 and 1200 cm−1and a shoulder at 1645 cm−1, a weaker band at 1478 cm−1, and a poorly resolved absorption at about 1130 cm−1. The species characterized by the band at 1555 cm−1are not observed.
The interpretation of the spectra observed (Fig. 3) is made on the assumption that the same NO disproportion-ation reaction [1] involving surface OH groups can occur also in the presence of supported manganese. This means that in the case of the MnT–IE catalyst, NO−/NOH species are formed as well. The surface OH groups participating in this process are probably of the type Mn3+−OH, and the NO−/NOH species (to which the band at 1200 cm−1 due
toν(NO) stretching mode is assigned) are coordinated to
manganese(III) cations. This suggestion is supported by the fact that the band at 1200 cm−1disappears in the presence of the NO/O2 mixture (see below, Fig. 4A (spectrum 00)). The NO2 produced in situ, following reaction [2], trans-forms into surface nitrates. Based on the sequence of ap-pearance/disappearance of the surface species and using literature data (10), the bands at 1645 and 1612 cm−1 are tentatively assigned to bridged and bidentate nitrates, re-spectively. The band at 1555 cm−1, which does not resist the evacuation, is attributed to monodentate nitrates. Com-pared to the pure support, the intensities of the absorption bands detected in the whole region are much lower for the MnT–IE catalyst, and probably the low-frequency compo-nents of the splitν3 modes of the surface nitrates are su-perimposed on the band at 1200 cm−1 or are too weak to be detected. The bands at 1487 (shifted to 1478 cm−1after evacuation) and 1130 cm−1are assigned to nitro (bridging NO−2) species (13, 15, 17, 23). Since the decrease in the in-tensity of the Mn3+−NO nitrosyl bands is negligible after prolonged NO adsorption, the oxidation of NO to NO2, re-spectively NO−3 species, by manganese(III) cations should be excluded.
484 MARGARITA KANTCHEVA
FIG. 3. FTIR spectra of adsorbed NO (10 Torr) at room temperature on the activated MnT–IE catalyst for various times and after evacuation at room temperature for 10 min.
The absorption in the OH stretching region with maxi-mum at 3290 cm−1and a part of the band at 1612 cm−1are due toν(OH) and δ(H2O) modes, respectively, of adsorbed water molecules produced according to reaction [2].
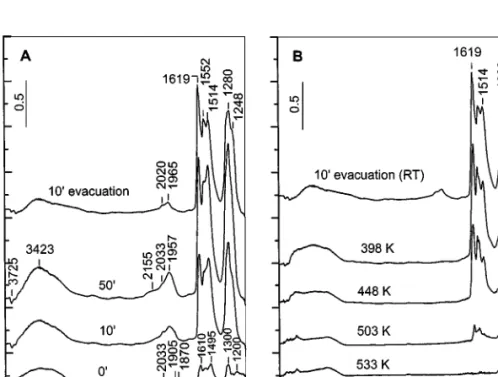
FIG. 4. (A) FTIR spectra of adsorbed NO/O2mixture (28 Torr, NO : O2= 1 : 4) at room temperature on the activated MnT–IE catalyst for various times and after evacuation at room temperature for 10 min. (B) FTIR spectra obtained after heating for 10 min in vacuum of the catalyst MnT–IE containing adsorbed NOxspecies.
Coadsorption of NO and O2at room temperature. The
time evolution of the spectra obtained during the contact of the catalyst MnT–IE with a mixture of NO and oxygen (28 Torr, NO : O2 = 1 : 4) is shown in Fig. 4A. Immediately
after the introduction of the adsorbates into the IR cell, weak bands in the nitrate region (1650–1200 cm−1) are detected. These bands correspond to various nitrate species and grow fast with increasing contact time. The band at 1200 cm−1 attributed to NO−/NOH species is not present in the spectrum taken after 10 min. Based on the sequence of appearance and thermal stability (see Fig. 4B), the absorption bands in the nitrate region are assigned as follows: 1619 and 1248 cm−1 (bridged nitrates), 1552 and 1280 cm−1 (bidentate nitrates), and 1514 and 1320 cm−1 (monodentate nitrates).
The bands in the nitrosyl region require special atten-tion. Immediately after introduction of the reaction mixture into the IR cell, weak absorption in the 2100–1850 cm−1 re-gion is observed. The bands at 1905 and 1870 cm−1are due to Mn3+−NO species (two types). In the spectrum taken 10 min letter (spectrum 100), these bands are masked by the broad absorption, with a maximum at 1957 cm−1and a shoulder at approximately 2030 cm−1. Since the latter bands develop together with the nitrate bands, they are assigned to two types of Mn3+−NO nitrosyls, which contain NO−
3 ions in their coordination spheres (i.e. (ON)−Mn3+−(ONO−2) complexes). The weak and broad absorption at approxi-mately 2155 cm−1 (which disappears after evacuation at room temperature for 10 min) is interpreted as adsorbed NO+ion (13, 15, 18, 24). The intensities of the nitrate bands display a slight decrease after evacuation at room temper-ature for 10 min (Fig. 4A, spectrum 100evacuation).
The thermal stability of the adsorbed forms is followed by heating the catalyst containing preadsorbed NOxspecies (spectrum 100 evacuation in Fig. 4A) under vacuum for
FIG. 5. FTIR spectra of adsorbed NO (10 Torr) at room temperature on the activated MnT–I catalyst for various times and after evacuation at room temperature for 10 min.
10 min in the 398–533 K temperature range (Fig. 4B). The least stable species are the nitrosyls (absorption bands at 2020 and 1965 cm−1), which are not observed after evacu-ation at 398 K. The nitrate species disappear after heating at 533 K.
It should be pointed out that the adsorption of NO2(at 2 Torr) at room temperature on the catalyst MnT–IE leads to identical surface species observed during the NO/O2 coadsorption (the spectra are not shown). No differences in their behavior on desorption at room and higher temper-atures are observed.
MnT–I Catalyst
Adsorption of NO at room temperature. The spectra of
adsorbed NO (10 Torr) at room temperature on the cata-lyst MnT–I taken at increasing adsorption times and after evacuation are shown in Fig. 5. The interpretation of the absorption bands is analogous to that proposed above for the MnT–IE catalyst (Table 1).
The following features are noticeable for the impreg-nated MnT–I catalyst, which are not observed in the case of the ion-exchanged sample, MnT–IE.
1. The MnT–I sample contains a mixture of manganese (II) and manganese(III) cations (14), and Mn2+−NO species (weak band at 1798 cm−1) are detected in addition to the Mn3+−NO (strong absorption at 1880 cm−1).
2. There is formation of NO−/NOH species coordi-nated to titanium(IV) cations (shoulder at approximately 1150 cm−1 to the band at 1190 cm−1 due to NO−/NOH species adsorbed on the manganese sites) and appearance
486 MARGARITA KANTCHEVA
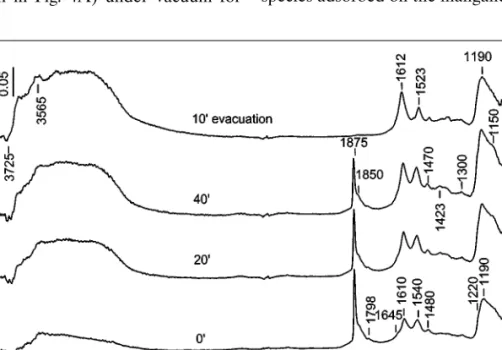
FIG. 6. (A) FTIR spectra of adsorbed NO/O2mixture (28 Torr, NO : O2= 1 : 4) at room temperature on the activated MnT–I catalyst for various times and after evacuation at room temperature for 10 min. (B) FTIR spectra obtained after heating for 10 min in vacuum of the catalyst MnT–I containing adsorbed NOxspecies.
of ON−Ti4+−NO−/NOH species (poorly resolved absorp-tion at about 1850 cm−1). This shows that there are coor-dinatively unsaturated titanium(IV) cations ions exposed on the surface of the MnT–I catalyst, which is in agreement with the lower dispersion of the active phase established earlier (14).
Coadsorption of NO and O2at room temperature. The
time evolution of the FTIR spectra during the NO/O2 ad-sorption (28 Torr, NO : O2 = 1 : 4) at room temperature is shown in Fig. 6A. The spectra in the OH and nitrate regions are very similar to those observed on the ion-exchanged catalyst (Fig. 4A). The absorption bands in the nitrosyl re-gion (about 1900 cm−1) are associated with the surface com-plex of the type NO–Mn+−NO
3−(M= manganese(II/III) or titanium(IV) cations). The band at 2210 cm−1 is at-tributed to Ti4+−NO+species (see Fig. 2).
The thermal stability of the nitrate species obtained dur-ing the NO/O2coadsorption seems to be comparable to that of the MnT–IE catalyst (compare Figs. 4B and 6B). Based on the sequence of their formation and thermal stability, the nitrates are identified as bridged (1620 and 1275 cm−1), bidentate (1570 and 1240 cm−1 and 1550 and 1240 cm−1), and monodentate species (1505 and 1320 cm−1).
Summary of the Results on NO Adsorption and NO/O2
Coadsorption on the Catalysts Studied
The proposed assignments of the NOx species formed during the adsorption of NO and its coadsorption with O2 are summarized in Table 1.
The common feature observed during the adsorption of NO on the support and manganese-containing catalysts is the appearance of relatively strong bands at 1160 cm−1
(TiO2) and 1200–1190 cm−1 (MnT–IE, MnT–I)
immedi-ately after introduction of the adsorbate into the IR cell (Figs. 1, 3, and 5). These bands are attributed to the
ν(NO) stretching vibration of anionic nitrosyl, NO−, and
its protonated form, NOH. The distinct absorption at 3560– 3565 cm−1, which develops in parallel with the bands in the 1200–1150 cm−1region is interpreted asν(OH) stretching vibration of the NOH species. The NO−/NOH species are not stable when NO and O2are coadsorbed (Figs. 2, 4, and 6) and are not observed (TiO2) or disappear fast from the spec-trum (manganese-containing catalysts). This behavior con-firms the formation of reduced adsorption forms. It should be pointed out that Kapteijn et al. (9) reported also for-mation of reduced species during the adsorption of NO on the MnOx/Al2O3catalyst: the absorption at 1208 cm−1has been attributed to the hyponitrite ion, N2O22−. For the for-mation of these species, a disproportionation reaction of NO has been proposed which involves surface O2−ion. In addition, the rapid disappearance of the Mn3+−NO species at 1843 cm−1during contact with NO led the authors to the conclusion that nitrosyls (probably dinitrosyls) are related to the appearance of the N2O2−2 ion. In the case of the MnT– IE and MnT–I catalysts studied, only a slight decrease in the intensities of the Mn3+−NO species after prolonged NO adsorption is observed. This indicates that the nitrosyls are not associated with the formation of NO−species, and the disproportionation of NO occurs through a reaction, which
is common to both pure TiO2 and titania-supported man-ganese catalysts (i.e., with the participation of the surface OH groups).
The second product of the disproportionation of NO is NO2, which gives rise to surface nitrates. The concentration of the nitrate species is much higher on the pure titania than on the manganese-containing samples. This difference is probably due to different amounts of NO2produced in situ and leads to the conclusion that the titania surface favors the disproportionation of NO more than the manganese-containing samples.
On coadsorption of NO and O2at room temperature on the samples studied, various kinds of surface nitrates are observed differing in the modes of their coordination. The nitrates on the manganese-containing samples are charac-terized by a significantly lower thermal stability than that of the nitrates on the pure support, TiO2.
Reactivity of the Surface Nitrates toward Decane
In order to understand the role of the adsorbed NOx species in the SCR of NO by longer chain hydrocarbons, the interaction of decane with NOxprecovered catalyst sur-faces has been studied.
MnT–IE Catalyst
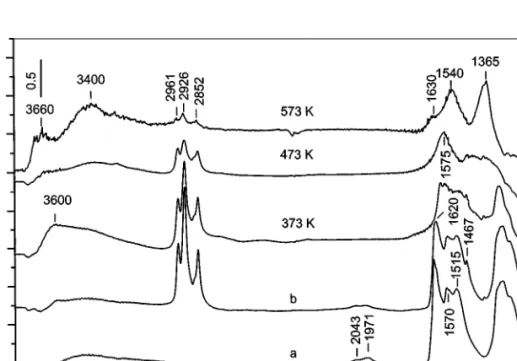
The interaction of decane (0.6 Torr, followed by a 15-min evacuation at room temperature) at various temperatures (Fig. 7) with the stable NOxspecies obtained on the surface
FIG. 7. FTIR spectra of the catalyst MnT–IE taken after adsorption of NO/O2mixture (40 Torr, NO : O2= 1 : 4) at room temperature followed by evacuation for 10 min (a), after adsorption of decane (0.6 Torr) on the NOxprecovered catalyst followed by evacuation for 10 min at room temperature
(b), and after heating the closed IR cell for 10 min at the indicated temperatures.
of the MnT–IE catalyst by coadsorption of NO and O2 (40 Torr, NO : O2= 1 : 4, followed by evacuation for 10 min at room temperature) has been studied. The introduction of the hydrocarbon to the catalyst at room temperature does not lead to changes in the NOx bands. Absorption typi-cal for decane is observed in theν(CH) stretching region: bands at 2961 (νas(CH3)), 2926 (νas(CH2)), and 2852 cm−1
(νs(CH3)). The bands at 1467 and 1380 cm−1 (weak) are
due to CH2 scissoring vibration (βs(CH2)) and symmet-ric CH3deformation vibration (δs(CH3)), respectively (26). The rise in the temperature of the closed IR cell from 373 to 573 K leads to a gradual decrease in the intensities of the bands, corresponding to the adsorbed hydrocarbon and NO−3 species (the spectra are taken after cooling the cell to room temperature). This result indicates that interaction between the decane and nitrate species adsorbed on the sur-face of the catalyst has occurred. The spectrum detected af-ter heating at 373 K contains strong absorption in theν(OH) stretching region, with a maximum at 3600 cm−1 (Fig. 7). Obviously, oxidation of the hydrocarbon starts already at this temperature. The treatment at 473 K causes the band at 3600 cm−1 to vanish, and a weak, broad band between 3550 and 3100 cm−1 is detected. The only species which appears with significant intensity in the 1700–1100 cm−1 re-gion after interaction at 473 K is the one characterized by a band at 1575 cm−1. This species could be associated with a carbonate–carboxylate structure and/or a less-reactive bidentate nitrate whose low-frequency component is not resolved in the full spectra but appears in the subtraction
488 MARGARITA KANTCHEVA
FIG. 8. FTIR subtraction spectra of the catalyst MnT–IE obtained from the spectra shown in Fig. 7; spectrum RT corresponds to spectrum (b) in Fig. 7.
spectrum at 1280 cm−1(see Fig. 8, spectrum 573 K–473 K). After heating at 573 K, the bands characteristic of the ad-sorbed hydrocarbon appear with strongly reduced intensi-ties and the band at 1575 cm−1is not observed. Under these conditions, new bands at 1630, 1540, and 1365 cm−1are de-tected. This indicates that the absorption at 1575 cm−1 is associated with nitrate species.
Figure 8 shows the spectra obtained by subtraction of the spectrum detected after the preceding thermal treatment from the spectrum taken after heating at a given tempera-ture. The spectra contain strong negative bands, indicating simultaneous decrease in the surface concentrations of the hydrocarbon and the nitrate species. The following impor-tant observations should be noted.
1. The reactivity of the surface nitrates depends on the temperature (Fig. 8A). After heating at 373 K the bridged nitrates (1625 and 1233 cm−1) are altered to a larger extent than the monodentate nitrates (1550 and 1270 cm−1 and 1512 and 1318 cm−1). This means that the former species are the most reactive. At 473 K mainly the monodentate nitrates (1505 and 1300 cm−1) are involved in the interac-tion with the hydrocarbon. The bidentate nitrates giving rise to the bands at 1580 and 1280 cm−1possess the lowest reactivity—they disappear after heating at 573 K.
2. In the 2800–2100 cm−1region, the bands at 2380 and 2345 cm−1 detected after heating at 373 K (Fig. 8B, spec-trum 373 K–273 K) are due to adsorbed CO2 (14). The bands at 2740 and at 2560–2500 cm−1are typical of formate ions adsorbed on the MnT–IE catalyst (14) and are due to
Fermi resonance between theν(CH) fundamental and com-binations or overtones of bands in the carboxylate region. The spectrum in the OH region (Fig. 8, spectrum 373K– RT) contains the positive band at 3600 cm−1. Based on the data in Ref. (14), the band at 3600 cm−1 is assigned
to ν(OH) stretching modes of adsorbed formic acid. The
ν(C==O) stretching frequency is positioned at 1666 cm−1
and is partially masked by the strong negative band at 1625 cm−1. After heating at 473 K, the bands at 3600, 2740, 2560–2500, and 1666 cm−1decrease in intensity (neg-ative bands at the corresponding positions in the spectrum 473 K–373 K, Fig. 8B). These experimental facts suggest that the formic acid produced during the oxidation of the hydrocarbon by the surface nitrates undergoes decompo-sition or further interaction with the nitrate species. The weak band at 3277 cm−1has been observed previously on CO adsorption (14) with much stronger intensity and has been attributed to H-bonded OH groups arising from inter-action of the formate species with the isolated OH groups of the catalyst. The alteration of the corresponding surface hy-droxyls cannot be observed because the expected negative bands overlap with the negative band at 3600 cm−1. Increase in the temperature to 573 K (Fig. 8, spectrum 573 K–473 K) causes involvement of the least reactive surface nitrates in the interaction with the hydrocarbon. Positive bands proba-bly due to adsorbed water [3660 (νas(OH)), 3400 (νs(OH)), and 1640 cm−1 (δ(H2O))] and carbonate species at 1530 and 1365 cm−1 (splitν3 mode (27)) are observed. Homo-geneous interaction between the hydrocarbon and NO2 (which could arise from thermal decomposition of the
nitrates) should be excluded because the interaction of de-cane and NO+ O2, respectively NO2 in the gas phase, oc-curs at about 673–713 K (28). The facts reported present evidence that the adsorbed decane is oxidized by the sur-face nitrate species.
3. The weak band at 2283 cm−1, which decreases in in-tensity with increases in reaction temperature (Fig. 8B, spectra (373 K–RT) and (473 K–373 K)), is attributed to isocyanate, NCO−, species. The literature data (26) on organic isocyanates show that theνas(N==C==O) band normally occurs in the range 2290–2255 cm−1. In the com-plex [Mn(NCO)4]2−the isocyanate group is characterized by a band at 2222 cm−1(16). In the case of oxide surfaces, the NCO− species absorb in the 2300–2180 cm−1 region (13). To the best of our knowledge, no data are available for surface NCO−species coordinated to manganese or ti-tanium ions. It is possible that the band at 2283 cm−1is due to organic isocyanate.
MnT–I
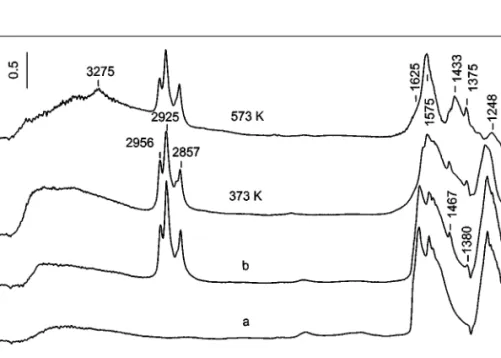
The reactivity of nitrate species toward the hydrocarbon is followed by an identical experiment, described above. The results are shown in Fig. 9. As in the case of the ion-exchanged sample, the concentration of the surface nitrates and that of the adsorbed hydrocarbon decrease with an in-crease in temperature. A noticeable difference is that com-pared to the MnT–IE catalyst, the relative changes in the intensities of the bands in the 3000–2800 cm−1region due to
FIG. 9. FTIR spectra of the catalyst MnT–I taken after adsorption of NO/O2mixture (40 Torr, NO : O2= 1 : 4) at room temperature followed by evacuation for 10 min (a), after adsorption of decane (0.6 Torr) on the NOxprecovered catalyst followed by evacuation for 10 min at room temperature
(b), and after heating the closed IR cell for 10 min at the indicated temperatures.
the adsorbed decane are considerably lower for the MnT–I catalyst. The reason for this could be the lower concentra-tion of the reactive surface nitrates on the latter sample.
The behavior of the absorption bands (consumed and produced) in the whole region is similar to that already observed for the MnT–IE catalyst, which is illustrated by the subtraction spectra (Fig. 10). The sequence in the in-teraction of the surface nitrates with decane after heating at 373 K is similar to that observed for the ion-exchanged sample. Bands (Fig. 10A, spectrum 373 K–RT) typical of adsorbed formic acid (14) are detected on the MnT–I cata-lyst: 3625 (ν(OH)), 3394 (hydrogen bonded hydroxyls), and 1680 cm−1 (ν(C==O)). Heating at 573 K (Fig. 10A, spec-trum 573 K–373 K) causes disappearance of the formic acid (negative bands at 3625 and 1690 cm−1) and additional ox-idation of the hydrocarbon (small decrease in the inten-sity of the decane bands). New bands at 3275, 1588, 1426, and 1375 cm−1are detected together with an absorption in the 2800–2500 cm−1 region (Fig. 10B). The latter is char-acteristic of formate species. Most probably, the formate species are produced during room-temperature interaction of small amounts of CO (formed as a product of incomplete oxidation of the hydrocarbon or by decomposition of the formic acid) with the catalyst surface, according to the pro-cess described earlier (14). The presence of formate species contributes to the absorption at 1588 and 1375 cm−1. The group of bands at 1588, 1426, and 1375 cm−1 can be at-tributed to theνas(CO−2), νs(CO−2), and δs(CH3) modes of acetate species, respectively (29). The origin of the sharp
490 MARGARITA KANTCHEVA
FIG. 10. FTIR subtraction spectra of the catalyst MnT–I obtained from the spectra shown in Fig. 9; spectrum RT corresponds to spectrum (b) in Fig. 9.
band at 3275 cm−1 has been explained above. There is a noticeable difference in the reactivity of the surface nitrates formed on the ion-exchanged and impregnated catalysts. Contrary to the ion-exchanged sample, the concentration of the surface nitrates on the catalyst MnT–I characterized by the bands at 1575 and 1248 cm−1does not change after the treatment at 573 K (compare Figs. 8A and 10A). It can be concluded that the corresponding absorption bands belong to bidentate nitrates coordinated to the titanium(IV) site.
As in the case of the ion-exchanged sample, the band at 2284 cm−1 is associated with NCO− species. Here again, the intensity of this band decreases with an increase in temperature.
TiO2
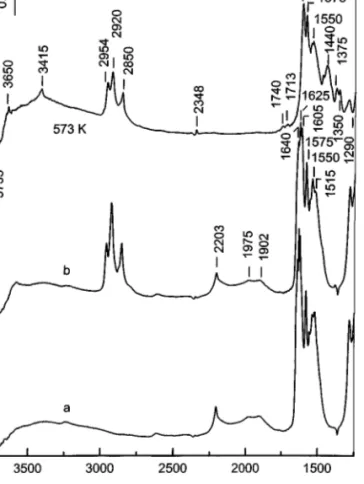
The reactivity of NOx species on titania is considerably lower than that for the MnT–IE catalyst and is comparable to that of the impregnated sample. This conclusion is made from the relative changes in the intensities of the bands of the adsorbed hydrocarbon in theν(CH) stretching re-gion (Figs. 7, 9, and 11). As illustrated by the subtraction spectrum in Fig. 12A, after heating at 573 K the concentra-tion of the bridged (1636, 1625, and 1275 cm−1) and the monodentate nitrates associated with the band at 1530– 1517 cm−1 on the surface of titania decreases simultane-ously with that of the adsorbed hydrocarbon. The negative bands at 2200 cm−1and at 1972 and 1902 cm−1indicate that a transformation of the NO+ion and the nitrosyl species co-ordinated to titanium(IV) sites during interaction with the decane takes place. The positive bands at 2740–2600 cm−1
and about 2575 and 2480 cm−1 (Fig. 12B) reveal the pres-ence of formate moieties, and the absorption at 3650 and 3415 cm−1 together with the bands at 1740 and 1712 cm−1 (Fig. 12A) are attributed to undissociated formic acid (14). The sharp band at 2348 cm−1 is due to adsorbed CO2 (Fig. 12B). No bands which can be assigned to NCO− species coordinated to titanium(IV) cations are detected. In the low-frequency region (Fig. 12A), new bands at 1430 and 1358 cm−1 are formed, which are assigned to surface carbonates. The formation of adsorbed formic acid, CO2, and carbonate species indicates that the bridged and mon-odentate nitrates coordinated to the titania surface are able to oxidize the adsorbed decane. Since the bands at 1605, 1575, and 1550 cm−1, which correspond to bidentate nitrates (Fig. 11), do not appear as negative bands in the subtraction spectrum in Fig. 12, the latter species do not interact with the hydrocarbon. This confirms the conclusion made above that the unreactive nitrate species observed on the MnT– I catalysts and characterized by the band at 1575 cm−1 is associated with the support.
Interaction of the Adsorbed Decane with the Surfaces
of MnT–IE Catalyst and TiO2
The spectrum of adsorbed decane (0.6 Torr, followed by a 15-min evacuation at room temperature) on the MnT–IE catalyst is shown in Fig. 13. The absorption in the 3670– 3500 cm−1region and the weak band at 1610 cm−1are asso-ciated with small amounts of water contained in the hydro-carbon. The heating of the closed IR cell at 398 K for 10 min leads to a decrease in the intensities of the absorption bands,
FIG. 11. FTIR spectra of the sample TiO2 taken after adsorption of NO/O2mixture (40 Torr, NO : O2 = 1 : 4) at room temperature fol-lowed by evacuation for 10 min (a), after adsorption of decane (0.6 Torr) on the NOx precovered surface followed by evacuation for 10 min at
room temperature (b), and after heating the closed IR cell for 10 min at 573 K.
corresponding to the adsorbed hydrocarbon and the ap-pearance of a weak band at 1685 cm−1which falls in the car-boxylate region (26, 27). This combined with the fact that there is an enhancement in the absorption in theν(OH) stretching region (absorption band at 3590 cm−1) leads to the conclusion that under these conditions, partial ox-idation of the adsorbed decane to carboxylic acid(s) has occurred. The spectrum taken after 10 min of heating at 483 K contains a sharp band at 1578 cm−1 and the ab-sorption at 1685 cm−1 is no longer present. The former band is attributed to the νas(CO−2) mode of acetate ion (29). There are no changes in the intensities of the bands in the ν(CH) stretching region, which indicates that un-der these conditions, only dissociation of the carboxylic acid (probably CH3COOH) has occurred, leading to for-mation of acetate ions. The prominent band at 3275 cm−1 is due to H-bonding between surface OH groups and car-bonate/carboxylate structures (14). After the treatment at 573 K, additional decrease in the intensities of the bands in the ν(CH) stretching region is observed. In the low-frequency region, two new bands at 1530 and 1343 cm−1
are detected, which can be attributed to carbonate species. It seems that under these conditions, the predominant pro-cess is the decomposition of the acetate species to carbon-ates and water (absorption bands at 3645, 3420, and about 1620 cm−1) and probably no further oxidation of the hy-drocarbon takes place. Since the experiment is performed under anaerobic conditions, the observed oxidation of the hydrocarbon after the heating at 398 K is caused by surface oxide ions coordinated to the manganese(III) sites.
It should be pointed out that the same experiment with pure titania did not cause any considerable changes in the intensities of the bands due to the adsorbed hydrocarbon, and no oxidized hydrocarbon products were detected.
Summary of the Results on the Reactivity of the Adsorbed Nitrate Species
The data reported show that the activated MnT–IE cata-lyst possesses some activity for oxidation of the adsorbed decane. However, after modification of the catalyst surface by adsorbed NO−3 species, the oxidation of the adsorbed hydrocarbon in the absence of gaseous oxygen is almost complete. This experimental fact demonstrates the role of surface nitrate species (obtained by NO/O2coadsorption) as key intermediates in the reduction of NO by decane. This conclusion is in agreement with the results of some recent reports (12, 30–39) on the importance of various surface NOxspecies(x > 1) in the SCR process.
During interaction of the adsorbed hydrocarbon with the nitrate species coordinated on the surface of manganese-containing catalysts and the support, various oxidized hy-drocarbon compounds (formic acid, formate and acetate species, NCO−), CO2, and carbonates are detected. The fact that formation of oxidized hydrocarbons is observed on the NO−3 precovered TiO2 and that there is no oxida-tion of the decane in the absence of adsorbed NO−3 species suggests that the bridged and monodentate nitrates inter-act directly with the hydrocarbon. These species are the most reactive ones in the case of manganese-containing cat-alysts and are able to oxidize the hydrocarbon at 373 K to formic acid and isocyanate ions. The bidentate nitrates on ti-tania show no reactivity toward the adsorbed hydrocarbon. However, the presence of manganese(III) cations (MnT– IE catalyst) promotes the reactivity of the bidentate NO−3 species, and their participation in the process starts at 473 K (Fig. 8). This means that the reactivity of surface nitrates depends not only on the mode of their coordination but also on the nature of the surface site(s). The catalyst MnT–IE does not contain exposed (cus) titanium(IV) cations de-tectable by room-temperature adsorption of CO (14) and NO (this paper). It can be concluded that the high reactivity of the surface nitrates on this catalyst is associated with the formation of Mn3+−NO−
3 species on NO/O2coadsorption and the absence of nitrates coordinated to titanium(IV) cations.
492 MARGARITA KANTCHEVA
FIG. 12. FTIR spectrum of the sample TiO2obtained by subtracting from spectrum (b) the spectrum (573 K) shown in Fig. 11.
The fact that there is a continuous decrease in the concen-tration of surface nitrates with an increase in temperature and that no other adsorbed NOxspecies (e.g., nitrosyls) are detected in the spectra of manganese catalysts and the sup-port taken after the NO−3–C10H22 interaction can be used as evidence that the nitrates are reduced to dinitrogen. The reaction path for the latter process has to include the pairing of nitrogen atoms. The subsequent step(s) of this process is(are) not clear. It has been suggested that the reduction of NO on oxide catalysts occurs through various species such as NCO−, CN−, R–NH2, and NH3(12, 33–36, 39–42). Our experimental results show formation of NCO−species on the surface of the catalysts studied. The concentration of the NCO− species decreases with increase in tempera-ture simultaneously with that of the nitrate species. This indicates that the NCO− species interact further and can be considered as possible intermediates in the dinitrogen formation.
The above results are summarized in Scheme 1, which shows the possible pathways of interaction between the
SCHEME 1
surface nitrates and adsorbed decane on the manganese– titania catalysts.
The reaction begins with partial oxidation of the hydro-carbon by the bridged and monodentate nitrates to formic acid, formate species, and isocyanates. The latter species can be produced also in the reduction of nitrates by formate ions. Shimizu et al. (30, 33) have shown that partially oxi-dized hydrocarbon compounds on the surface of alumina-based catalyst (e.g., acetate species) react preferentially with NO+ O2and proposed that this is an important step in the SCR of NO by various hydrocarbons (31–34). The cou-pling of the NCO−species with the nitrates leads to dinitro-gen formation. This reaction step is in agreement with the conclusion made by Shimizu et al. (32–34) that the NCO− species are the final intermediates in the SCR of NO by hydrocarbons, leading to N2formation by interaction with surface nitrates.
The reaction pathway proposed assumes that the NO−3 species participate in at least three different reaction steps. This means that a good DeNOx catalyst should contain a high concentration of reactive NOxspecies able to oxidize the hydrocarbon, the partially oxidized hydrocarbon com-pounds, and the NCO−intermediate. This can explain the considerably lower conversion of adsorbed hydrocarbon on the MnT–I sample in the 373–573 K temperature range com-pared to that for the ion-exchanged catalyst. The loading of MnT–IE catalyst corresponds to a monolayer, ensuring better dispersion of the manganese ions (14), and unreac-tive NO−3 species coordinated to the titanium(IV) cations
FIG.13 FTIR spectra of the MnT–IE catalyst taken after adsorption of decane (0.6 Torr) at room temperature followed by evacuation for 10 min (RT), and after heating the closed IR cell for 10 min at the in-dicated temperatures.
are not formed. This catalyst is promising for the selective catalytic reduction of NO by longer chain saturated hydro-carbons.
CONCLUSIONS
1. The nature of the NOx species obtained on NO ad-sorption and its coadad-sorption with O2 at room tempera-ture, their stability, and the mechanisms of their forma-tion on TiO2and MnOx/TiO2catalysts have been studied. The adsorption of NO on the support and the catalysts leads to disproportionation of NO to anionic nitrosyl, NO−, its protonated form, NOH, and NO2. On coadsorption of NO and O2at room temperature, various kinds of surface nitrates are observed differing in the mode of their co-ordination. No anionic nitrosyls are present. The nitrates on the manganese-containing samples are characterized by significantly lower thermal stability than those on the pure support, titania.
2. The difference in the thermal stability of the nitrates parallels their reactivity toward the reducer (decane). The monodentate and bridged nitrates formed on the man-ganese catalysts studied are able to oxidize the adsorbed
hydrocarbon at temperatures as low as 373 K and are im-portant intermediates in the SCR of NO by hydrocarbons. 3. Formic acid, formate and acetate species, carbonates, and adsorbed CO2 are identified as products of the inter-action of the nitrates with the adsorbed decane. Formation of isocyanate species on the surface of manganese–titania catalysts is detected. It is proposed that the surface nitrates and NCO− species react, leading to production of N2and CO2.
4. The concentration of the reactive surface nitrates on the MnOx/TiO2catalyst with manganese content corre-sponding to a monolayer is considerably greater than that on the sample with higher manganese loading. The former catalyst is promising for the SCR of NO by longer chain saturated hydrocarbons.
ACKNOWLEDGMENTS
This work was financially supported by the Scientific and Technical Re-search Council of Turkey (T ¨UBITAK), project TBAG-1706, and Bilkent University, Research Development Grants for 2000 and 2001. The author thanks Mr. M. U. K ¨uc ¨ukkal for his help in performing the experiments.
REFERENCES
1. Yanxin, C., Yi, J., Wenzhao, L., Rongchao, J., Shaozhen, T., and Wenbin, H., Catal. Today 50, 39 (1999).
2. Matsuda, S., Kato, A., Mori, T., Kumagai, T., Hishinuma, Y., Akimoto, H., and Nakajima, F., U.S. Patent 4350670 (1982).
3. Blanco, J., Odenbrand, C. U. I., Avila, P., and Knapp, C., Catal. Today
45, 103 (1998).
4. Singoredjo, L., Corver, R., Kapteijn, F., and Moulijn, J. A., Appl. Catal.
B 1, 297 (1992).
5. Kapteijn, F., Singoredjo, L., Dekker, N. J. J., and Moulijn, J. A.,
Ind. Eng. Chem. Res. 32, 445 (1993).
6. Bosch, H., and Janssen, F., Catal. Today 2, 369 (1988).
7. Grzybek, T., Pasel, J., and Papp, H., Phys. Chem. Chem. Phys. 1, 341 (1999).
8. Li, Y., and Armor, J. N., Appl. Catal. B 3, L1 (1993)
9. Kapteijn, F., Singoredjo, L., van Driel, M., Andreini, A., Moulijn, J. A., Ramis, G., and Busca, G., J. Catal. 150, 105 (1994).
10. Kijlstra, W. S., Brands, D. S., Poels, E. K., and Bliek, A., J. Catal. 171, 208 (1997).
11. Kijlstra, W. S., Brands, D. S., Smit, H. I., D. S., Poels, E. K., and Bliek, A., J. Catal. 171, 219 (1997).
12. Aylor, A. W., Lobree, L. J., Reimer, J. A., and Bell, A. T., J. Catal. 170, 390 (1997).
13. Hadjiivanov, K. I., Catal. Rev.–Sci. Eng. 71 (2000).
14. Kantcheva, M., Kucukkal, M. U., and Suzer, S., J. Catal. 190, 144 (2000).
15. Hadjiivanov, K., Bushev, V., Kantcheva, M., and Klissurski, D.,
Langmiur 10, 464 (1994).
16. Laane, J., and Ohlsen, J. R., Prog. Inorg. Chem. 28, 465 (1986). 17. Nakamoto, K., “Infrared and Raman Spectra of Inorganic and
Coordination Compounds, Part B: Applications in Coordination, Organometallic, and Bioinorganic Chemistry,” Wiley, New York, 1997.
18. Hadjiivanov, K., and Kn ¨ozinger, H., Phys. Chem. Chem. Phys. 2, 2803 (2000).
19. Cerruti, L., Modone, E., Guglielminotti, E., and Borello, E., J. Chem.
494 MARGARITA KANTCHEVA 20. Low, M. J. D., and Yang, R. T., J. Catal. 34, 479 (1974).
21. Martinez-Arias, A., Soria, J., Conesa, J. S., Seoane, X. L., Arcoya, A., and Cataluna, R., J. Chem. Soc. Faraday Trans. 91, 1679 (1995). 22. Klingenberg, B., and Vannice, M. A., Appl. Catal. B 21, 19
(1999).
23. Huang, S. J., Walters, A. B., and Vannice, M. A., J. Catal. 192, 29 (2000).
24. Kantcheva, M., Bushev, V., and Hadjiivanov, K., J. Chem. Soc. Faraday
Trans. 88, 3087 (1992).
25. Hadjiivanov, K., Saur, O., Lamotte, J., and Lavalley, J. C., Z. Phys.
Chem. 187, 281 (1994).
26. Holly, S., and Sohar, P., in “Absorption Spectra in the Infrared Re-gion” (L. Lang and W. H. Prichard, Eds.), p. 123. Akademiai Kiado, Budapest, 1975.
27. Busca, G., and Lorenzelli, V., Mater. Chem. 7, 89 (1982). 28. Cheung, C. C., and Kung, M. C., Catal. Lett. 61, 131 (1999).
29. Finocchio, E., Busca, G., Lorenzelli, V., and Escribano, V. S., J. Chem.
Soc. Faraday Trans. 92, 1587 (1996).
30. Shimizu, K., Kawabata, H., Satsuma, A., and Hattori, T., Appl. Catal.
B 19, L87 (1998).
31. Shimizu, K., Kawabata, H., Satsuma, A., and Hattori, T., J. Phys. Chem.
B 103, 5240 (1999).
32. Shimizu, K., Kawabata, H., Maeshima, H., Satsuma, A., and Hattori, T., J. Phys. Chem. B 104, 2885 (2000).
33. Shimizu, K., Shibata, J., Yoshida, H., Satsuma, A., and Hattori, T.,
Appl. Catal. B 30, 151 (2001).
34. Shimizu, K., Shibata, J., Satsuma, A., and Hattori, T., Phys. Chem.
Chem. Phys. 3, L87 (2001).
35. Meunier, F. C., Zuzaniuk, V., Breen, J. P., Olsson, M., and Ross, J. R. H., Catal. Today 59, 287 (2000).
36. Bamwenda, G., Ogata, A., Obuchi, A., Oi, J., Mizuno, K., and Skrzypek, J., Appl. Catal. B 6, 311 (1995).
37. Adelman, B. J., Beutel, T., Lei, G. D., and Sachtler, W. M. H., J. Catal.
158, 327 (1996).
38. Hadjiivanov, K., Klissurski, D., Ramis, G., and Busca, G., Appl. Catal.
B 7, 251 (1996).
39. Hadjiivanov, K., Tsyntsarski, B., and Nikolova, T., Phys. Chem. Chem.
Phys. 1, 4521 (1999).
40. Ukisu, Y., Sato, S., Muramatsu, G., and Yoshida, T., Catal. Lett. 11, 177 (1991).
41. Obuchi, A., W ¨ogerbauer, C., K ¨oppel, R., and Baiker, A., Appl. Catal.
B 19, 9 (1998).
42. Sumiya, S., He, H., Abe, A., Takezawa, N., and Yoshida, K., J. Chem.