TESTING WEAK FORM MARKET EFFICIENCY FOR EMERGING ECONOMIES: A NONLINEAR APPROACH
A THESIS SUBMITTED TO
THE GRADUATE SCHOOL OF SOCIAL SCIENCES OF
ÇANKAYA UNIVERSITY
BY
NAZLI CEYLAN OMAY
IN PARTIAL FULLFILLMENT OF THE REQUIREMENTS FOR
THE DEGREE OF MASTER OF SCIENCE IN
THE DEPARTMENT OF MANAGEMENT
Title of the Thesis: Testing Weak Form Market Efficiency for Emerging Economies: A Nonlinear Approach
Submitted by Nazlı Ceylan OMAY
Approval of the Graduate School of Social Sciences, Çankaya University.
Prof.Dr. Taner ALTUNOK Acting Director
I certify that this thesis satisfies all the requirements as a thesis for the degree of Master of Science.
Prof. Dr. Hasan IĢın DENER Head Of Department
This is to certify that we have read this thesis and that in our opinion it is fully adequate, in scope and quality, as a thesis for the degree of Master of Science.
Assist. Prof. Dr. Ece C. KARADAĞLI Supervisor
Examination Date : 28.06.2010
Examining Committee Members :
Prof. Dr. Hasan IĢın DENER (Çankaya University) ...
STATEMENT OF NON-PLAGIARISM PAGE
I hereby declare that all information in this document has been obtained and presented in accordance with academic rules and ethical conduct. I also declare that, as required by these rules and conduct, I have fully cited and referenced all material and results that are not original to this work.
Name, Last Name : Nazlı Ceylan OMAY Signature :
ABSTRACT
TESTING WEAK FORM MARKET EFFICIENCY FOR EMERGING ECONOMIES: A NONLINEAR APPROACH
OMAY, Nazlı Ceylan
M.Sc., Department of Management
Supervisor : Assist. Prof. Dr. Ece C. KARADAĞLI June 2010, 43 pages
In this paper we address weak form stock market efficiency of European Monetary Zone and Transition Economies, by testing whether the price series of these markets contain unit root. For this purpose we employ the nonlinear unit root test procedure recently developed by Kapetanios et al. (2003) and nonlinear panel unit root test Ucar and Omay (2009) that has a better power than standard unit root tests when series under consideration are characterised by a slower speed of mean reversion.
ÖZ
GELĠġMEKTE OLAN EKONOMĠLERĠN ZAYIF FORMDA PĠYASA ETKĠNLĠĞĠNĠN TEST EDĠLMESĠ : DOĞRUSAL OLMAYAN TEST
YAKLAġIMI
OMAY, Nazlı Ceylan
Yüksek Lisans, ĠĢletme Anabilim Dalı
Tez Yöneticisi : Yrd. Doç. Dr. Ece C. KARADAĞLI Haziran 2010, 43 sayfa
Bu çalıĢmada Avrupa para birliğindeki geçiĢ ekonomilerinin zayıf formda piyasa etkinliği birim kök testi kullanılarak test edilmiĢtir. Bu amaç için doğrusal birim kök testleri ve doğrusal olmayan birim kök testleri kullanılmıĢtır. Tek denklem için yeni önerilen Kapetanios et al. (2003) ve panel doğrusal olmayan birim kök testi için Ucar and Omay (2009) testleri kullanılmıĢtır. Bu testleri kullanmakta amacımız, doğrusal olmayan birim kök testlerinin doğrusal birim kök testlerine gore istatistiksel gücünün dha fazla olmasıdır. Bunun yanı sıra panel birim kök testleride tek denklem birim kök testlerine gore testing gücünü artırmaktadır.
Anahtar Kelimeler: Zayıf Form Piyasa etkinliği, Birim Kök, Doğrusal olmayan panel UO test.
ACKNOWLEDGEMENT
The author wishes to express his deepest gratitude to his supervisor Ass. Prof. Dr. Ece C. Karadağlı and co-supervisor Prof. Dr. Hasan IĢın Dener for their guidance, advice, criticism, encouragements and insight throughout the research.
The author would also like to thank Ass. Prof. Dr. Tolga Omay for his suggestions and comments.
The technical assistance of Mr. Ufuk Demir, Mr. Bahadır Çömlekçi and Ms. Melek Uzca are gratefully acknowledged.
TABLE OF CONTENTS
STATEMENT OF NON-PLAGIARISM PAGE ... iii
ABSTRACT ... iv
ÖZ ... v
ACKNOWLEDGEMENT ... vi
TABLE OF CONTENTS ... vii
LIST OF TABLES ... viii
LIST OF FIGURES ... ix
CHAPTERS : 1. INTRODUCTION ... 1
2. EFFICIENT MARKET HYPOTHESIS ... 6
2.1. Strong Form Efficient Market ... 13
2.2. Semi Strong Form Efficient Market ... 13
2.3. Weak Form Efficient Market ... 14
3. METHODOLOGY... 18
3.1. Linear Unit Root Test ... 19
3.2. Individual Nonlinear Unit Root Test ... 21
3.3. Linear Panel Unit Root Test ... 24
3.4. Nonlinear Panel Unit Root Test... 26
3.5. Data and Unit Root Test Results ... 31
4. CONCLUSIONS ... 37
REFERENCES ... 39
APPENDIX : A. CURRICULUM VITAE ... 43
LIST OF TABLES
Table 2.1. Summary of the link between... 11
Table 3.1. Description of stock price series ... 32
Table 3.2. Linear unit root test results ... 33
Table 3.3. Nonlinear unit root test results ... 34
Table 3.4. Linear and nonlinear panel unit root test results without cross section dependency ... 35
Table 3.5. Cross section dependency test ... 35
Table 3.6. Linear and nonlinear panel unit root test results with cross section dependency ... 36
LIST OF FIGURES
Figure 2.1. Reaction of Stock Price to New Information and Alternative Stock Market Reactions ... 9 Figure 2.2. A Venn Diagram of Three Levels of Information That Might be
Reflected in Stock Prices ... 12 Figure 2.3. Market Price and Efficient Market Hypothesis ... 13
CHAPTER 1
INTRODUCTION
The Efficient Market Hypothesis states that security prices fully reflect all available information and that the price fluctuations are unpredictable. Since the market absorbs all relevant information as it becomes available, stock prices should fluctuate as random white noise. The concept of market efficiency is mainly based on the reaction of stock price to new information which means a surprise because if it were to be predictable, then the market should have already compensated for it. Following the argument that the stock prices already incorporate all available information and the stock price changes require a news release which is itself unpredictable by definition, then price changes should be unpredictable and random. The hypothesis indicates that if price formation of a financial asset is random and the return from such a financial asset is unpredictable, then the market is informationally efficient and as Aguirre and Saidi (1998) argue, in such an efficient market it is impossible for an investor to gain excess returns through speculation, because prices do reflect all available information (Azad and Bashar 2010:3). Thus, in an efficient market, price changes can be argued to follow a “random walk”. Hence, the Efficient Market Hypothesis carries a close relation with the Random Walk Model. If stock prices follow a random walk which is satisfied by the unpredictability of stock returns, then stock prices are characterized by a unit root.
The concept of market efficiency which is central to finance, can be traced back to the beginning of the twentieth century. The idea that asset prices may follow a random walk pattern was introduced by Bachelier in 1900 in his dissertation (Mishra 2009: 31). Bachelier begins the mathematical modelling of stock price movements and formulates the principle that “the expectation of the speculator is zero” (Courtault et al. 2000: 343). As reviewed by Dimson and Mussavian (1998), Bachelier had concluded that commodity prices fluctuate randomly, and later studies by Working (1934) and Cowles and Jones (1937) were to show that US stock prices and other economic series also share these characteristics while Cowles (1933) found that there was no discernable evidence of any ability to outguess the market and subsequently, Cowles (1944) provided corroborative results for a large number of forecasts over a much longer sample period. By the 1940s, there was therefore scattered evidence in favour of the weak and strong form efficiency of the market, though these terms were not yet in use (Dimson and Mussavian 1998: 92).
Since the second half of the twentieth century, there had been a vast research on the topic and market efficiency still remains to be a central and controversial issue in finance1. Market efficiency has attracted a substantial interest of academicians (e.g., Fama, 1970, 1991; Lo and MacKinlay, 1988; Grieb and Reyes, 1999; Chaudhuri and Wu, 2003). Ross et al. (2001: 298) argues that although capital market history records controversy about market efficiency, the evidence seem to support that prices do appear to respond very rapidly to new information and the response is not grossly different from what we would expect in an efficient market, the future of market
1
A more detailed literature survey is provided (or the related literature survey is continued) in the second chapter.
prices, particularly in the short run, is very difficult to predict based on publicly available information, and if mispriced stocks do exist, than there is no obvious means of identifying them.
However, as argued by Malkiel (2003: 4), by the start of the twenty-first century, the intellectual dominance of the efficient market hypothesis had become far less universal and many financial economists and statisticians began to believe that stock prices are at least partially predictable.
The liberalization of financial markets and advances in technology coupled with lower costs of investing in international markets has created an increased demand for such transactions in emerging markets. As these markets become more integrated with global equity markets, they increasingly attract international investors hoping to benefit from abnormal high returns as well as portfolio risk diversification. The study of efficient markets hypothesis has some implications for understanding the price formation in capital markets, may prove to be a worthy weapon to develop trading strategies and to build a general idea of the investor’s behaviour of a market. Market Efficiency also has important implications for managerial decisions, especially those pertaining to common stock issues, stock repurchases, and tender offers (Brigham and Gapenski 1997: 321). Actually, as Seiler and Rom (1997: 49) discussed, market efficiency is directly or implicitly tested at any time a study is performed to identify stock price reactions to certain events such as dividend announcements (Bajaj and Vijh 1995, 1990), earnings announcements (Bamber 1987), stock splits (Copeland 1979), large block transactions (Holthausen et.al. 1987; Kraus and Stoll 1972),
announcements (Kim and Verrecchia 1991a; 1991b) while a more encompassing or macro evaluation of market efficiency can be made by testing whether or not the returns in a market follow a random walk process over a longer period of time.
Within the content of this thesis research topic, major European emerging markets are tested for weak form efficiency. The investigated markets are Bulgarian, Greek, Hungarian, Polish, Romanian, Russian Slovenian and Turkish markets. The data are monthly and sourced from Datastream. To test the weak form of market efficiency in these markets, stock prices in those markets are searched for whether they contain unit root. For this purpose we carried out conventional ADF and PP unit root tests as well as nonlinear unit root test recently proposed by Kapetanios et al. (2003).
The results of ADF and PP indicate that Bulgarian, Greek, Hungarian, Polish, Romanian, Russian, Slovenian and Turkish stock markets are weak form efficient, while the results of nonlinear unit root test implies that Russian, Romanian and Polish stock markets are not weak form efficient. Moreover, we apply linear and nonlinear panel unit root test to this group of countries. The linear panel unit root test suggest that this group as all efficient market where as nonlinear panel unit root test suggest as a group they are seem to be inefficient in the weak form sense. These results show that the markets in this region seem to be weak form efficient in linear sense, however, the true data generating is nonlinear and stationary hence we can conclude that the linear test gives spurious result of market efficiency.
The research undertaken in this thesis is believed to contribute to the controversy literature on the validity of weak form of efficiency in the emerging markets by
concentrating on the European emerging markets. Since, some of those markets are also among the so called transition markets, it also contributes to the relatively limited literature on the transition economies. Another important contribution of this research lies in the methodology employed. During the analysis, not only conventional ADF and PP unit root tests is used, but also nonlinear unit root test recently proposed by Kapetanios et al. (2003) is applied. Last but not least, linear and nonlinear panel unit root tests may also be argued to be another contribution of this research. By applying the panel version of the unit root test, we improve the power of the test. Hence, panel version of these tests gives us more vigorous result with respect to market efficiency.
The remaining of the study is organized as follows. In chapter 2 the theoretical background of Efficient Market Hypothesis is argued and the related literature is conveyed. In chapter 3 the test procedure is explained and estimation results are provided. Finally, section 4 concludes.
CHAPTER 2
EFFICIENT MARKET HYPOTHESIS
The term “efficient capital market” is used to describe a market in which stock prices reflect all relevant and available information. In this sense, a market is said to be efficient if stock prices adjust rapidly and correctly to new information. New information is just that: new, meaning a surprise, as anything that is not a surprise is predictable and should have been anticipated before the fact (Sharpe et.al. 1999: 95).
Efficient Market Hypothesis asserts that well-organized capital markets are efficient markets. This indicates stocks are always in equilibrium –that they are fairly priced in the sense that the price reflects all publicly available information on each security and it is impossible for an investor to consistently “beat the market” (Brigham 1995: 273). Hence, it can be thought that if a market is efficient, stocks in general are neither overvalued nor undervalued; that is they are fairly priced and in equilibrium. So, if this is the case, an investor can “beat the market” only by luck.
Actually, as the term “efficiency” may create some ambiguity, it is important to establish some clarity. Three are types of efficiency in capital markets: Operational Efficiency, Allocational Efficiency and Informational Efficiency.
Operational Efficiency requires the transaction costs to be low which may be promoted by the competitiveness of financial markets and intermediaries.
Allocational efficiency stems from the fact that funds should be effectively allocated to most productive investments and stock markets provide a mechanism to channel the scarce resources among competing real investments. Hence, it refers to the optimal allocation of the scarce resources.
The informational efficiency (or as sometimes referred: the pricing efficiency) assumes that the price of any stock at a particular point in time reflects all the information pertaining to itself, so using these information will provide no superior returns to investors. That is, in a pricing efficient market the investor can expect to earn merely a risk adjusted return from an investment as prices move instantaneously and in an unbiased manner to any news, thus the term efficient market hypothesis applies to this form of efficiency only (Arnold 2001: 606).
A major proposition of the Efficient Market Hypothesis is that no investor can earn abnormal profits by the use of available information as the prices already incorporate all available information. In other words, the Efficient Market Hypothesis states that stock prices fully reflect all available information and that the stock price fluctuations are unpredictable.
Unpredictability of returns requires that stock prices change in a random fashion. Randomness in security returns is a characteristic of an efficient market: that is, a
market in which security prices fully reflect information immediately” (Sharpe et.al. 1999).
Market efficiency does not claim that stock prices are always correct, but it argues that any mispricing does not arise due to any kind of systematic or predictable source. As, in an efficient market, price changes do not have any systematic correlation, they can be argued to follow a “random walk”.
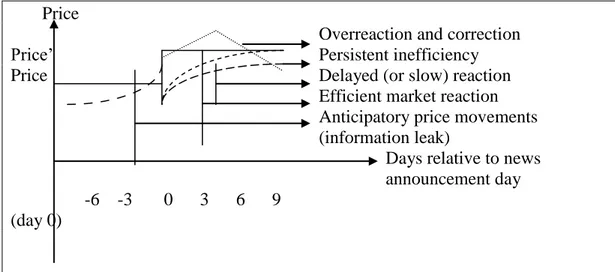
The efficient market hypothesis is associated with the idea of random walk which is a term used to characterize a price series where all subsequent price changes represent random departures from previous prices, and the logic behind the idea is that if the flow of information is unimpeded and information is immediately reflected in stock prices, then tomorrow’s price change will reflect only tomorrow’s news which is unpredictable by definition, and will be independent of the price changes today, that is resulting price changes must be unpredictable and random (Malkiel 2003: 3). It is possible to visualize the aforementioned arguments as presented by Figure 2.1:
Price
Overreaction and correction
Price’ Persistent inefficiency
Price Delayed (or slow) reaction Efficient market reaction Anticipatory price movements (information leak)
Days relative to news
announcement day
-6 -3 0 3 6 9 (day 0)
Not: Adopted from Arnold 2002: 603 and Ross et al. 2001: 295
Figure 2.1. Reaction of Stock Price to New Information and Alternative Stock Market Reactions.
As the concept of market efficiency is mainly based on the reaction of stock price to new information, solid line in the figure illustrate the behaviour of stock prices in an efficient market since the price fully reflects and immediately adjusts to new information release with no tendency for subsequent adjustments. On the other hand, if the efficiency assumption is relaxed, there are four other possibilities. First of all, the market may fail to price the information correctly and shares may continue to be underpriced for a considerable period as the long dashed line indicates. Second, the market may overreact to the new information and the bubble deflates over the following days as shown by the dotted line. A third possibility may arise due to some leaks to the press or some hints dropped by the company management to market analysts about the news prior to the announcement as represented by the long dash dotted line. Finally, some time may be needed for the market to absorb the new information as the dashed line suggests. All these possibilities carry, at least, some
line), the strategy of buying the stock immediately following the release of new information and then selling the stock after the market fully absorbs the information would be a positive net present value investment. But all investments in an efficient market are zero net present value investments because if prices are neither too low nor too high, then the difference between the market value of an investment and its cost is zero; hence, the net present value is zero (Ross et.al. 2001: 298). That is, in an efficient market investors should expect to make only normal profits by earning a normal rate of return on their investments, and hence an efficient market, defined as one in which every security’s price equals its investment value at all times, will exist (Sharpe et.al. 1999: 93).
On the other hand, the preceding arguments mainly apply if the markets are perfectly efficient. But, traditionally, economists distinguished three levels of market efficiency based on what is meant by “available information”: the weak form of market efficiency, the semi-strong form of market efficiency and the strong form of market efficiency.
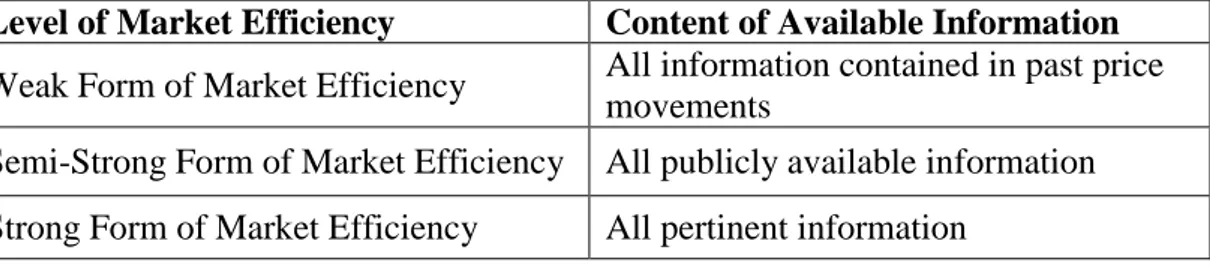
The weak form of Efficient Market Hypothesis states that share prices fully reflect all information contained in past price movements. The semi strong form of Efficient Market Hypothesis states that share prices fully reflect all the relevant publicly available information while the strong form of Efficient Market Hypothesis states that all relevant, including that which is privately held, is reflected in the share price. Table 2.1 provides a summary of the link between the content of the available information and the level of market efficiency.
Table 2.1. Summary of the link between
Level of Market Efficiency Content of Available Information Weak Form of Market Efficiency All information contained in past price
movements
Semi-Strong Form of Market Efficiency All publicly available information Strong Form of Market Efficiency All pertinent information
Based on this distinction, it is possible to derive an equivalent definition of an efficient market:
“A market is efficient with respect to a particular set of information if it is impossible to make abnormal profits (other than by chance) by using this set of information to formulate buying and selling decisions” (Sharpe et.al. 1999: 93).
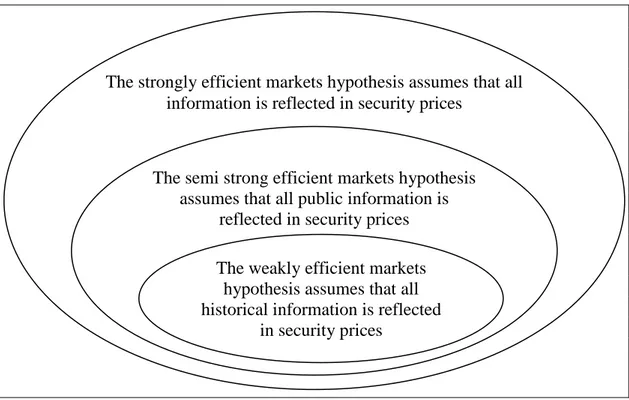
It could also be easily noticed from Table 2.1 that as the market efficiencies gets stronger, the set of information expands. That is if a market is efficient in semi strong form, then it is also weak form efficient and if a market is efficient in strong form, then it is also semi strong and weak form efficient. Available information and the levels of market efficiency are illustrated with the use of a Venn diagram in Figure 2.2.
Not: Francis 1991: 544
Figure 2.2. A Venn Diagram of Three Levels of Information That Might be Reflected in Stock Prices.
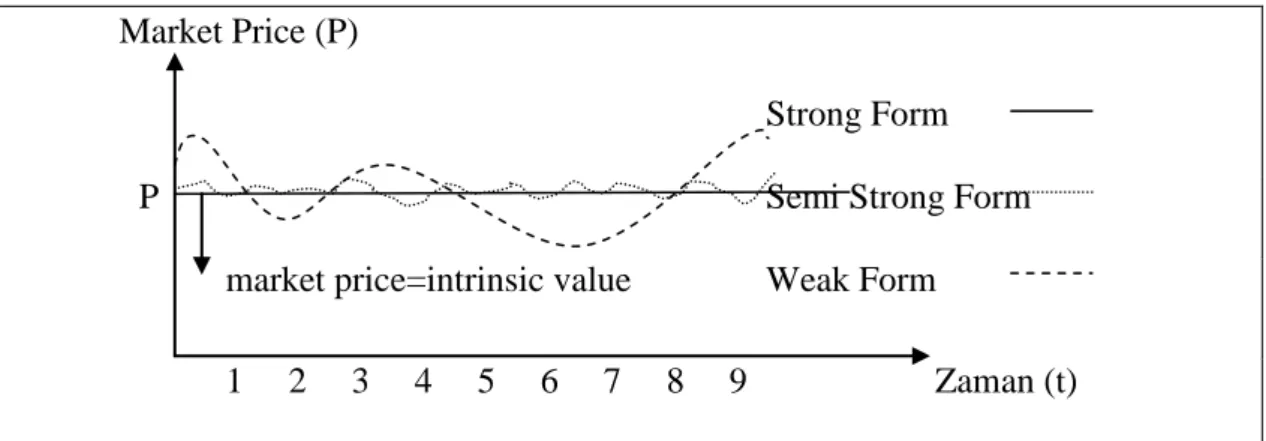
Following the above definitions of the three forms of market efficiencies, it can be argued that the market price of a stock will be equal to its intrinsic value in strong form efficient market and may deviate to some degree in semi strong form efficient markets while this deviation may get wider in a weak form efficient market. This relationship between the market price and the intrinsic value of a stock for each of the three forms of market efficiency degrees is depicted in the below figure.
The strongly efficient markets hypothesis assumes that all information is reflected in security prices
The semi strong efficient markets hypothesis assumes that all public information is
reflected in security prices
The weakly efficient markets hypothesis assumes that all historical information is reflected
Market Price (P)
Strong Form
P Semi Strong Form
market price=intrinsic value Weak Form
1 2 3 4 5 6 7 8 9 Zaman (t)
Figure 2.3. Market Price and Efficient Market Hypothesis.
2.1. Strong Form Efficient Market
As the strong form market efficiency requires that all the relevant information of any kind, public or private, has already been absorbed by the market, there is no way (except luck) of earning excess returns. So, if a market is in strong form efficiency even the excess to inside information will not work to produce superior returns.
As being the most strong form of efficiency and carrying extremely strict assumptions, it is almost impossible to imagine a market at this efficiency level. Not surprisingly, neither the initial researches nor the later ones seem to be supportive for the strong form of Efficient Market Hypothesis.
2.2. Semi Strong Form Efficient Market
If a market is semi strong form efficient, then all the publicly available information should already been reflected to the stock prices. Available information here covers
such as the financial reports, earnings and dividend announcements, technological breakthroughs, resignation or designation of directors, rights issues, and so on. If a market is semi strong form efficient, then no information after it has been released will provide any advantage, as the market has already priced it. As mentioned before, news in this content, means a surprise, that is something other than expected. So, the market will respond only if the information is different than what had been expected. An important implication of semi strong form of efficiency is that, the popular technical analysis and fundamental analysis will not work to beat the market. The investors can only make abnormal profits (other than by chance) if they have access to inside information.
2.3. Weak Form Efficient Market
In a weak form efficient market, all information contained in historical price movements is fully incorporated into the current stock prices. This means that tomorrow’s price will be independent of the past price movements. This fact is commonly reflected by the notion: “markets do not have memory”. Thus, studying the price trends will be pointless because the future price can not be predicted this way. In other words, technical analysis will not provide any advantage to the investor.
As argued by Magnusson and Wydick (2002: 143), though no stock market is generally believed to be strong form efficient, most early tests of stock markets in industrialized countries have typically been unable to reject the null hypothesis of semi strong and weak form of efficiency (Fama 1970). Some important later work
such as French and Roll (1986), Lo and MacKinlay (1988), however, has cast some degree of doubt over these initial findings (Magnusson and Wydick 2002: 155).
In recent years, although, predictability and efficiency of emerging markets have attracted interest of financial economists (e.g., Emerson et al., 1997; Dockery and Vergari, 1997; Liu et al., 1997; Zalewska-Mitura and Hall, 1999; Rockinger and Urga, 2001; Harrison and Paton, 2004; Cajueiro and Tabak, 2006), no consensus on whether or not efficient market hypothesis holds for these markets is attained yet. A common feature of these studies is that possible nonlinearities in conditional mean of the series have not been taken into account in testing efficiency of these markets. However, it is well known that many economic and financial time series follow nonlinear processes (e.g., Granger and Teräsvirta, 1993; Franses and van Dijk, 2000). Therefore, possible nonlinearities in data generating process should explicitly be taken into account in analysing financial time series in order to avoid spurious results.
The economic theory suggests a number of sources of nonlinearity in the financial data. One of the most frequently citied reasons of nonlinear adjustment is presence of market frictions and transaction costs. Existence of bid-ask spread, short selling and borrowing constraint and other transaction costs render arbitrage unprofitable for small deviations from the fundamental equilibrium. Subsequent reversion to the equilibrium, therefore, takes place only when the deviations from the equilibrium price are large, and thus arbitrage activities are profitable. Consequently, the dynamic behaviour of returns will differ according to the size of the deviation from
dynamics for returns of differing size (e.g., Dumas, 1992; Shleifer, 2000). In addition to transaction costs and market frictions, interaction of heterogeneous agents (e.g., Hong and Stein, 1999; Shleifer, 2000), diversity in agents’ beliefs (e.g., Brock and Hommes, 1998) also may lead to persistent deviations from the fundamental equilibrium.
Recent developments in nonlinear time series analysis allow modelling financial time series more appropriately (e.g., Granger and Teräsvirta, 1993; Franses and van Dijk, 2000). If dynamics of the market differ according to the size of deviations from equilibrium as the economic theory suggests, then such nonlinearities are more aptly modelled by an exponential smooth transition autoregressive (ESTAR) model, a class of smooth transition autoregressive (STAR) models popularised by Granger and Teräsvirta (1993) and Teräsvirta (1994). ESTAR models have extensively been used in empirical literature to test nonlinear mean reversion of financial time series, mainly for testing purchasing power parity (see, inter alia, Michael et al., 1997; Taylor and Peel, 2000; Taylor et. al, 2001; Gallagher and Taylor, 2001). For example Hasanov and Omay (2008) have shown that the predictability of Greek and Turkish stock markets is increasing when these markets are modeled by a nonlinear model. This result is a confirmation of weak form inefficiencies for these markets which verifies our results in this thesis. Recently, Kapetanios et al. (2003) have developed a unit root test procedure in an ESTAR framework, which has a better power than conventional Dickey-Fuller test. In this paper we apply Kapetanios et al. (2003) nonlinear unit root test to eight transition markets, namely, Bulgarian, Greek, Hungarian, Polish, Romanian, Russian, Slovenian and Turkish stock price indices to test whether the series contain unit root. To provide basis for comparing the results of
nonlinear unit root tests to the unit root tests that do not take account of nonlinearity in the series, we also carried out two widely used unit root tests, namely, the ADF and PP tests and linear panel unit root test IPS (Ġm, Pesaran and Shin (2002)).
CHAPTER 3
METHODOLOGY
The efficient market hypothesis states that security prices fully reflect all available information and that the price fluctuations are unpredictable. Unpredictability of returns is satisfied if stock prices follow a random walk, that is, stock prices are characterised by a unit root. Notwithstanding the fact that these markets attract a growing interest of economists in recent years, no consensus on whether or not efficient market hypothesis holds for these markets is attained yet. A common feature of these studies is that possible nonlinearities in conditional mean of the series have not been taken into account in testing efficiency of these markets. However, it is well known that many economic and financial time series follow nonlinear processes (e.g., Granger and Teräsvirta, 1993; Franses and van Dijk, 2000). Therefore, possible nonlinearities in data generating process should explicitly be taken into account in analyzing financial time series in order to avoid spurious results.
Recently Kapetanios et al. (2003) have developed a unit root test procedure in an ESTAR framework, which has a better power than conventional Dickey-Fuller test. Moreover, Ucar and Omay (2010) have developed a nonlinear panel unit root test in an ESTAR structure, which has a better power than linear panel unit root test IPS. In this paper, we apply Kapetanios et al. (2003) and Ucar and Omay (2010) nonlinear unit root and panel unit root tests to eight emergent markets, namely, Bulgarian,
Greek, Hungarian, Polish, Romanian, Russian, Slovenian and Turkish stock price indices to test whether the series contain unit root. To provide basis for comparing the results of nonlinear unit root tests to the unit root tests that do not take account of nonlinearity in the series, we also carried out two widely used unit root tests, namely, the ADF and PP tests and linear panel unit root test IPS. In this respect we make two important contributions to this literature. First we have taken into account the possible nonlinearities in conditional mean of the series in testing efficiency of these markets which is a deviation from the vast literature. The second one, we have used Ucar and Omay (2010) nonlinear panel unit root test which increase the power of nonlinear unit root test. It is the first time a nonlinear panel unit root test is used in the market efficiency literature.
3.1. Linear Unit Root Test
The simplest version of the unit root test proposed by Dickey and Fuller (1979). They suggest 3 version of the test as bellow:
1 t t t y gy- e D = + (3.1) 0 1 t t t y a gy- e D = + + (3.2) 0 1 2 t t t t y a gy- a e D = + + + (3.3)
From the above equation the difference between the three regressions concerns the presence of the deterministic elements a and 0 a (Enders, 2010). 2t
Dickey and Fuller test is augmented by the logs of dependent variable (Dyt) in order to eliminate the serial correlation. This version of test is called Augmented Dickey Fuller test which can be written as:
1 1 k t t t k t i y gy- y- e = D = +
å
D + (3.4) 0 1 1 k t t t k t i y a gy- y- e = D = + +å
D + (3.5) 0 1 2 1 k t t t t k t i y a gy- a y- e = D = + + +å
D + (3.6)In all of three test the null hypothesis is:
0 : 0
H g = unit root
: 0
a
H g ¹ stationary
In Dickey-Fuller test error terms assumed to be serially independent and homoscedastic. Hence we have to be sure about there assumption while applying Dickey-Fuller test. Phillips and Perron (1988) expend these assumptions:
1 1 t t t t y = a +a y- + m (3.7) 0 1 1 2 2 t t t t T y = a + a y- + a - + m (3.8)
T indicates number of observation and m is error term. But, in this time there is no t
3.2. Individual Nonlinear Unit Root Test
In this section we briefly discuss the nonlinear unit root test procedure developed by Kapetanios et al. (2003). Consider a univariate smooth transition autoregressive (STAR) 2 model of order 1:
t d t t t t y y F y y 1 1 (; ) , (3.9)
where yt is a mean zero stochastic process for t = 1,…,T, t~ (0, ) 2
iid , and β and γ are unknown parameters. The transition function F(;ytd) is assumed to be of the exponential form: ) y exp( -1 ) ; ( ytd 2t-d F , (3.10)
where it is assumed that θ > 0, and d ≥ 1 is the delay parameter. The exponential function is bounded between zero and one, and is symmetrically U-shaped around zero. The parameter θ is slope coefficient and determines the speed of transition between to regimes that correspond to extreme values of the transition function. Using (2) in (1) one obtains the following exponential STAR (ESTAR) model:
t d
t t t t y y y y 1 11exp( 2 ) , (3.11)which after reparameterising can be written conveniently as
t d
t t t t y y y y 1 11 exp( 2 ) , (3.12)where 1. The ESTAR model has a nice property that it allows modelling different dynamics of series depending on the size of the deviations from the fundamental equilibrium (e.g., Teräsvirta and Anderson, 1992). As briefly discussed above, the arbitrageurs shall not engage in reversion strategies if deviations from the equilibrium are small in size and therefore arbitrage is not profitable. If the deviations from equilibrium are large enough, however, arbitrageurs shall engage in profitable reversion trading strategies, and thus bring the prices to their equilibrium levels. In the context of ESTAR model, this would imply that while 0 is possible, one must have 0 and 0 for the process to be globally stationary. Under these conditions, the process might display unit root for small values of 2
d t y , but for larger values of 2 d t
y it has stable dynamics, and as a result, is geometrically ergodic. As shown by Kapetanios et al. (2003), ADF test may not be very powerful when the true process is nonlinear yet globally stationary.
Imposing 0 (which implies that yt follows a unit root in the middle regime) the ESTAR model can be written as
t d
tt
t y y
y
The global stationarity of the process yt can be established by testing the null hypothesis H0: 0 against the alternative H1: 0. However, testing the null
hypothesis directly is not feasible since the parameter is not identified under the null. To overcome this problem, Kapetanios et al. (2003) follow suggestion of Luukkonen et al. (1988) to replace the transition function by its appropriate Taylor approximation to derive a t-type test statistic. Replacing the transition function with its first order Taylor approximation yields the following auxiliary regression:
t d t t y e y 3 , (3.14)
where et comprises original shocks t as well as the error term resulting from Taylor approximation. The test statistic for 0 against 0 is obtained as follows:
) ˆ .( . / ˆ se tNL , (3.15)
where ˆ is the OLS estimate and s.e.(ˆ) is the standard error of ˆ.
To accommodate stochastic processes with nonzero means and/or linear deterministic trends, one needs following modifications. In the case where the data has nonzero mean, i.e., xt yt, one must replace the raw data with de-meaned data yt xtx where x is the sample mean. In the case where the data has a nonzero
mean and a nonzero linear trend, i.e., xt tyt, one must instead use the de-meaned and de-trended data yt xtˆˆt where ˆ and ˆ are OLS estimators of
In the more general case where errors in (5) are serially correlated, one may extend (5) to
t d
t t p j j t j t y y y y
11 exp( 2 ) 1 (3.16)The tNL statistic for testing 0 in this case is given by the same expression as in (7), where ˆ is the OLS estimate and s.e.(ˆ) is the standard error of ˆ obtained from the following auxiliary regression with p augmentations:
t d t p j j t j t y y e y
3 1 (3.17)In practice, the number of augmentations p and the delay parameter d must be selected prior to the test. Kapetanios et al. (2003) propose that standard model selection criteria or significance testing procedure be used for selecting the number of augmentations p. They also suggest that the delay parameter d be chosen to maximize goodness of fit over d
1,2,...,dmax
.3.3. Linear Panel Unit Root Test
Dickey-Fuller test is an individual test which is employed to individual series. But the Dickey-Fuller test has little power to detect the fact that the series are stationary. One way to obtain a more powerful test is to pool the estimates from a number of separate series and then test the pooled values (Enders 2010). The theory underlying
the test is very simple: If you have n independent and unbiased estimates of a parameter, the mean of the estimates is also unbiased. More importanly, so long as the estimates are independent, the central limit theory suggests that the sample mean will be normally distributed around the true mean (Ender 2010).
Im, Pesaran and Shin (2002) showed how to use this result to construct a test for a unit root when you have a number of similar time-series variables
0 1 2 1 i p it i i it i t ij it j it i y a y a y
, i=1,2,…….,nIn traditional Dickey-Fuller test, each of these t-statistics denoted by ti. However for the panel unit root test, form the sample mean of the t-statistics as
1 1 n i i t t n
It is straight forward to construct the statistic Ztbar as
tbar n t E t Z Var t 3.4. Nonlinear Panel Unit Root Test
In order to analyze stationarity properties of the data, we first test whether the data have unit root by using panel unit root tests. It is well known that conventional unit-root tests have low power if the true data generating process is non-linear. Hence, in addition to conventional panel unit root test IPS, we also applied the non-linear panel unit root test newly proposed by Ucar and Omay (2009), which we call as the UO test. The UO test has a good power when the series under investigation follow a non-linear process. A brief review of the UO test can be given as follows.
Let zit be panel exponential smooth transition autoregressive process of order one (PESTAR(1)) on the time domain t = 1,2,…,T for the cross-section units i = 1,2,…,N. Consider zit generated by the following PESTAR process with fixed effect
parameter i: 2 1 1 1 exp( ) it i it i it i it d it z z z z (3.18)
where d1 is the delay parameter and i 0 represents the speed of revision for all units; it is a serially and cross-sectionally uncorrelated disturbance term with zero mean and variance i2.
Following previous literature, Ucar and Omay (2009) set i 0 for all i and d=1 which gives specific PESTAR(1) model:
2 1 1 exp( ) it i i it i it d it
z z z
(3.19)
Non-linear panel data unit root test based on regression (2) with augmented lag variables in empirical application is simply to test the null hypothesis i 0 for all i against i 0 for some i under the alternative. However, direct testing of the null hypothesis is problematic since i is not identified under the null. This problem can be solved by taking first-order Taylor series expansion to the PESTAR(1) model around i 0 for all i. Hence the obtained auxiliary regression is given by:
3 1 it i i it it
z z
(3.20)
where i i i. In empirical application equation (3) augmented by lagged variables of dependent variable by using AIC and SIC criteria. Based on equation (3), hypothesis for unit root testing is
0: i 0
H , for all i, (Linear Nonstationary)
H0:i 0, for all i, (Non-linear Stationary)
The UO test is constructed by standardizing the average of individual KSS statistics across the whole panel. First, the KSS test for the ith individual is the t-statistics for testing i 0 in equation (3) defined by:
' 3 , 1 , 3/ 2 ' , , 1 , 1 ˆ i t i i NL î NL i t i z M z t z M z where ˆi NL2, is the consistent estimator such that ˆi NL2, z M zi' t i/(T1),
1' '
t T T T T T
M I with zi
zi1,zi2,...zi T
' and T (1,1,...,1).Furthermore, when the invariance property and the existence of moments are satisfied, the usual normalization of tNL statistic yields as follows:
,
, ( ) var( ) NL i NL NL i NL N t E t Z t where 1 1 N NL NL i t N t
; E t(i NL, ) and var(ti NL, ) can be found in Table 1 of Ucar and Omay (2009).Up untill here, we have not seen anything about cross-section dependency. Most of the panel data models assume that disturbances in panel models are cross-sectionally independent. However, cross-section dependence may arise for several reasons often, due to spatial correlations, spillover effects, economic distance, omitted global variables and common unobserved shocks. In the presence of cross-section dependence, it is well known that neglecting cross-section dependence can lead to biased estimates and produce misleading inference. In large panels, where N is sizeable amount cross-section dependency is not a serious problem to control. But
Pesaran (2004) pointed out that cross-section dependency continues to exist in large panel as well as small panels. Therefore, we have to make misspecification tests. Thus, we have made a diagnostic check for cross-section dependency for non-linear panel models following Omay and Kan (2010). Pesaran (2004) showed that his CD test can also be applied to a wide variety of models, including small/large N and T. Additionally, this simple diagnostic test does not require an a priori specification of connection or spatial matrix. CD test is based on simple average of all pair-wise correlation coefficients of the OLS residuals from the individual regressions in the panel: ' it it i i it y x u (3.21)
where, on the time domain t = 1,2,…,T, for the cross-section units i = 1,2,…,N. xi,t
is a kx1 vector of observed time-varying regressors. The individual intercepts, i and slope coefficients i are defined on a compact set permitted to vary across i. For each i, uit~
2 ,
(0, i u)
iid , for all t although they could be cross-sectionally correlated.
The sample estimate of the pair-wise correlation of the residuals is:
1 1/ 2 1/ 2 2 2 1 1 ˆ ˆ T it jt t ij ji T T it jt t t e e e e
(3.22)And the eit is the OLS estimates of uit defined by ' it ˆ ˆ it it i i e y x (3.23)
The proposed CD test by Pesaran (2004) is:
1 1 1 2 ˆ ( 1) N N LM ij i j i T CD N N
1 2 2 1 1 1 ˆ ( . 1) ( 1) N N LM ij i j i CD T N N
1 1 1 1 ˆ . N N LM ij i j i CD T
(3.24)CD test statistic has exactly mean zero for fixed values of T and N, under a broad class of panel data models. The CD test is based on simple average of all pair-wise correlation coefficients of the NLLS residuals from the individual regressions in the smooth transition panel model Omay and Kan (2010):
' ' 0 1 ( ; , ) it i it it it it y x x F s c u (3.25) and the eit is the NLLS estimates of uit defined by
' ' 0 1 ˆ ˆ ˆ ˆ ( ; , )ˆ it it i it it it e y x F s c x (3.26)
Where ( ; , )ˆ ˆ 1ˆ( ˆ) 1 it it s c F s c e
These are the estimated values of the slope (γ) and threshold (c) parameters. The dot on the transition variable means that it is selected from the linearity tests. In non-linear models, the definition of the residual is ambigous and can be defined in a number of different ways. The above representation is the definition of disturbance of the non-linear models analogous to linear case. For the sake of clarity, we denote cross-section dependency test for the linear model as CDLML , whereas CDLMNL denotes the same test for the nonlinear model. Thus the CDLML and the CDLMNL tests are used in the study as proposed by Omay and Kan (2010).
3.5. Data and Unit Root Test Results
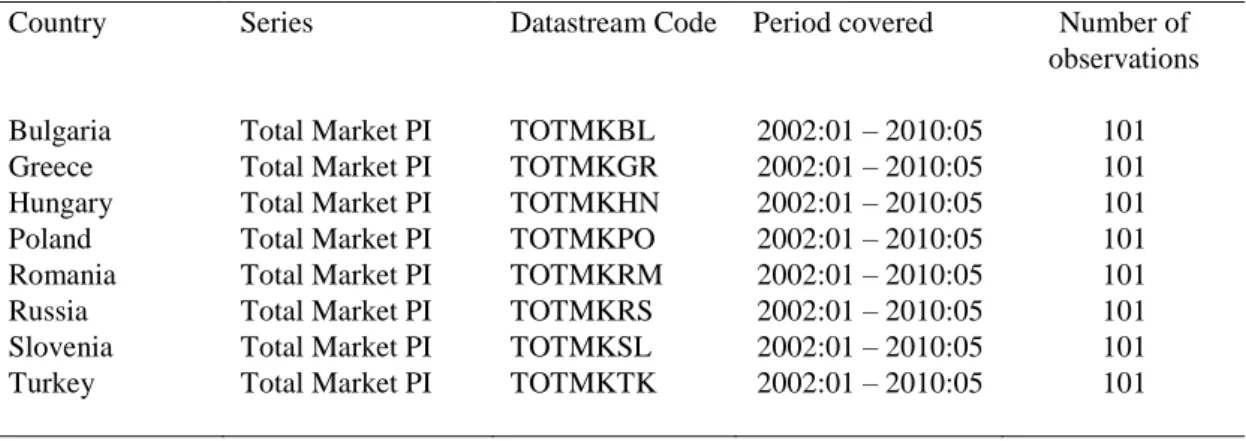
We apply the above described procedure to test whether stock prices of major European emergent markets contain unit root. A finding of unit root would imply that stock prices are random walk processes, and thus, weak form efficient. The investigated markets are Bulgarian, Greek, Hungarian, Polish, Romanian, Russian Slovenian and Turkish markets. The data are monthly and sourced from Datastream. Series names, periods, and Datastream codes for the data are provided in Table 1.
Table 3.1. Description of stock price series.
It is well known that stock prices may contain time trend (see, for example, Beechey
et al., 2000). If the market is efficient, however, fluctuations in the stock prices away
from trend should be unpredictable. Therefore, in conducting the above described nonlinear unit root test we consider de-meaned and de-trended series. The de-meaned and de-trended series were obtained by regressing the natural logarithms of index series on a constant and a linear time trend.
Preliminary tests for nonstationarity of the series and their differences, based on ADF (Dickey and Fuller, 1981) and PP (Phillips and Perron, 1988) tests are provided in Table 1. Both tests suggest that all stock price indices are I(1) processes, consistent with the efficient market hypothesis.
Country Series Datastream Code Period covered Number of observations Bulgaria Total Market PI TOTMKBL 2002:01 – 2010:05 101 Greece Total Market PI TOTMKGR 2002:01 – 2010:05 101 Hungary Total Market PI TOTMKHN 2002:01 – 2010:05 101 Poland Total Market PI TOTMKPO 2002:01 – 2010:05 101 Romania Total Market PI TOTMKRM 2002:01 – 2010:05 101 Russia Total Market PI TOTMKRS 2002:01 – 2010:05 101 Slovenia Total Market PI TOTMKSL 2002:01 – 2010:05 101 Turkey Total Market PI TOTMKTK 2002:01 – 2010:05 101
Table 3.2. Linear unit root test results.
ADF PP
Country Log Levela First Differenceb Log Levela First Differenceb Bulgaria -0.785 -6.983* -0.760 -7.314* Greece -0.841 -6.890* -0.874 -6.890* Hungary -1.651 -7.773* -1.739 -7.765* Poland -1.186 -8.469* -1.541 -8.465* Romania -1.445 -7.890* -1.469 -7.899* Russia -2.142 -4.560* -1.770 -7.356* Slovenia -1.722 -5.632* -1.182 -5.686* Turkey -1.887 -9.719* -2.015 -9.721* Notes:
a) Regressions include an intercept and linear time trend. b) Regressions include only intercept.
Optimal lag length in ADF test was selected using AIC with maximum lag order of 12. *, ** and *** indicate significance at 1%, 5% and 10% significance levels, respectively.
To carry out the nonlinear unit root tests, we firstly estimated an AR(12) model for each series and excluded insignificant (at 10% significance level) augmentation terms. Then, we estimated regression with selected augmentations to compute the
NL
t statistics. We selected the delay parameter d that maximised 2
R over
1,2,...,12
d . Unlike the case of testing linearity against STAR type nonlinearity, the
NL
t test does not have an asymptotic standard normal distribution. Therefore, we bootstrapped the tNL test statistic with 10,000 replications.
Table 3.3. Nonlinear unit root test results. Country tNL Bulgaria -1.324 Greece -2.821 Hungary -3.044 Poland -3.138*** Romania -3.217*** Russia -3.203*** Slovenia -1.754 Turkey -2.230
Notes: The tNL statistic was computed by bootstrapping with 10,000 replications. Asymptotic critical values of the tNL statistic at 1%, 5% and 10% significance levels are -3.93, -3.40 and -3.13. These values are taken from Table 1, Kapetanios et al. (2003, p. 364). * and ** denote significance at 1% and 5% levels, respectively.
As the Table 3.3 reveals, the null hypothesis of unit root is rejected at 10% significance level for Russian, Romanian and Polish series suggesting that these markets are not efficient. The null of unit root is not rejected at conventional levels for the Bulgarian, Greek, Hungarian, Slovenian and Turkish series, however, implying that these markets are weak form efficient.
Now it is time to deal this group of countries in panel unit root context. It will be interesting to see these markets in
Table 3.4. Linear and nonlinear panel unit root test results without cross section
dependency.
IPS UO
Log Levela First Differenceb Log Levela First Differenceb
NL
t -1.458 -7.240* -2.583*** -9.721* tbar
z 2.598 -18.816
Notes:
a) Regressions include an intercept and linear time trend. b) Regressions include only intercept.
Optimal lag length in IPS and UO tests were selected using AIC with maximum lag order of 12. *, ** and *** indicate significance at 1%, 5% and 10% significance levels, respectively.
NT for UO test statistics at 1%, 5% and 10%significance levels are −2.44, −2.21, and −2.08 and for trend-intercepts are −2.94,−2.72, and −2.57. For intercept only, the values are taken from Table 2 of Ucar andOmay (2009, p: 6). Asymptotic critical values of t-bar statistics at 1%, 5% and 10%significance levels are−2.20,−1.95 and−1.85 and for the trend-intercepts are−4.50,−3.35, and −3.02. These values are taken from Table 2 IPS (2003, p 61–62). *, **, and *** denote significance at 1%, 5% and 10% levels, respectively. Besides, optimal laglength in these tests were selected using AIC with maximum lag order of 8.
The test of panel unit root explained in the previous section was based on the assumption of independence over cross-section units. However, we see from the below diagnostic check that this assumption is violated.
Table 3.5. Cross section dependency test.
Istatistik değeri P value
1 LM CD 44.933 0.00007 2 LM CD 5.465 0.00000005 3 LM CD 4.492 0.000007
Notes: Under the null hypothesis the CD statistics converge to a normal standard distribution. The values in the parentheses are p values.
To overcome the cross-section dependency problem, we implemented Sieve bootstrap approach which is very well outlined in Ucar and Omay (2009). The test
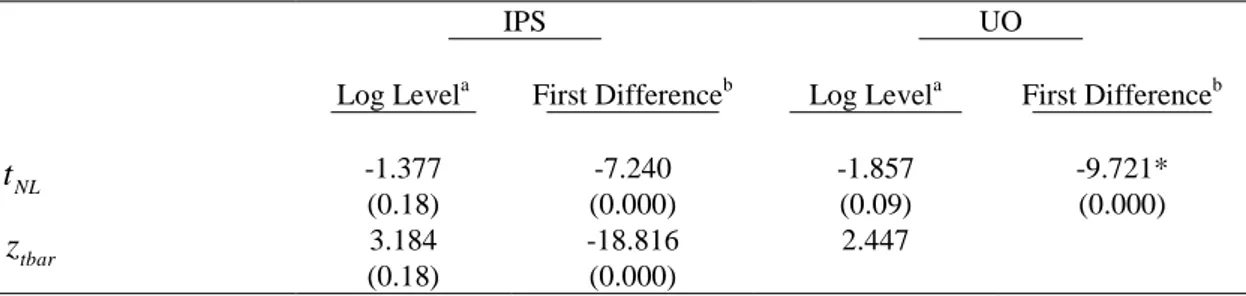
Table 3.6. Linear and nonlinear panel unit root test results with cross section dependency.
IPS UO
Log Levela First Differenceb Log Levela First Differenceb
NL t -1.377 (0.18) -7.240 (0.000) -1.857 (0.09) -9.721* (0.000) tbar z 3.184 (0.18) -18.816 (0.000) 2.447 Notes:
a) Regressions include an intercept and linear time trend. b) Regressions include only intercept.
Optimal lag length in IPS and UO tests were selected using AIC with maximum lag order of 12. *, ** and *** indicate significance at 1%, 5% and 10% significance levels, respectively.
As can be seen from Table 3.6, the UO and IPS tests have different results with respect to weak form market efficiency. As regard to the IPS test this group of emergent countries failed to reject the null hypothesis of unit root which means that they are efficient as a group. On the other hand, UO test rejected the null hypothesis that this group is not constitute a group of efficient market.This result may be due to the fact that the IPS test has a low power against non-linear stationary process. Hence, with the linear unit root and the panel unit root test suggest that these are individually and as a group efficient market where as nonlinear unit root and panel unit root test suggest that some of them individually efficient but as a group they are seen to be inefficient in weak form sense.
CHAPTER 4
CONCLUSIONS
In this paper we have tested whether Bulgarian, Greek, Hungarian, Polish, Romanian, Russian, Slovenian and Turkish stock price series contain unit root, consistent with weak form efficiency. For this purpose we carried out conventional ADF and PP unit root tests as well as nonlinear unit root test recently proposed by Kapetanios et al. (2003). The results of ADF and PP indicate that Bulgarian, Greek, Hungarian, Polish, Romanian, Russian, Slovenian and Turkish stock price series contain unit root. Using nonlinear unit root test due to Kapetanios et al. (2003), we are able to reject the null hypothesis of unit root for Russian, Romanian and Polish stock price series, implying that these markets are not weak form efficient. Moreover, we apply linear and nonlinear panel unit root test to this group of countries. The linear panel unit root test suggest that this group as all efficient market where as nonlinear panel unit root test suggest as a group they are inefficient in the weak form sense.
The efficient market hypothesis states that security prices fully reflect all available information and that the price fluctuations are unpredictable. Unpredictability of returns is satisfied if stock prices follow a random walk, that is, stock prices are characterized by a unit root. These results show that the markets in this region seem
consideration of nonlinearities and this can be seen as model misspecification. By applying nonlinear test, first of all we see that the data generating process is nonlinear. With respect to this information, we obtain the true results about the market efficiencies of these region namely emergent markets of Europe. In this respect we make two important contributions to this literature. First, we have taken into account the possible nonlinearities in conditional mean of the series in testing efficiency of these markets which is a deviation from the vast literature. The second one, we have used Ucar and Omay (2010) nonlinear panel unit root test which increase the power of nonlinear unit root test (One way to obtain a more powerful test is to pool the estimates from a number of separate series and then test the pooled values). Furthermore, this is the first time a nonlinear panel unit root test is used in the market efficiency literature.
REFERENCES
[ 1 ] AWAD, E.M. and H.M.GAHAZIRI (2004), Knowledge Management,
Pearson, Prentice Hall.
[ 2 ] BECERRA-FERNANDEZ, I et. al. (2004), Knowledge Management,
Pearson, Prentice Hall.
[ 3 ] BERRY, W.B. (2004), Survey of Text Mining Clustering, Classification, and
Retrieval Scanned by Velocity, Springer-Verlag New York.
[ 4 ] BURUNCUK, G. (2006) Data Mining for Customer Segmentation and
Profiling: A Case Study for a Fast Moving Consumer Goods (FMCG) Company, MS Thesis Study, Istanbul, Bogazici Press.
[ 5 ] COULTER, D. et. al. (2001), Antipsychotic drugs and heart muscle
disorder in international pharmacovigilance: data mining study, BMJ, 322, 19 MAY 2001, p:1207-1209.
[ 6 ] COUSEAULT, C.R. (2004) A Text Mining Framework Linking Technical
Intelligence from Publication Databases to Strategic Technology Decisions Thesis Study, PhD Thesis Study, Georgia Institute of Technology.
[ 7 ] CRISP-DM: http://www.crisp-dm.org
[ 8 ] ELDER, J.F. and D.W, ABOOTT (1998), A Comparison of Leading Data
Mining Tools, Fourth International Conference on Knowledge Discovery & Data Mining, New York.
[ 9 ] FELDMAN, R. and J. SANGER (2007), The Text Mining Handbook -
[ 10 ] FERNEDA, E. (2008), Emerging technologies of text mining: techniques
and applications, IGI Global.
[ 11 ] GANZERT, S. et. al. (2002), Analysis of Respiratory Pressure-Volume
Curves in Intensive Care Medicine Using Inductive Machine Learning, Artificial Intelligence in Medicine, 26(2002), s.69-86.
[ 12 ] GIUDICI, P. (2003), Applied Data Mining, Wiley.
[ 13 ] HAMM, C.K. (2007), Oracle Data Mining – Mining Gold from Your Data
Warehouse, Rampant TechPress.
[ 14 ] HAN, J. and M. KAMBER (2000), Data Mining: Concepts and Techniques,
Morgan Kaufmann Publishers.
[ 15 ] HAND, D. et. al. (2001), Principles of Data Mining, Prentice Hall.
[ 16 ] HEARST, M. (2003), What is Text Mining?, SIMS, UC Berkeley.
[ 17 ] HONIGMAN, B., et. al. (2001), A computerized method for identifying
incidents associated with adverse drug events in outpatients, International Journal of Medical Informatics, 61(2001), s. 21-32.
[ 18 ] http://www.dangelolaw.com/ortho_evera2.html
[ 19 ] http://en.wikipedia.org/wiki/Pulmonary_embolism
[ 20 ] http://www.mayoclinic.com/health/pulmonary-embolism/DS00429
[ 21 ] IBM (2001), Mining Your Own Business in Health Care Using DB2
Intelligent Miner for Data, IBM CORPORATION.
[ 22 ] IBM (2002), Simple Integration of Advanced Data Mining Functions, IBM
[ 23 ] KARANIKAS, H. and T. MAVROUDAKIS (2005), Text Mining Software
Survey, RANLP Text Mining Workshop.
[ 24 ] KANTARDZIC, M. (2003), Data Mining: Concepts, Models, Methods, and
Algorithms, John Wiley & Sons, New York.
[ 25 ] KEARON, C. (2003), Diagnosis of pulmonary embolism, CMAJ, January
21, 2003; 168 (2).
[ 26 ] KING, M.A. and J.F. ELDER (1998), Evaluation of Fourteen Desktop
Data Mining Tools, Department of Systems Engineering University of Virginia.
[ 27 ] MATHIAK, B. and S. ECKSTEIN (2006), Five Steps to Text Mining in
Biomedical Literature. Second International Symposium on Semantic Mining in Biomedicine 2006.
[ 28 ] MILWARD,D., et. al. (2006), Flexible Text Mining Strategies for Drug
Discovery, Second International Symposium on Semantic Mining in Biomedicine 2006.
[ 29 ] ORACLE DATA MINING (2005), Oracle Data Mining Concepts, Oracle.
[ 30 ] ORACLE TEXT MINING (2005), Text Mining with Oracle Text, Oracle.
[ 31 ] ORACLE (2006), Oracle 10g Release 2 Data Mining Tutorial, Oracle.
[ 32 ] PONOMARENKO, J., et. al. (2002), Mining DNA sequences to predict sites
which mutations cause genetic diseases, Knowledge-Based Systems, 15(2002) 225-233
[ 33 ] RUD, O. (2001), Data Mining Cookbook, John Wiley & Sons.
[ 34 ] STÜHLİNGER, W., et. al. (2000), Intelligent Data Mining for Medical
[ 35 ] THEARLING, K. (2000), An Introduction to Data Mining: Discovering
hidden value in your data warehouse.
http://www.thearling.com/text/dmwhite/dmwhite.htm
[ 36 ] TWO CROWS (2002), Introduction to Data Mining and Knowledge
Discovery, Two Crows Corporation.
[ 37 ] URAMATO, N., et. al. (2004), A text-mining system for knowledge discovery
from biomedical documents, IBM Systems Journal, VOL 43, N0 3.
[ 38 ] WASAN, K., et. al. (2006), The impact of data mining techniques on medical
diagnostics, Data Science Journal, Vol. 5 (2006) pp.119-126.
[ 39 ] WEDRO, B. (2008),
http://www.medicinenet.com/pulmonary_embolism/article.htm
[ 40 ] WING, V. and S.CHO (1999), PhD Thesis Study, Hong Kong University of
Science and Technology, Hong Kong.
[ 41 ] Yİ, S.W. (2003), Introduction to medical data mining, Science Direct,
Journal of Biomedical Informatics, Volume 39, Issue 3, June 2006, Pages 249-251.
[ 42 ] ZAHID, S. and H., ZAIDI (2002), Distributed Data Mining From
Heterogeneous Healthcare Data Repositories: Towards an Intelligent Agent-Based Framework.
[ 43 ] ZHOU, Z. (2003), Three Perspectives of Data Mining, Artificial Intelligence,
APPENDIX
CURRICULUM VITAE
PERSONAL INFORMATION
Surname, Name : OMAY, Nazlı Ceylan Nationality : Turkish (T.C.)
Date and Place of Birth : 23.01.1981 / Ankara Marital Status : Married
Phone : +90531 632 62 03
Email : [email protected] EDUCATION
Degree Institution Year of
Graduation
M.Sc. Çankaya University, Management 2010 B.S. Çankaya University, Management 2003 High School Bahçelievler Deneme Lisesi 1999
WORK EXPERIENCE
Year Place Enrollment
2004-2005 Garanti Bankası MT
2003-2004 Türkiye ĠĢ Bankası MT
FOREIGN LANGUAGES English.
HOBBIES