Journal of Statisticians: Statistics and Actuarial Sciences IDIA 11, 2018, 1, 42-54
Geliş/Received:22.04.2018, Kabul/Accepted: 24.06.2018
www.istatistikciler.org
Araştırma Makalesi / Research Article
An Integrated approach for fuzzy logistic regression
Nimet Yapıcı Pehlivan
Department of Statistics, Faculty of Statistics, University of Selçuk, 42075, Konya, Turkey
0000-0002-7094-8097
Aynur Şahin
Department of Statistics, Faculty of Statistics, University of Selçuk, 42075, Konya, Turkey
0000-0003-1681-9298
Abstract
The aim of this study is to introduced an integrated fuzzy logistic regression approach to describe the relationship between crisp inputs and fuzzy binary output. For this reason, we integrated the fuzzy logistic regression methods proposed by Pourahmad et al. [17] and Sohn et al. [24] to define a possibility measure for each case and then used the logarithmic transformation of possibilistic odds as fuzzy output observations. To estimate the parameters of the fuzzy logistic regression model, Diamond [5]’s Fuzzy Least Squares (FLS) approach is used. A numerical example is presented and obtained results are compared with classic logistic regression model.
Keywords: Fuzzy Logistic Regression, Possibilistic odds, Fuzzy Least Squares.
Öz
Bulanık Lojistik Regresyon için Entegre Bir Yaklaşım
Bu çalışmanın amacı, kesin girdiler ile bulanık ikili çıktı arasındaki ilişkiyi tanımlamak için birleştirilmiş bulanık lojistik regresyon yaklaşımını tanıtmaktır. Bu nedenle, her bir durum için bir olasılık ölçüsü tanımlamak ve daha sonra olabilirlik oranlarının logaritmik dönüşümünü bulanık çıktı gözlemleri olarak kullanmak amacıyla Pourahmad ve ark. [17] ve Sohn ve ark. [24] tarafından önerilen bulanık lojistik regresyon yöntemleri entegre edilmiştir. Bulanık lojistik regresyon modelinin parametrelerini tahmin etmek için, Diamond [5]’ın Bulanık En Küçük Kareler (FLS) yaklaşımı kullanılmıştır. Sayısal bir örnek sunulmuş ve elde edilen sonuçlar klasik lojistik regresyon modeli ile karşılaştırılmıştır.
Anahtar sözcükler: Bulanık Lojistik Regresyon, Olabilirlik Oranları, Bulanık En Küçük Kareler.
1. Introduction
Regression analysis is one of the most widely used and powerful methodology to model the functional relationship between a response variable (dependent variable, output) and one or more explanatory variables (independent variables, inputs). In many real world problems, some observations couldn’t be determined exactly and they need to be defined by linguistic terms or fuzzy numbers. Fuzzy regression (FR) analysis first introduced by Tanaka et al. [26], is an extension of classical regression analysis in which some elements of the model are represented by any type of fuzzy numbers. On the contrary to
classical regression that is based on probability theory, fuzzy regression could be based on possibility theory and fuzzy set theory. There are two main approaches for Fuzzy Regression: (i) Possibilistic Regression approach proposed by Tanaka et al. [26] which is based on possibility concepts and minimizes total vagueness of the estimated values for the outputs (see, Chang and Lee [3], Hojati et al. [6], Modarres et al.[10], Nasrabadi et al. [13], Özelkan and Duckstein [14], Peters [15], Sakawa and Yano [21], Tanaka and Watada [27], Tanaka [25], etc). (ii) Fuzzy Least Squares Method proposed by Diamond [5] and Celmins [2] simultaneously which is based on minimizing the errors between observed and estimated outputs (see, (D’urso [4], Diamond [5], Kao and Chyu [7], Khan and Valeo [8], Ming et al. [9], Yang and Lin [28], etc.).
Some studies on Fuzzy Regression models considered crisp (i.e. nonfuzzy) inputs, fuzzy parameters and fuzzy outputs (see, Hojati et al. [6], Nasrabadi et al. [13], Peters [15], Savic and Pedrycz [22], Shakouri and Nadimi [23], Tanaka [25], Tanaka and Watada [27], Tanaka et al. [26]). Some of them handled fuzzy inputs, crisp parameters and fuzzy outputs (see, Diamond [5], Kao and Chyu [7], Ming et al. [9]), while the other studies took into account fuzzy inputs, fuzzy outputs and also fuzzy parameters (see, Hojati et al. [6], Khan and Valeo [8], Sakawa and Yano [20], Sakawa and Yano [21], Yang and Lin [28]).
Logistic regression analysis have been used to model functional relationship between a binary response variable and one or more explanatory variables. Fuzzy Logistic Regression defined the relationship between crisp/fuzzy inputs and fuzzy binary outputs considering fuzzy regression approaches. Contrary to fuzzy regression models, there have been a limited number of studies on fuzzy logistic regression in the literature. To estimate parameters of the fuzzy logistic regression model, Tanaka et al. [26]’s possibilistic approach and Diamond [5]’s Fuzzy Least Squares method have been used by several authors: Pourahmad et al. [16] proposed fuzzy logistic regression model for crisp inputs and binary output which its value takes a number between 0 and 1. They used Tanaka et al. [26]’s possibilistic approach by introducing the concept of possibilistic odds to estimate the model parameters and also proposed some goodness-of-fit criteria. Pourahmad [17] presented Fuzzy Logistic Regression to model fuzzy binary outputs. Due to the vague nature of binary outputs, a fuzzy model based on possibility of success defined by linguistic terms was constructed. The logarithm transformation of possibilistic odds was modelled based on crisp inputs by using Extension Principle and Diamond [5]’s FLS method was used to estimate model parameters. The capability index was calculated for evaluating the model. Namdari et al.[11] aimed to assess the effect of folic acid on the appetite of preschool children 3 to 6 years old. Since appetite was measured by linguistic terms, a fuzzy logistic regression was applied by using Diamond [5]’s FLS method and the obtained results were compared with a ordinal logistic regression model. Namdari et al. [12] investigated fuzzy logistic regression model for crisp input and fuzzy binary output which was measured by linguistic terms. They developed least absolute deviations (LAD) method for modeling and compared the results with the least squares estimation (LSE) method by providing two estimation methods, min–max method and fitting method. Also, new goodness-of-fit indices, measure of performance based on fuzzy distance (Mp) and index of sensitivity (IS), were presented. Sohn et al. [24] presented a new technology credit scoring model based on the fuzzy logistic regression method with fuzzy input and fuzzy binary output data for predicting the possibility of loan default of firms. The estimation method of coefficients was conducted based on Yoon and Choi [29]’s FLS.
The aim of this study is to introduce an integrated approach for fuzzy logistic regression model with crisp inputs and fuzzy output based on Pourahmad et al. [17] and Sohn et al. [24]. To estimate the parameters of the fuzzy logistic regression model, FLS approach of Diamond [5] is used. A numerical example is presented and obtained results are compared with classical logistic regression model.
The remainder of this study is as follows: some basic definitions of fuzzy sets are given in Section 2. A brief review on logistic regression and detailed definition of fuzzy logistic regression methods are given in Section 3. In Section 4, an application of Pima India Diabetes data set is employed to investigate the proposed fuzzy logistic regression model and to compare with classical logistic regression. Finally, conclusions are drawn in Section 5.
2. Basic Definitons of Fuzzy Sets
This section gives basic definitions and concepts of fuzzy sets and arithmetic operations on fuzzy sets are given as [19]
Definition 2.1. A fuzzy set A defined in space X is a set of pairs:
,( ) ,
A
A x x x X (2.1)
where: fuzzy set A is characterized by its membership function A( ) :x X[0,1]. Definition 2.2. -level set of a fuzzy set A in space X is defined as
( ) , [0,1]
A x (2.2)
Definition 2.3. (Extension Principle) Let X be the Cartesian product of universes (X X1, 2,...,Xn) and
1 2
( , ,...,A A An) be fuzzy sets in (X X1, 2,...,Xn), respectively. Suppose that f is a mapping from X to a universe Y, yf x x( , ,..., )1 2 xn Y. A fuzzy set B in Y is defined by Extension principle as follows:
1 2
1 12 1 1 1 1 (,, ...,)() sup min ( ), ( ),..., ( ) , ( ) 0, n n A A A xxxfy x x x f y B otherwise (2.3)Definition 2.4. A triangular fuzzy number A
a a a1, 2, 3
is characterized by following membership function, 1 3 1 1 2 2 1 3 2 3 3 2 0, , ( ) , , A x a x a x a x a x a a a a x a x a a a (2.4)Definition 2.5. A
a a a1, 2, 3
and B( ,b b b1 2, 3) are two triangular fuzzy numbers. Arithmetic operationson fuzzy numbers are considered as follows:
Addition: A( ) B (a1b a1, 2b a2, 3b3) (2.5) Substraction: A( ) B (a1b a3, 2b a2, 3b1) (2.6) Multiplication: A( ) B (a b a b a b1 1, 2 2, 3 3) (2.7) Division: 1 2 3 1 2 3 ( ) (a ,a ,a ) A B b b b (2.8)
Multiplication by constant k: 1 2 3 3 2 1 ( , , ), 0 ( ) ( , , ), 0 ka ka ka k k A ka ka ka k (2.9) Inverse:
1 3 2 1 1 1 1 , , A a a a (2.10)3. Fuzzy Logistic Regression
This section presents a brief review on logistic regression and detailed definition of fuzzy logistic regression methods.
3.1. Logistic Regression
Logistic regression analysis have been used to model functional relationship between a binary dependent variable and one or more independent variables and frequently applied in clinical research, credit scoring, genetics, etc. Independent variables may be continuous, discrete, and binary or a mix of any of these. No assumptions are made about the distribution of these variables. Binary dependent variable with two categories Y0,1 (i.e. No/Yes or Failure/Success) has Bernoulli probability distribution. It can take the value of 1 with a probability of success (), or the value of 0 with probability of failure (1). Due to the relationship between the independent and dependent variables is not linear, the logit transformation of
is used as follows: 0 1 1 ... 1 1 eb b x b xn n (3.1)
So, the form of the model in Eq. (3.1) is considered as:
1 0 1 1 ln b b x ... b xn n (3.2) where: 0 1 1 ... 1 n n b b x b x e is called as “probability odds” and b jj, 0,1,...,n indicates the model
parameters [17].
3.2. Fuzzy Logistic Regression
Fuzzy Logistic Regression has defined the relationship between crisp/fuzzy independent variables and fuzzy binary dependent variables considering fuzzy regression approaches. To estimate parameters of the fuzzy logistic regression model, Tanaka et al. [26]’s possibilistic approach and Diamond [5]’s Fuzzy Least Squares method have been used. In the literature, contrary to fuzzy linear regression models, there have been only a few studies on fuzzy logistic regression, such as Pourahmad et al.[16, 17], Namdari et al.[11, 12], Sohn et al.[24].
Generally, when establishing a model for logistic regression, uncertain or fuzzy observations are eliminated. However, if there are too many uncertain or fuzzy observations, a model cannot be constructed since the probabilistic odds cannot be computed. Therefore, the concept of “possibilistic odds” can be considered for such observations. Suppose that Y ii, 1, 2,...,m is a fuzzy binary dependent variable and
, 1, 2,..., ; 1, 2,...,
ij
x i m j n is a set of crisp independent variables, the definition of “possibilistic odds” given in Pourahmad et al.[17] is as follows:
, 1, 2,...,
i i m is the possibility of success, i.e. i Poss Y( i 1) and it could be defined by i) a real crisp
value, i, 0i 1 or ii) a linguistic term, such as i {Very low, Low, Medium, High, Very High}. The ratio , 1, 2,...,
1 i i
i m is handled as “possibility odds” for the observation i, which determines the possibility of success relative to the possibility of non-success.
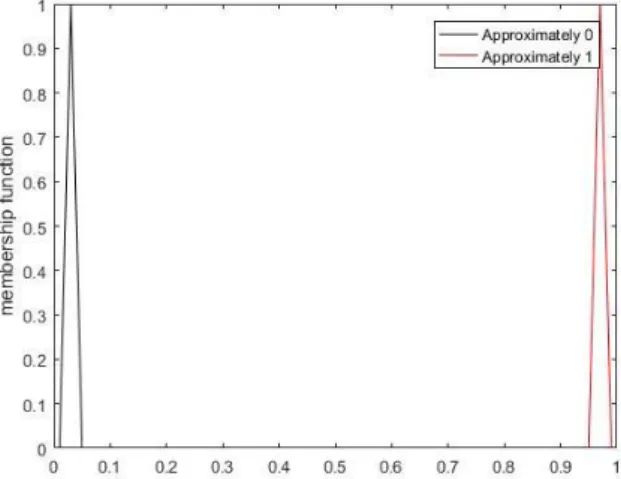
In this study, we considered linguistic terms i {Approximately 0, Approximately 1} which are
characterized by triangular fuzzy numbers as Approximately 0=(0.01, 0.03, 0.05) and Approximately 1=(0.95, 0.97, 0.99) for the possibility of success as shown in Figure 1. Due to the computational simplicity in arithmetic operations, the triangular fuzzy numbers are the most widely used fuzzy number type in the literature and have a common range of uses.
Figure 1. Membership functions of linguistic terms of Approximately 0 and Approximately 1
In the integrated method, the triangular fuzzy numbers Y corresponding to are computed as ln 1 Y% %
% according to the Sohn et al. [24]. Then, a fuzzy logistic regression model with a fuzzy binary dependent variable proposed by Pourahmad et al. [17] is applied as follows:
1 0 1 1 ln ... ; 1, 2,..., i i i i n in W% %% A% A x% A x% i m (3.3)where; A%j (a sj, j T) ,j0,1,...,n indicates fuzzy parameters which are symmetrical triangular fuzzy numbers with center aj and spread sj. Wi is the estimator of the logarithmic transformation of
possibilistic odds and it is called as estimated fuzzy dependent variable. Wi is a triangular fuzzy number denoted by Wi
f ai( ),f si( )
T,i1, 2,...,m in which f ai( )a0a x1 1i ... a xn in and0 1 1
( ) ...
i i n in
f s s s x s x .
-level set of Wi is computed as:
( ) (1 ) ( ), ( ) (1 ) ( )
i i i i i
In the method, an expert assigns a linguistic term i as the possibility of success. Then, the logarithmic
transformation of possibility odds are considered as observed dependent variables,wi, as follows:
1 ln , 1, 2,..., i i i w i m (3.5)The membership function of the wi is calculated from the defined membership function of i
l m ri, i, i
Tby using Extension Principle. -level set of wi is calculated based on
i as:
( )
( )
1 ( ) 1 ( ) ln , ln ii ii l r i l r w (3.6) where:
( ), ( ) i i i l r ( ) (1 )( ) i i i i l m m l ( ) (1 )( ) i i i i r m r mTo obtain an optimal model for Eq (3.3), Sum of Squares Error (SSE) between wi and W ii, 1, 2,...,m is
minimized by Diamond [5]’s FLS method by:
1 1/2 2 2 1 1 0 ( , ) ( ) ( ( ) , ( )
m i i
m i i i i SSE d w W f d w W d (3.7)By using Eq (3.4) and Eq(3.6), SSE is computed by,
2
2 1 ( ) ( ) 1 ( ) 1 ( ) 0 1 ( ) ln ( ) ( 1) ( ) ln ( ) (1 ) ( )
i i i i m l r i i i i l r i SSE f f a f s f a f s d (3.8)By minimizing the SSE with respect to aj and sj, j0,1,...,n following equations are obtained:
1
() () 1() 1() 0 1 2 2 ( ) ln ln 0
i i i i m l r l r ij i i j SSE x f a d a (3.9)
1 ( ) ( ) 1 ( ) 1 ( ) 0 1 2 (1 ) 2(1 ) ( ) ln ln 0
i i i i m l r ij i l r j i SSE x f s d s (3.10)The quantities in Eq (3.7) and Eq (3.8) depend on definition of possibility of success (i) assigned to each
observation by the expert. Substituting these values and calculating related integrals, the following equations are derived:
0 0 1 1 1 1 1 1 ... , ,1,...,
m i ij
m i ij n
m in ij
m i ij i i i i a x x a x x a x x z x j n (3.11) 0 0 1 1 1 1 1 1 ... , ,1,...,
m i ij
m i ij n
m in ij
m i ij i i i i s x x s x x s x x k x j n (3.12)Where: xi01,i1, 2,...,m and z k are the results of integral computation for each observation. Eq (3.9) i, i
and Eq (3.10) can be rewritten in a matrix form aAZ and sAK in which
11 1 21 2 1 ( 1) 1 1 , 1 n n T m mn m n x x x x A X X X x x (3.13) 0 1 ( , ,..., ) T n a a a a , 0 1 1 1 1 , ,...,
T m m m i i i i i in i i i Z z x z x z x (3.14) 0 1 ( , ,..., ) T n s s s s , 0 1 1 1 1 , ,...,
T m m m i i i i i in i i i K k x k x k x (3.15)Therefore, a and s are computed from following equations as in [18];
1 a A Z (3.16) 1 s A K (3.17)
Finally, estimated fuzzy logistic regression model is obtained as in [17],
0 0 1 1 1 ( , ) ( , ) ... ( , ) ; 1, 2,..., i i n n in W a s a s x a s x i m (3.18) 4. Application
In this study, we discussed fuzzy logistic regression model based on possibilistic odds and applied on a real dataset “Pima India Diabetes”, where eight inputs variables and one output variable, taken from UCI Machine Learning Repository [18]. A part of the data set is shown in Table A.1. The output variable in this data set consists of two categories: “0” and “1”. “0” indicates that a patient has not diabetes and “1” indicates that a patient has diabetes. However, sometimes physicians may not make a definite decision whether a patient has diabetes, and this patient can not be categorized. In short, there may be a fuzziness about the status of the patient and classical logistic regression model cannot be applied. In order to overcome this situation, fuzzy logistic regression model could be applied.
Inputs:
X1: Number of times pregnant
X2: Plasma glucose concentration a 2 hours in an oral glucose tolerance test X3: Diastolic blood pressure (mm Hg)
X4: Triceps skin fold thickness (mm) X5: 2-Hour serum insulin (mu U/ml) X7: Diabetes pedigree function X8: Age (years)
Binary Output:
Y: Class variable which takes values 0 or 1, where “0” denotes that the patient has not diabetes and “1” denotes that the patient has diabetes.
In this study, we considered the value i of the fuzzy binary dependent variable for observation i which
can take linguistic term i {Approximately 0, Approximately 1} as the possibility of success. Since the
binary dependent variable is fuzzy, the possibilistic odds is calculated. Definitions of linguistic terms i
can be given in the form of triangular fuzzy number based on its membership function. The triangular fuzzy numbers Y corresponding to i are computed as shown in Table according to Sohn et al. [24].
Table 1. Transformations of triangular fuzzy number (i) and corresponding Y
Crisp output Linguistic terms of fuzzy
binary dependent variable i ln
1 Y 0 Approximately 0 (0.01, 0.03, 0.05) (-4.5951, -3.4761, -2.9444) 1 Approximately 1 (0.95, 0.97, 0.99) (2.9444, 3.4761, 4.5951)
In this study, we construct the fuzzy logistic regression model to describe the relationship between eight crisp inputs and a fuzzy binary output. For this reason, we integrated the fuzzy logistic regression methods proposed by Pourahmad et al. [17] and Sohn et al. [24] to define a possibility measure for each case and then use the logarithmic transformation of possibilistic odds as fuzzy output observations. By this method, Diamond [5]’s fuzzy least squares method in fuzzy linear regression can be used to estimate model parameters.
For i=1 ( 1 {Approximately 0}), estimated W1 is
1
1 1 ln 1 0 1 11 ... 8 18 1( ), 1( ) T W A A x A x f a f s-level set of W1 is calculated by:
W1
f a1( ) (1 ) ( ),f s1 f a1( ) (1 ) ( )f s1
where;1( ) 0 1 11 ... 8 18 06 1 ... 50 8
f a a a x a x a a a
1( ) 0 1 11 ... 8 18 061 ... 508
f s s s x s x s s s
-level set of w1 is computed as follows:
1
1
1 1 ( ) ( ) 1 ln 1 ( ) , ln 1 ( ) l r l r w where;
1 l1( ), r1( )
0.97 0.02(1 ), 0.970.02(1)
The squares error between w1 and W1 for i=1 is considered as follows:
2
2 1 0.97 0.02(1 ) 0.97 0.02(1 ) 1 0 ( ) ln 1 0.97 0.02(1 ) 1( ) ( 1) ( )1 ln 1 0.97 0.02(1 ) 1( ) (1 ) ( )1
SE f f a f s f a f s dFor i=2 ( {Approximately 1}), estimated 2 W2 is
2
2 2 ln 1 0 1 21 ... 8 28 2( ), 2( ) T W A A x A x f a f s -level set of W2 is calculated by:
2
2( ) (1 ) ( ), ( ) (12 2 ) ( )2
W f a f s f a f s where; 2( ) 0 1 21 ... 8 28 011 ... 318 f a a a x a x a a a 2( ) 0 1 21 ... 8 28 011 ... 318 f s s s x s x s s s -level set of w2 is computed as follows:
2
2
2 2 ( ) ( ) 2 ln 1 ( ) , ln 1 ( ) l r l r w where;
2
b b1, 2
0.03 0.02(1 ), 0.03 0.02(1 )
The squares error between w2 and W2 for i=2 is considered as follows:
2
2 1 0.03 0.02(1 ) 0.03 0.02(1 ) 2 0 ( ) ln 1 0.03 0.02(1 ) 2( ) ( 1) 2( ) ln 1 0.03 0.02(1 ) 2( ) (1 ) 2( )
SE f f a f s f a f s dAfter computing the SSE over all observations, SSE is minimized with respect to aj and sj by using Eqs
(3.9)-(3.10). Then, a and s are computed as follows:
1 9.5236, 0.1448, 0.0416, 0.0164, 0.0011, 0.0013, 0.0932,1.0357, 0.0184 a A Z
1 0.7338, 0, 0, 0, 0, 0, 0, 0 s A K where; T A X X , 768 9 1 6 50 1 1 31 1 1 23 X
768 768 768 0 1 8 1 1 1 815.9672 1213 , ,..., , .4 60258.5 53146.9 13688.6 26399.4 20166.7, , , , , , 236.817 19910.3,
i i
i i
i i T i i i Z z x z x z x
768 768 768 0 1 8 1 1 1 563.5584 2166.911 68131.13 38944.97 1157 , ,..., 3.49 44971.67 18029.69 265.9299 18733.18 , , , , , , , ,
i i
i i
i i T i i i K k x k x k xFinally, fuzzy logistic regression model is constructed as follows
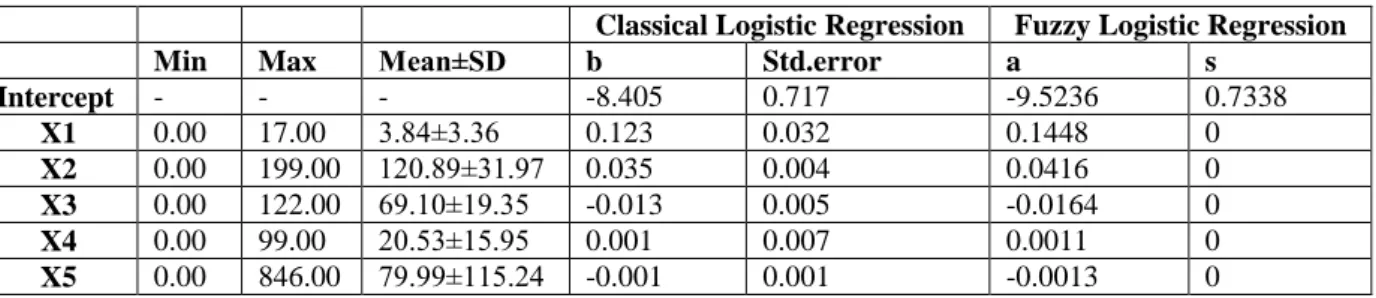
1 1 2 3 4 5 6 7 8 ln , 1, 2,..., 768 ( 9.5235, 0.7338) (0.1448, 0) (0.0416, 0) ( 0.0164, 0) (0.0011, 0) ( 0.0013, 0) (0.0932, 0) (1.0357, 0) (0.0184, 0) i i i i i i i i i W i x x x x x x x xTable 2. Characteristics of Pima India diabetes dataset and estimated parameters of classical/fuzzy logistic regression Y
Classical Logistic Regression Fuzzy Logistic Regression
Min Max Mean±SD b Std.error a s
Intercept - - - -8.405 0.717 -9.5236 0.7338 X1 0.00 17.00 3.84±3.36 0.123 0.032 0.1448 0 X2 0.00 199.00 120.89±31.97 0.035 0.004 0.0416 0 X3 0.00 122.00 69.10±19.35 -0.013 0.005 -0.0164 0 X4 0.00 99.00 20.53±15.95 0.001 0.007 0.0011 0 X5 0.00 846.00 79.99±115.24 -0.001 0.001 -0.0013 0
X6 0.00 67.10 31.99±7.88 0.090 0.015 0.0932 0
X7 0.08 2.42 0.47±0.33 0.015 0.009 1.0357 0
X8 21.00 81.00 33.24±11.76 0.945 0.299 0.0184 0
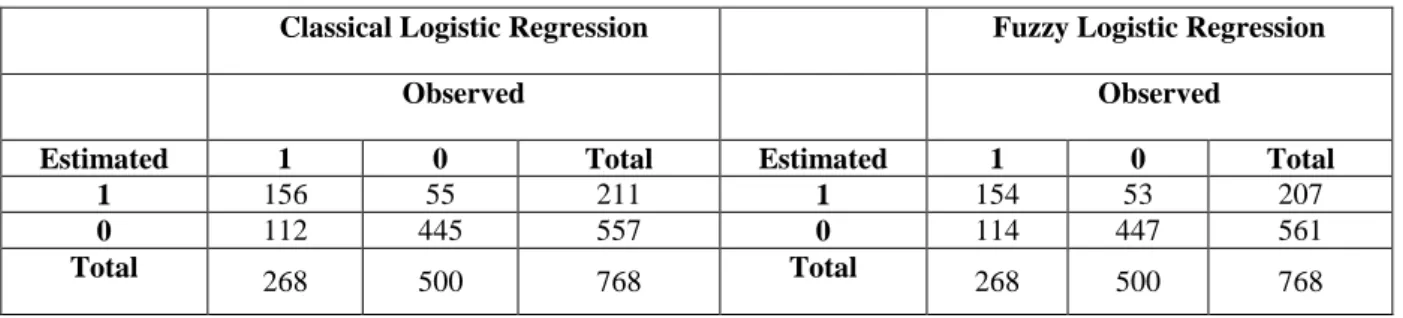
We evaluated the proposed model in terms of the sensitivity, specificity and accuracy which are frequently used to define the prediction ability of the logistic regression model with a binary output (Table A.2). In order to compute the sensitivity, specificity and accuracy by using Eqs (A.1)-(A.3), the estimated fuzzy binary output is defuzzified by using Center of Gravity (CoA) method and converted into crisp ones for fuzzy logistic regression model. Classification table for classical and fuzzy logistic regression is shown in Table 3.
Table 3. Classification table for classical/fuzzy logistic regression
Classical Logistic Regression Fuzzy Logistic Regression
Observed Observed
Estimated 1 0 Total Estimated 1 0 Total
1 156 55 211 1 154 53 207
0 112 445 557 0 114 447 561
Total 268 500 768 Total 268 500 768
Sensitivity, specificity, and accuracy are the terms that are generally associated with a binary classification test to statistically measure the performance of the test. In a binary classification, a data set is divided into two categories based on whether they have common properties or not by identifying their significance. “Sensitivity” indicates, how well the test predicts one category and “specificity” measures how well the test predicts the other category, wheares “accuracy” is expected to measure how well the test predicts both categories [1].
According to the Table 3, sensitivity, specificity and accuracy are computed as 0.8940, 0.5746 and 0.7825 for fuzzy logistic regression, while 0.8900, 0.5820 and 0.7825 for classical logistic regression. Sensitivity of the fuzzy logistic regression model is higher than that of the classical logistic regression model, whereas specifity is lower. On the other hand, accuracy is same for both method. It can be concluded that the prediction performance of fuzzy logistic regression is similar to the classical logistic regression. However, even a small increasing in sensitivity may be very important to us because the sensitivity shows how the test detects a disease. For this reason, we can conclude that the detection performance of the fuzzy logistic regression is relatively better than the classical logistic regression.
5. Conclusion
In this study, we introduced fuzzy logistic regression model with crisp dependent and fuzzy independent variables based on possibilistic odds presented by Pourahmad et al.[16, 17] and Sohn et al.[24]. We used FLS approach of Diamond [5] to estimate the parameters of the fuzzy logistic regression model. A numerical example conducted on Pima India Diabetes data set which have eight crisp input variables and one fuzzy binary output variable, is presented. Estimated parameters are obtained from both classical and fuzzy logistic regression models and classification table is set. Utilizing the classification table, we compared both methods in terms of the sensitivity, specificity and accuracy which are frequently used to define the prediction ability of the logistic regression model with a binary output. It is concluded that the detection performance of fuzzy logistic regression model is higher than classical logistic regression model according to sensitivity.
For future research, fuzzy logistic regression model based on Diamond [5]’s fuzzy least squares approach could be used to handle both fuzzy input and fuzzy output. Further, fuzzy logistic regression model based on Tanaka et al. [26]’s possibilistic approach could be used for data sets which have crisp or fuzzy input
and fuzzy output. Moreover, both possibilistic and least squares approaches for fuzzy logistic regression model should be applied and tested on complete real life problems.
References
[1] B.L. Aswathi, 2009, Sensitivity, Specificity, Accuracy and the relationship between them, in: Bioinformatics. [2] A. Celmiņš, 1987, Least squares model fitting to fuzzy vector data, Fuzzy Sets and Systems, 22, 245-269. [3] P.T. Chang, E.S. Lee, 1994, Fuzzy linear regression with spreads unrestricted in sign, Computers & Mathematics with Applications, 28, 61-70.
[4] P. D'Urso, 2003, Linear regression analysis for fuzzy/crisp input and fuzzy/crisp output data, Computational Statistics & Data Analysis, 42, 47-72.
[5] P. Diamond, 1988, Fuzzy least squares, Information Sciences, 46, 141-157.
[6] M. Hojati, C.R. Bector, K. Smimou, A simple method for computation of fuzzy linear regression, European Journal of Operational Research, 166 (2005) 172-184.
[7] C. Kao, C.-L. Chyu, 2002, A fuzzy linear regression model with better explanatory power, Fuzzy Sets and Systems, 126, 401-409.
[8] U.T. Khan, C. Valeo, 2015, A new fuzzy linear regression approach for dissolved oxygen prediction, Hydrological Sciences Journal, 60, 1096-1119.
[9] M. Ming, M. Friedman, A. Kandel, 1997, General fuzzy least squares, Fuzzy Sets and Systems, 88, 107-118. [10] M. Modarres, E. Nasrabadi, M.M. Nasrabadi, 2005, Fuzzy linear regression models with least square errors, Applied Mathematics and Computation, 163, 977-989.
[11] M. Namdari, A. Abadi, S.M. Taheri, M. Rezaei, N. Kalantari, N. Omidvar, 2014, Effect of folic acid on appetite in children: Ordinal logistic and fuzzy logistic regressions, Nutrition, 30, 274-278.
[12] M. Namdari, J.H. Yoon, A. Abadi, S.M. Taheri, S.H. Choi, 2015, Fuzzy logistic regression with least absolute deviations estimators, Soft Computing, 19, 909-917.
[13] M.M. Nasrabadi, E. Nasrabadi, A.R. Nasrabady, 2005, Fuzzy linear regression analysis: a multi-objective programming approach, Applied Mathematics and Computation, 163, 245-251.
[14] E.C. Özelkan, L. Duckstein, 2000, Multi-objective fuzzy regression: a general framework, Computers & Operations Research, 27, 635-652.
[15] G. Peters, 1994, Fuzzy linear regression with fuzzy intervals, Fuzzy Sets and Systems, 63, 45-55.
[16] S. Pourahmad, S. Ayatollahi, S.M. Taheri, 2011a, Fuzzy Logistic Regression: A New Possibilistic Model And Its Application In Clinical Vague Status, Iranian Journal of Fuzzy Systems, 8, 1-17.
[17] S. Pourahmad, S.M.T. Ayatollahi, S.M. Taheri, Z.H. Agahi, 2011b, Fuzzy logistic regression based on the least squares approach with application in clinical studies, Computers & Mathematics with Applications, 62, 3353-3365.
[18] UCI Machine Learning Repository, Pima India Data Sets.
http://archive.ics.uci.edu/ml/datasets/Pima+%20Indians+Diabetes.
[19] T.J. Ross, 2010, Fuzzy Logic with Engineering Applications, John Wiley & Sons, Ltd.
[20] M. Sakawa, H. Yano, Multiobjective fuzzy linear regression analysis for fuzzy input-output data, Fuzzy Sets and Systems, 47 (1992) 173-181.
[21] M. Sakawa, H. Yano 1992a, Fuzzy linear regression analysis for fuzzy input-output data, Information Sciences, 63, 191-206.
[22] D.A. Savic, W. Pedrycz, 1991, Evaluation of fuzzy linear regression models, Fuzzy Sets and Systems, 39, 51-63.
[23] H. Shakouri G, R. Nadimi, 2009, A novel fuzzy linear regression model based on a non-equality possibility index and optimum uncertainty, Applied Soft Computing, 9, 590-598.
[24] S.Y. Sohn, D.H. Kim, J.H. Yoon, 2016, Technology credit scoring model with fuzzy logistic regression, Applied Soft Computing, 43, 150-158.
[25] H. Tanaka, 1987, Fuzzy data analysis by possibilistic linear models, Fuzzy Sets and Systems, 24, 363-375. [26] H. Tanaka, S. Uejima, K. Asai, 1982, Linear Regression Analysis with Fuzzy Model, IEEE Transactions on Systems, Man, and Cybernetics, 12, 903-907.
[27] H. Tanaka, J. Watada, 1988, Possibilistic linear systems and their application to the linear regression model, Fuzzy Sets and Systems, 27, 275-289.
[28] M.-S. Yang, T.-S. Lin, 2002, Fuzzy least-squares linear regression analysis for fuzzy input–output data, Fuzzy Sets and Systems, 126, 389-399.
[29] J.H. Yoon, S.H. Choi, 2013, Fuzzy Least Squares Estimation with New Fuzzy Operations, in: R. Kruse, R.M. Berthold, C. Moewes, Á.M. Gil, P. Grzegorzewski, O. Hryniewicz (Eds.) Synergies of Soft Computing and Statistics for Intelligent Data Analysis, Springer Berlin Heidelberg, Berlin, Heidelberg, s. 193-202.
APPENDIX
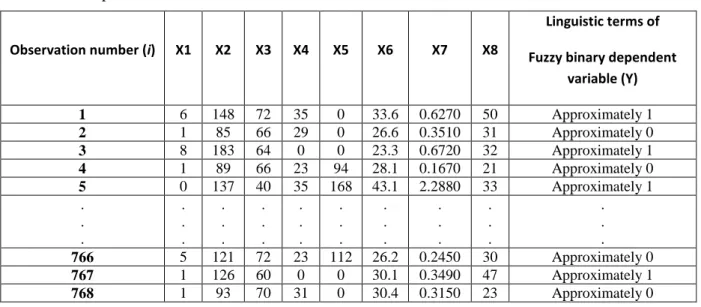
Table A.1. A part of Pima India diabetes dataset
Observation number (i) X1 X2 X3 X4 X5 X6 X7 X8
Linguistic terms of Fuzzy binary dependent
variable (Y) 1 6 148 72 35 0 33.6 0.6270 50 Approximately 1 2 1 85 66 29 0 26.6 0.3510 31 Approximately 0 3 8 183 64 0 0 23.3 0.6720 32 Approximately 1 4 1 89 66 23 94 28.1 0.1670 21 Approximately 0 5 0 137 40 35 168 43.1 2.2880 33 Approximately 1 . . . . . . . . . . . . . . . . . . . . . . . . . . . . . . 766 5 121 72 23 112 26.2 0.2450 30 Approximately 0 767 1 126 60 0 0 30.1 0.3490 47 Approximately 1 768 1 93 70 31 0 30.4 0.3150 23 Approximately 0
Table A.2. The formulas of Sensitivity, Specificity and Accuracy [24] Classical / Fuzzy Logistic Regression Observed
Estimated Pozitive Negative Total
Pozitive True Pozitive (TP) False Pozitive (FP) TP+FP Negative False Negative (FN) True Negative (TN) FN+TN
Total TP+FN FP+TN TP+FN+FP+TN
Sensitivity=1-{FP/(FP+TN)} (A.1) Specificity=1-{FN/(FN+TP)} (A.2)