Konuralp Journal of Mathematics
Research Paperhttps://dergipark.org.tr/en/pub/konuralpjournalmath
e-ISSN: 2147-625X
Data Envelopment Analysis and Efficiency Analysis of Higher
Education Institutions: Example of Selc¸uk University
Ahmet Erg ¨ulen1, Zeynep ¨Unal2*and ˙Ibrahim Harmankaya3
1Department of Business, Faculty of Ekonomics and Administrative, Balikesir University, Balikesir, Turkey
2*Department of Medical Services and Techniques, Health Services Vocational School, Nevsehir Haci Bektas Veli University, Nevsehir,
Turkey
3Social Sciences Enstitute, PhD Student, Balikesir University, Balikesir, Turkey *Corresponding author
Abstract
In this study, it was tried to determine how effective and efficient they work with input (number of academic staff, number of administrative staff, number of students,) and output (total expence, number of graduates, academic grade point average) values used by Selcuk University affiliated faculties and four year college. It is important to inform senior management about the current situation and to create insight in decisions to be taken under variable factors for the future. In this study, Selcuk University 2018 Administration Annual Report and 2018 Academic Incentive Score data were used. In this study, data envelopment analysis (DEA), which is a parameterless technique which uses linear programming principles, is used to perform relative efficiency analysis in order to enable comparison with each other. As a result of the study, relative efficiency analysis of the units were performed and evaluations were made regarding the ways in which the input and output values were not effective and the ways to be effective. If it is effective, in order to maintain the current level of activity, if the idle (unutilized capacity) capacity arose, the assessments regarding the idle capacity were made.
Keywords: Activity Measurement, Universities, Data Envelopment Analysis, Lineer Programming. 2010 Mathematics Subject Classification: 62R07, 65L03.
1. Introduction
Universities are ”institutions that produce and disseminate knowledge and educate qualified work force needed in every field according to the objectives determined [14]. It is indicated that the most distinctive feature that distinguishes universities from others among higher education institutions is their concentration on the function of study [13], Therefore, the efficient assessment of the universities is very important for the efficient distribution and use of the resources used [5] The Ministry of National Education and the Council of Higher Education are authorized and responsible for studies on improving the educational quality of higher education institutions in our country, implementation of educational activities, balanced distribution of higher education services throughout the country, to take measures to ensure equality of opportunities and opportunities for candidates to access to higher education through effective and efficient use. The fact that universities are decision-makers, have independent legal entities, and act independently in decision-making and implementation; lack of a foresight mechanism for the decisions to be taken, with the usefulness of the actions taken, and the appropriateness of the decisions taken; act independently in decision-making raises the problem of lack of knowledge of the activities of universities and units. In this study, it was tried to determine how effectively and efficiently the input and output values used by the faculties of Selcuk University and four-year high schools compared to each other. Since more than one input and output will be used in this study, the nonparametric DEA method is used. When the literature is examined in the field of Higher Education Institutions regarding Data Envelopment Analysis, which is one of the efficiency analysis techniques, some academic studies are as follows; In his study, Rosenmayer [16] compared and evaluated five articles on the evaluation of the efficiency of universities using the data envelopment analysis method.In his study, ¨Ozel [7], aimed to determine the efficiency of state universities in Turkey and to rank them in terms of super-efficiency model and efficiency. In the study of G¨und¨uz et al [12], Vocational Colleges of different universities were measured and it was concluded that the Vocational Schools increased the outputs instead of reducing the inputs to provide efficiency. Kuah and Wong [4] presented a data envelopment analysis (DEA) model to evaluate the relative teaching and research efficiency of universities together in their study. In the study, the model was tested using a hypothetical example and its use and effects in university performance measurement were explained. In the study of C¸ ınar [19], teaching and research efficiencies of 45 public universities in Turkey have been measured for 2010. As a result of the study, it was seen that universities reached different scores
Email addresses: ahmet.ergulen@balikesir.edu.tr (Ahmet Ergulen), zeynepunal@nevsehir.edu.tr (Zeynep Unal), ibrahimharmankaya@selcuk.edu.tr (Ibrahim Har-mankaya)
in terms of teaching and research efficiencies and it is shown that each university can increase the total efficiency score by giving priority to the field in which it is more effective. In his study, Bal [18] aimed to investigate the efficiencies of 23 Foundation Universities, measured their efficiencies anconcluded that inefficient universities had amount of outputs required to be increased andamount of inputs required to be decreased in order to work more efficiently and prevent wastage.
In the study of ¨Ozden [17], relative total, technical and scale efficiencies of foundation universities in Turkey were analyzed by using DEA models. In their studies, Kutlar and Babacan [3], used DEA to measure the relative effectiveness of 53 public universities. It was concluded that universities did not make good use of scale efficiency in input and output- oriented models. In their study, Kempkes and Pohl [6] analyzed the productivity of 72 German universities between 1998-2003 with DEA technique. They concluded in the study that the relative productivity of West German universities is higher. In their studies, Baysal et al [9], It was aimed to measure the relative efficiencies of 50 state universities in Turkey by DEA. In the study of G¨ulc¨u et al. [2], the efficiency of Faculty of Dentistry, Cumhuriyet University, for the years 1999-2001 was measured. In their studies, Flegg et al. [15] used DEA technique to examine the technical efficiency of 45 British universities in the periods of 1880 / 1881-1992 / 1993. In their studies, Abott and Doucouliagos [8], used DEA technique, which is one of the nonparametric techniques, to determine the technical efficiency of universities in Austria. As a result of their studies, they came to the conclusion that Austrian universities recorded higher productivity levels compared to each other. In their studies, Mcmillan and Datta [10] used DEA technique to evaluate the relative efficiency of 45 Canadian universities and made use of nine input and output specifications. The study consists of two parts, theoretical and empirical. The obtained data were dissolved in the Linear-Interactive and Discrete Optimizer (LINDO) package program and the results were evaluated. The study consists of four parts including introduction. In the introduction; the purpose of the study, the method of the study, the organization of the study and the literature review are included. In the second part, the conceptual framework of the data envelopment analysis method has been mentioned and data envelopment analysis and efficiency analysis are included. The third section includes the findings of the analysis. In the conclusion part, the findings were interpreted and evaluated.
2. Efficiency Analysis With Data Envelopment Analysis
In order to improve the performance of decision-making units, the evaluation of the activities performed at the end of certain periods is made by using some efficiency measurement methods. Data Envelopment Analysis (DEA) method is used in non-parametric efficiency measurement analyzes [11], This method; It is a linear programming (LP) based approach that allows to measure the relative total factor efficiency of DMUs in cases where there are many input and output variables with different measurement units and they cannot be reduced to a common criterion basis. Charnes-Cooper Rhodes (CCR) and Banker, Charnes-Cooper (BCC) models used in DEA; It can be set up in two different ways, input oriented and output oriented. CCR models are used in the calculation of relative total activities under the assumption of constant returns to scale, that is, based on the assumption that all Decision Making Units (DMU) operate at an optimal scale. However, in real life, there are systems that have returns that vary according to scale. Banker, Charnes and Cooper developed the BCC model, which is referred to by the initials of their names, in 1984 in order to determine the efficiency of systems with varying returns on scale. For this, they added the constraint called convexity constraint to the dual of CCR models. Primal and dual forms of input oriented CCR and BCC models are given in table 1 [17].
Tablo I: Input Oriented CCR And BCC Models Input Oriented CCR Models
Primal Dual Enb s ∑ r=1 uryrk (1) Enkqk (6) s ∑ r=1 uryr j− m ∑ i=1 vixi j (2) n ∑ j=1 λr jXi j≤ qkXik (7) k ∑ i=1 vixik− m ∑ i=1 vixi j= 1 (3) n ∑ j=1 λjkYr j≥ Yrk (8) urk≥ 0, r= 1, 2, . . . , s (4) λk j≥ 0 (8) vik≥ 0, i= 1, 2, . . . , m (5) λk j≥ 0 (9)
Input Oriented BCC Models
Primal Dual Enkqk (10) Enb s ∑ r=1 uryrk− uk (15) qkXik− n ∑ j=1 λr jXi j≥ 0 (11) s ∑ r=1 urYr j− m ∑ i=1 vixi j− uk≤ 0 (16) n ∑ j=1 λr jXi j≤ qkXik (12) m ∑ i=1 vixi j= 1 (17) n ∑ j=1 λjk= 1 (13) ur, vi≥ ε > 0 random (18) λk j≥ 0 (14) (19) On the model; Enb :maximization Enk :minimization
ur: the weight given to the r’th output by k decision units,
vi: the weight given to the i’th input by k decision units
Yrk: r’th output produced by k decision units,
Xik: i’th input used by k decision units
Xi j: i’th input used by the j’th decision-making body
ε : positive very small value, it is expressed as [17].
Data Envelopment Analysis (DEA) models were formed for all decision-making units, solved in LINDO package program and the results were evaluated. As a result of the CCR-DEA results, Dual CCR-DEA models were formed for inefficient decision-making units and solved in Lindo package program, reference sets were created. According to the reference set data, rate of change for new input values have emerged for inefficient decision-making units. BCC-DEA models were formed to see the value of returns which increases or decreases according to the scale and the results were evaluated by solving them in the LINDO package program [1].
3. Scope of the Study and Data
In the study, the faculties, colleges and conservatories affiliated to Selcuk University as Decision Making Units (DMU) will be examined according to inputs and outputs. In this study, three inputs (number of academic staff, number of administrative staff, number of students) and three outputs (total expenditure, number of grad students, academic incentive average score) of 2018 for 20 decision-making units shown in table 2 have been discussed and shown in table 3 below. The faculties and four-year colleges selected as the decision-making units in Selcuk University have been discussed.
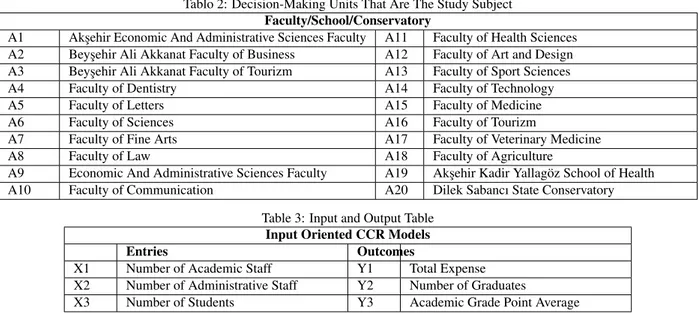
Tablo 2: Decision-Making Units That Are The Study Subject Faculty/School/Conservatory
A1 Aks¸ehir Economic And Administrative Sciences Faculty A11 Faculty of Health Sciences A2 Beys¸ehir Ali Akkanat Faculty of Business A12 Faculty of Art and Design A3 Beys¸ehir Ali Akkanat Faculty of Tourizm A13 Faculty of Sport Sciences A4 Faculty of Dentistry A14 Faculty of Technology A5 Faculty of Letters A15 Faculty of Medicine A6 Faculty of Sciences A16 Faculty of Tourizm
A7 Faculty of Fine Arts A17 Faculty of Veterinary Medicine A8 Faculty of Law A18 Faculty of Agriculture
A9 Economic And Administrative Sciences Faculty A19 Aks¸ehir Kadir Yallag¨oz School of Health A10 Faculty of Communication A20 Dilek Sabancı State Conservatory
Table 3: Input and Output Table Input Oriented CCR Models Entries Outcomes
X1 Number of Academic Staff Y1 Total Expense X2 Number of Administrative Staff Y2 Number of Graduates
X3 Number of Students Y3 Academic Grade Point Average
The data set is based on Selc¸uk University’s 2018 Administrative Activity Report and 2018 academic incentive application data, and the data set is shown in table 4.
Table 4: Data Set
ENTRIES OUTCOMES
lUnit
Codes
Decision Units Number
of Academic Staf f Number of Administrati v e Staf f Number of Students T otal Expense Number of Graduates Academic Grade Point A v erage X1 X2 X3 Y1 Y2 Y3 A1 Aksehir Faculty of Economic And Administrative Sciences 9 10 674 1.771 134 25 A2 Beysehir Ali Akkanat Faculty of Business 9 10 654 1.785 121 21 A3 Beys¸ehir Ali Akkanat Faculty of Tourizm 11 9 243 1.667 47 26 A4 Faculty of Dentistry 123 23 678 11.419 113 8 A5 Faculty of Letters 174 20 7149 18.695 1103 14 A6 Faculty of Sciences 156 26 1475 19.302 132 19 A7 Faculty of Fine Arts 54 10 1120 6.475 220 12 A8 Faculty of Law 45 15 3144 4.847 732 10 A9 Faculty of Economic And Administrative Sciences 104 15 6188 13.207 1482 19 A10 Faculty of Communication 75 12 2936 9.281 584 10 A11 Faculty of Health Sciences 84 17 2580 8.636 591 14 A12 Faculty of Art and Design 47 8 222 4.275 36 5 A13 Faculty of Sport Sciences 67 7 1295 7.663 190 15 A14 Faculty of Technology 62 11 2213 7.658 210 19 A15 Faculty of Medicine 492 11 1299 41.284 157 9 A16 Faculty of Tourizm 21 8 1336 2.825 224 25 A17 Faculty of Veterinary Medicine 134 23 1090 18.789 193 19 A18 Faculty of Agriculture 144 25 2216 18.020 375 21 A19 Aks¸ehir Kadir Yallag¨oz School of Health 15 6 576 1.724 129 3 A20 Dilek Sabancı State Conservatory 28 5 157 3.225 30 3
• Aksehir Faculty of Engineering and Architecture, Faculty of Education, Faculty of Nursing, Faculty of Pharmacy, Faculty of Islamic Sciences, School of Civil Aviation, Beys¸ehir Ali Akkanat School of Applied Sciences and C¸ umra School of Applied Sciences are not included in the data set since they did not produce any graduates yet.
• Thousands digits of total expenses have been rounded off. Actual expenses are approximately X 1000.
• The academic incentive average score has been obtained by dividing the total score of the staff who benefit from the academic incentive allowance by the total number of academic staff.
• In the number of administrative staff, only 657 civil servants have been included in the data set of the number of employees working according to the law.
4. Findings
Using the data in Table 4, input-oriented CCR-DEA models were created according to total expenditure, number of graduate students and academic incentive point average and analyzed in LINDO package program. Then, dual CCR-DEA models were created and analyzed in the LINDO package program in order to activate the ineffective DMUs in the input-oriented CCR-DEA models created according to the total expenditure, the number of graduates and the academic incentive point average. As a result of the solution of the Dual CCR-DEA models, firstly, efficiency and reference values were found for each DMU, then new input ratios and values for ineffective DMUs were found according to the reference values of the ineffective DMUs in the solution of dual CCR-DEA models. Finally, input oriented BCC-DEA models were created and analyzed in LINDO package program to determine the decreasing, fixed and increasing return values.
4.1. CCR-DEA Model Solution
By using the data in table 4 and by modelling the data of 20 units within the framework of CCR-DEA’s objective functions and constraints, it has been analysed in the LINDO package program, and the values indicated in table 5 and table 6 emerged.
Table 5: CCR-DEA Detailed Result Table Unit Codes X1 X2 X3 Y1 Y2 Y3 Efficiency A1 0,012622 - 0,001315 - 0,006297 0,006249 1 A2 0,060225 - 0,000700 0,00454 0,001566 - 1 A3 - - 0,004115 - - 0,0038462 1 A4 - - 0,001475 0,000016 0,006017 - 0,860 A5 0,003710 0,018891 -0,000003 0,000049 - - 0,918 A6 0,003536 0,017396 -0,000003 0,000046 - - 0,894 A7 0,006126 0,039716 0,000243 0,000085 0,000940 0,011450 0,895 A8 0,003554 - 0,000267 - 0,001349 0,001252 1 A9 - - 0,000162 - 0,000675 - 1 A10 0,012225 0,006927 - 0,000095 0,000083 - 0,928 A11 - - 0,000388 0,000004 0,001579 0,000532 0,972 A12 - - 0,004505 0,000092 0,012291 0,013986 0,905 A13 0,006108 0,039598 0,000242 0,000085 0,000937 0,011416 1 A14 0,010569 0,032366 -0,000005 0,000108 - 0,006775 0,954 A15 - - 0,000770 0,000024 - - 1 A16 0,008754 0,053872 0,000288 - 0,002091 0,021267 1 A17 0,002747 0,001634 0,000545 0,000050 - 0,003648 1 A18 0,005643 0,007495 - 0,000048 0,000028 0,001505 0,900 A19 - - 0,001736 0,000017 0,007071 0,002384 0,947 A20 - - 0,006369 0,000130 0,017380 0,019777 1
Tablo 6: CCR-DEA Result Table Unit
Codes
Efficiency Unit Codes Efficiency A1 1 A11 0,972 A2 1 A12 0,905 A3 1 A13 1 A4 0,860 A14 0,954 A5 0,918 A15 1 A6 0,894 A16 1 A7 0,895 A17 1 A8 1 A18 0,900 A9 1 A19 0,947 A10 0,928 A20 1
When examining the result of values as a result of analysis, it can be said that the decision-making units of A1, A2, A3, A8, A9, A13, A15, A16, A17, A20 were efficient and decision-making units of A4, A5, A6, A7, A10, A11, A12, A14, A18 and A19 were inefficient. In this case, we can determine the reference sets and shadow prices by analysing the dual models in order to enable the decision-making units of A4, A5, A6, A7, A10, A11, A12, A14, A18 and A19. Accordingly, when examining the table given above, it is seen that 10 of 20 decision-making units have reached the efficiency value and 10 of them are not completely efficient. In the light of the data obtained, by forming a reference set for efficient units and inefficient units, in other words, by taking efficient decision-making units as reference for inefficient decision-making units, input and output values will be prepared again. Dual CCR-DEA model shall be installed in order to find and enable reference set for inefficient unit. This model installed has been solved in the LINDO package program and the reference set table specified in table 7 below has been created.
4.2. Dual CCR-DEA Model Solution
In order to enable the decision–making units of the A4, A5, A6, A7, A10, A11, A12, A14, A18 and A19 decision units which are not completely efficient in the CCR-DEA model, the reference sets are obtained by analysing them in the Dual CCR-DEA model, as seen on table 7.
Table 7: Efficiency Value and Reference Set for Decision-making Units in Dual CCR-DEA Model Unit
Codes
Efficiency Reference Set Decision Variable
A1 1 K1 -A2 1 K2 -A3 1 K3 -A4 0,860 K9,K20 0,004986-3,520356 A5 0,914 K9,K13,K15 0,566437-1,373219-0,016740 A6 0,894 K15,K17 0,009451-1,006537 A7 0,895 K3,K9,K13,K15,K17 0,203523-0,109781-0,010571-0,005880-0,232162 A8 1 K8 -A9 1 K9 -A10 0,928 K2,K9,K17 0,025831-0,360990-0,237762 A11 0,972 K3,K9,K20 0,141754-0,372441-1,079339 A12 0,905 K3,K15,K20 0,074184-0,026884-0,943084 A13 1 K13 -A14 0,950 K9,K13,K16,K17 0,013515-0,309846-0,403420-0,211054 A15 1 K15 -A16 1 K16 -A17 1 K17 -A18 0,900 K1,K9,K16,K17 0,058875-0,131614-0,030180-0,856472 A19 0,947 K3,K9,K20 0,034504-0,082314-0,179648 A20 1 K20
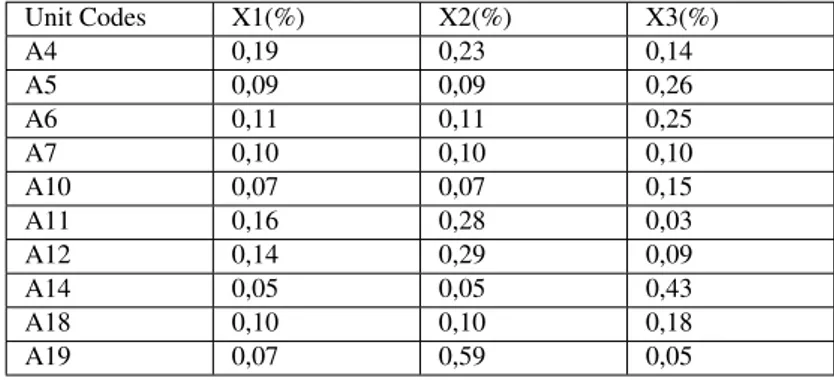
-After the determination of reference sets by analysing the Dual CCR-DEA model, it is provided to increase the outputs of the inefficient decision-making unit, whether its inputs are used as idle, or to reduce it within the determined ratios and to make this decision-making unit efficient. After the calculations using the decision variables in the reference set, the percentage change with the positive value indicated in Table 8 means that the same performance will be delivered even if it is at a lower level where idle capacity is existing. The percentage change with the negative value means to increase the amount of input in order to be efficient.
Table 8: Table of New Input Change Rates for Inefficient Decision-making Units Unit Codes X1(%) X2(%) X3(%) A4 0,19 0,23 0,14 A5 0,09 0,09 0,26 A6 0,11 0,11 0,25 A7 0,10 0,10 0,10 A10 0,07 0,07 0,15 A11 0,16 0,28 0,03 A12 0,14 0,29 0,09 A14 0,05 0,05 0,43 A18 0,10 0,10 0,18 A19 0,07 0,59 0,05
4.3. BCC-DEA Model Solution
In the CCR-DEA model, it is acted with the assumption that decision-making units are subject to a constant return scale. And in the BCC-DEA model, because the efficiency limits are more flexible and because the decreasing and increasing income scale situations are taken into account, the values might be different. However, CCR-DEA and BCC-DEA results were the same in our result table. Because it is U0 = 0 in all decision-making units, it is possible to talk about a constant return for all decision-making units, according to the scale. This situation shows us that any changes which may occur in inputs for all decision-making units may affect the outputs at the same rate. In line with the BCC-DEA objective functions and constraints, BCC-DEA modeling was performed for all DMUs (Decision-making units) and the efficiency results indicated in Table 9 were obtained.
Table 9: BCC-DEA Efficiency Results for All Decision-making Units Unit Codes Efficiency U0
A1 1 0
A2 1 0
A3 1 0
A4 0,860 0
Continuation Of Table 9: BCC-DEA Efficiency Results for All Decision-making Units Unit Codes Efficiency U0
A6 0,894 0 A7 0,895 0 A8 1 0 A9 1 0 A10 0,928 0 A11 0,972 0 A12 0,905 0 A13 1 0 A14 0,954 0 A15 1 0 A16 1 0 A17 1 0 A18 0,900 0 A19 0,947 0 A20 1 0
5. Conclusion
The distribution of resources between Faculties and Schools in different amounts can be shown as one of the main reasons for developmental differences. As a result of this study performed, some important findings were found. These can be expressed as follows; As a result of the application of the input-oriented CCR-DEA model, 10 out of 20 Faculties and Schools were found completely effecient. Faculty of Dentistry, Faculty of Literature, Faculty of Science, Faculty of Fine Arts, Faculty of Communication, Faculty of Health Sciences, Faculty of Art and Design, Faculty of Technology, Faculty of Agriculture, Aksehir Kadir Yallagoz School of Health, which were 10 out of 20 Faculties and Schools, could not be able to reach complete efficiency. Dual CCR-DEA model was formed to create a reference set for these regions which did not reach complete efficiency and the same regions also did not reach complete efficiency in this model. As a result of the calculation made by using the reference set, it is concluded that there was an idle capacity as much as positive values as specified Table 7 in the input amounts of the regions that cannot achieve complete efficiency (number of academic staff, number of administrative staff, number of students), in other words, input amounts can be reduced in order to remain at the same efficiency level. Although not included in the results, the amount of input should be increased as well as changes with negative value. If these changes can be realized, the efficiency value, which characterizes the most efficient use of the resources available, shall appear to be 1. BCC-DEA models have been formed to examine increasing returns, fixed returns and decreasing returns, and as a result of obtaining the value of U0 = 0 for all units, it is possible to talk about constant returns for all regions.In other words, the change that it will create in the input amounts of all regions will be at equal rate in output value. Aksehir Faculty of Economics and Administrative Sciences, Beysehir Ali Akkanat Faculty of Management, Beysehir Ali Akkanat Faculty of Tourism, Faculty of Law, Faculty of Economics and Administrative Sciences, Faculty of Sport Sciences, Faculty of Medicine, Faculty of Tourism, Veterinary Faculty, Dilek Sabancı State Conservatory have reached complete efficiency. The Faculty of Dentistry, which is expected to be at the top level, has the lowest efficiency rate. The other faculties have reached an efficiency rate above the medium level. Based on the results emerged as a result of said study, it is seen that there is an idle capacity in input values in comparison with output values. However, considering the fact that the output values are generally low, situations such as ranging the academic incentive average scoren from 3 to 26, non-use of those below 30 score in the application pursuant to the regulation and taking maximum 30 from the activity included in the same category, are among the negative issues. . Because the number of faculty members per grad student in the education units with application education is high and it occurred the reverse situation in other units, it affects the high efficiency in schools where there is no applied education, but where more theoretical education is given. It could be considered as disadvantages not to include permanent personnel in the expenditure items, although they are included within the scope of administrative personnel, not to involve them in the number of administrative personnel and to have complex job descriptions. The results revealing that the policies carried out to reduce the development differences were successful, even partially. However, it can be said that the efficiency levels of the developed units were found to be lower than expected. Another factor, that needs to be considered as much as the efficient use of resources, is the relative distribution intensity of resources. Significant differences were observed between some units in the amount of input. Therefore, inefficient units should increase their efficiencies or take measures to reduce input amounts.
Acknowledgement
This article has been presented as an oral notification at the ICMME 2019: International Conference on Mathematics and Mathematics Education held between June 11, 2019 at June 13, 2019 in Konya.
References
[1] A. Erg¨ulen, H. Kazan and ˙I. Harmankaya, T¨urkiye’de 1992’de Kurulan Devlet ¨Universitelerinin, Veri Zarflama Analizi Y¨ontemiyle, Performans De˘gerlendirmesi: Co˘grafi B¨olge Uygulaması. Avrasya Bilimler Akademisi ˙Is¸letme ve ˙Iktisat Dergisi, (2), (2016, Ekim), 666-676.
[2] A. G¨ulc¨u, A. Cos¸kun, C. Yes¸ilyurt, S. Cos¸kun ve T. Esener, Cumhuriyet ¨Universitesi Dis¸ Hekimli˘gi Fak¨ultesi’nin Veri Zarflama Analizi Y¨ontemiyle G¨oreceli Etkinlik Analizi. Cumhuriyet ¨Universitesi Iktisadi ve Idari Bilimler Fak¨ultesi Dergisi, 5(2), (2004), 87-104.
[3] A. Kutlar ve A. Babacan, T¨urkiye’deki Kamu ¨Universitelerinde Ccr Etkinli˘gi- ¨Olc¸ek Etkinli˘gi Analizi: DEA Etkinli˘gi Uygulamasi. Kocaeli ¨Universitesi Sosyal Bilimler Enstit¨us¨u Dergisi. 15(1), (2008), 148-172.
[5] D. Baylı, T¨urkiye’de ki Devlet ¨Universitelerinin Etkinlik Analizleri (Veri Zarflama Analizi ˙Ile Bir Uygulama). Y¨uksek Lisans Tezi, Ege ¨Universitesi, ˙Izmir, (2013).
[6] G. Kempkes, C. Pohl, The Efficiency Of German Universities – Some Evidence Form Non-Parametric And Parametric Methods. Ifo Working Paper No. 36, 2006.
[7] G. ¨Ozel, Devlet ¨Universitelerinin Etkinlik Analizi: T¨urkiye ¨Orne˘gi. Hacettepe ¨Universitesi E˘gitim Fak¨ultesi Dergisi. 29(3), (2014), 124-136. [8] M. Abott and C. Doucouliagos, The efficiency of Australian universities: a data envelopment analysis. Economics of Education Review. 22, (2013), pp.
89-97. DOI: 10.1016/S0272-7757(01)00068-1
[9] M. E. Baysal, B. Alc¸ılar, H. C¸ erc¸io˘glu ve B. Toklu, T¨urkiye’de ki Devlet ¨Universitelerinin Performanslarının Veri Zarflama Analizi Y¨ontemiyle Belirlenip Buna G¨ore 2005 Yılı B¨utc¸e Tahsislerinin Yapılması. SAU Fen Bilimleri Enstit¨us¨u Dergisi, 9(1), (2005), 67-73.
[10] M. Mcmillan and D. Datta, The Relative Efficiencies Of Canadian Universities: A Dea Perspective. Canadian Public Policy. University Of Toronto Press, 24(4), (1998), Pp. 485-511.
[11] M. S. Is¸ıldak, A. C¸ ic¸ek, ˙I. K¨oksal, Bazi Devlet ¨Universitelerinin Veri Zarflama Analizi (Vza) Y¨ontemi ˙Ile Etkinlik Analizi, Atlas International Referred Journal On Social Sciences,4(9), (2018), 346-361.
[12] O. G¨und¨uz, V. Ceyhan ve K. Eseng¨un, Farklı ¨Universitelerin Meslek Y¨uksekokullarının Etkinlik D¨uzeylerinin Kars¸ılas¸tırılması ¨Uzerine Bir Aras¸tırma, KM ¨U Sosyal ve Ekonomik Aras¸tırmalar Dergisi. 15(25), (2013), 67-77. 2019 tarihinde alındı.
[13] O. K. Oruc¸, Veri Zarflama Analizi ˙Ile Bulanık Ortamda Etkinlik ¨Olc¸¨umleri ve ¨Universitelerde Bir Uygulama, Doktora Tezi, S¨uleyman Demirel ¨
Universitesi. Isparta, (2008).
[14] S. Ercis¸, T¨urkiye’de ki Devlet ve Vakıf ¨Universitelerinin Spor M¨usabakalarındaki Verimliliklerinin Veri Zarflama Analizi (VZA) ˙Ile G¨oreceli Olarak De˘gerlendirilmesi ve Kars¸ılas¸tırılması. Doktora Tezi, Atat¨urk ¨Universitesi. Erzurum, (2012).
[15] T. Flegg, D. O. Allen, K. Field, and W. T. Thurlow, Measuring the efficiency of British universities: a multiperiod data envelopment analysis. Economics of Education Review, 12 (3), (2004), 231-249.
[16] T. Rosenmayer, Using Data Envelopment Analysis: a Case of Universities, Review Of Economic Perspectives , N´arodohospod´aˇrsk´y Obzor, 14(1), (2014), 34-54.
[17] ¨U. H. ¨Ozden, Veri Zarflama Analizi Ile T¨urkiye’deki Vakıf ¨Universitelerinin Etkinli˘ginin ¨Olc¸¨ulmesi.Istanbul ¨Universitesi Is¸letme Fak¨ultesi Dergisi 37(2), (2008), 167-185. 2019 tarihinde alındı.
[18] V. Bal, Vakıf ¨Universitelerinde Veri Zarflama Analizi ˙Ile Etkinlik Belirlenmesi, Manas Sosyal Aras¸tırmalar Dergisi, 2(5), (2003), 1-20.
[19] Y. C¸ ınar, T¨urkiye’de Kamu ¨Universitelerinin E˘gitim-Aras¸tırma Etkinlikleri ve Etkinlik Artıs¸ında Stratejik ¨Onceliklerin Rol¨u: C¸ ok Aktiviteli VZA Uygulaması. Ankara ¨Universitesi Siyasal Bilgiler Fak¨ultesi Dergisi, 68(2), (2013), 27-62. 2019 tarihinde alındı.