African Journal of Business Management Vol. 5(3), pp. 889-901, 4 February, 2011 Available online at http://www.academicjournals.org/AJBM
DOI: 10.5897/AJBM10.584
ISSN 1993-8233 ©2011 Academic Journals
Full Length Research Paper
Measuring bank branch performance using Data
Envelopment Analysis (DEA): The case of Turkish bank
branches
Mehmet Hasan Eken
1and Suleyman Kale
21
Finance and Banking PhD Programme,Institute of Social Sciences,Kadir Has University, Istanbul, Turkey. 2
T.C. Ziraat Bank, Sirinevler Branch, Istanbul, Turkey.
Accepted 15 November, 2010
The aim of this study is to develop a performance model for measuring the relative efficiency and potential improvement capabilities of bank branches by identifying their strengths and weaknesses. Another purpose is to investigate the production and profitability aspects of branches. Under both production and profitability approaches, efficiency characteristics of branches, which are grouped according to different sizes and regions, have similar tendencies. In both analyses, it is apparent that branch size and scale efficiency are related to each other. As branch size increases scale efficiency increases too and after the most productive scale size, however, as size increases efficiency decreases. Too small and too large branches need special attention. Putting production and profit efficiency scores on two scales reveals the performing characteristics of branches. Each region needs different handling. Branches with low production-low profit efficiency should be evolved towards high production-high profit efficiency region.
Key words: Data envelopment analysis, bank branch performance, efficiency, technical efficiency, pure technical efficiency, scale efficiency.
INTRODUCTION
Data Envelopment Analysis (DEA) is a non-parametric performance measurement tool that can be used for analysis and decision making in branch banking. That is because not only it sorts branches according to their performances but also provides much more information that cannot be investigated with other methods such as ratio analysis. The most common strengths of DEA include that it benchmarks branches, it provides potential improvement capabilities, it indicates sources of inefficiency and it takes management preferences into account when measuring performances.
By employing DEA, different aspects of branch efficiency can be further analyzed. Production approach analyses branches’ success at producing deposits, loans
*Corresponding author. E-mail: [email protected]. Tel: ++ 90 212 533 65 32 ext. 1653 Fax: ++ 90 212 533 63 61 JEL classification: C14, C61, G21.
and other products by making use of some resources like personnel and other expenditures. Profitability approach measures the efficiency of using resources to maximize profit of a branch. In operational approach, mostly transaction side of a branch is measured. Intermediation approach estimates the efficiency of converting deposits into loans. Inputs and outputs are specified in accordance with what we want to learn about branch. Production efficiency, profitability efficiency, operational efficiency and intermediation efficiency can separately be studied and they can also be combined into a single model having multiple dimensions. All dimensions constitute a model and provide an analysis and decision making tool for management.
The first aim of this study is to develop a performance model for measuring the relative efficiency and improvement capabilities of bank branches by identifying their strengths and weaknesses. Another purpose is to investigate the production and profitability dimensions of branches in order to reveal their performing characteristics.
Data envelopment analysis
Frontier based efficiency measurement goes back to Farrell (1957) who proposed a model that can be applied from a sector to a whole economy. Not only developed a technique to measure the overall efficiency but also he divided the efficiency into its components. Charnes et al. (1978) (CCR) put into practice Farrell’s view for the first time and named the model as Data Envelopment Analysis. The CCR model of DEA assumes frontier to have Constant Returns to Scale (CRS) characteristics. Banker et al. (1984) (BCC) relaxed CRS assumption and introduced VRS frontier. After these two basic models, many variations, options, contributions, Slack Based Models, Free Disposal Hull, Stochastic DEA, Network DEA, Dynamic DEA, Super Efficiency Models etc, have also been developed.
DEA measures efficiency of a Decision Making Unit (DMU) by maximizing the ratio of weighted outputs over weighted inputs. This ratio is normalized according to best practical peers and efficiency is calculated to be be-tween 0 and 1, as 1 representing efficient unit. To solve the problem, fractional ratio is first converted to linear form and then the dual case is measured with simplex method of linear programming. By benchmarking, either input minimization or output maximization (or both, non-oriented) is intended. Preferences about inputs and outputs and external factors effecting efficiency can be incorporated into model. Historical progress of efficiency can also be calculated.
LITERATURE REVIEW
After the article of Sherman and Gold (1985), numerous studies have been conducted on bank branch efficiency worldwide. Due to the fact that it is easier to attain publicly available data at bank level, the number of bank performance measurement studies is greater than branch efficiency studies. Fethi and Pasiouras (2009) specify 136 studies that use DEA-like techniques to estimate bank efficiency, while only 28 studies about branch effi-ciency are listed. Of the 28 studies, 17 adopt production and 12 adopt intermediation approach. Paradi et al. (2004) also, list 42 studies, of which 23 use CCR, 13 use BCC and the remaining 6 use both. Although, early studies measured extent and sources of inefficiencies and aimed to minimize operational costs by looking at optimal operational structure, recent studies have developed new perspectives to raise awareness about different dimensions of branch operations. And also, hybrid applications of DEA and other methods have been put into practice. This provides valuable information for management to implement required strategies according to problematic area.
Manandhar and Tang (2002) incorporated intangible aspects, e.g. the internal service quality, into DEA. They
considered internal service quality, operating efficiency and profitability as dimensions of performance. Portela and Thanassoulis (2007) analyzed the three dimensions of branch performance: Usage of new transaction channels, efficiency in increasing sales and customer base and generating profits. Relations between ope-rational and profit efficiencies and also transactional and operational efficiencies were identified. Comparison of different dimensions allows us to see superior and inferior branches. They found positive links between operational and profit efficiency and also between transactional and operational efficiency. Service quality is positively related with operational and profit efficiency.
Giokas (2008a) also studied the efficiency of 44 branches in Greece by searching three perspectives: Efficiency in managing the economic record of the branches (production efficiency), efficiency in meeting the demand for transactions with customers (transaction efficiency) and efficiency in generating profits (profit efficiency). All models indicated that there is a scope for substantial efficiency improvements and again all models identified essentially the same worst performing branches. Gaganis et al. (2009), in first stage, examined the profit efficiency, the effect of risk factor (loan loss provisions) on profit efficiency and the Total Factor Productivity (TFP) change. In the second stage they analyzed the impact of some internal and external para-meters, such as personnel, income per capita, loans to total assets ratio, loans to deposit ratio, return on assets, on efficiency.
Paradi et al. (2010) evaluated the bank branch efficiency in two stages. From the point that a single-perspective evaluation cannot fully reflect a branch’s multi-function nature, they first measured production, profitability and intermediation efficiency of branches and then aggregated the results with modified Slack Based Model to generate a composite performance index for each branch. Oral and Yolalan (1990) studied the opera-tional efficiency of 20 Turkish commercial bank branches. They indicate that DEA is complementary to traditional financial ratios method and also it is a useful tool in reallocating resources between the branches in order to achieve higher efficiencies.
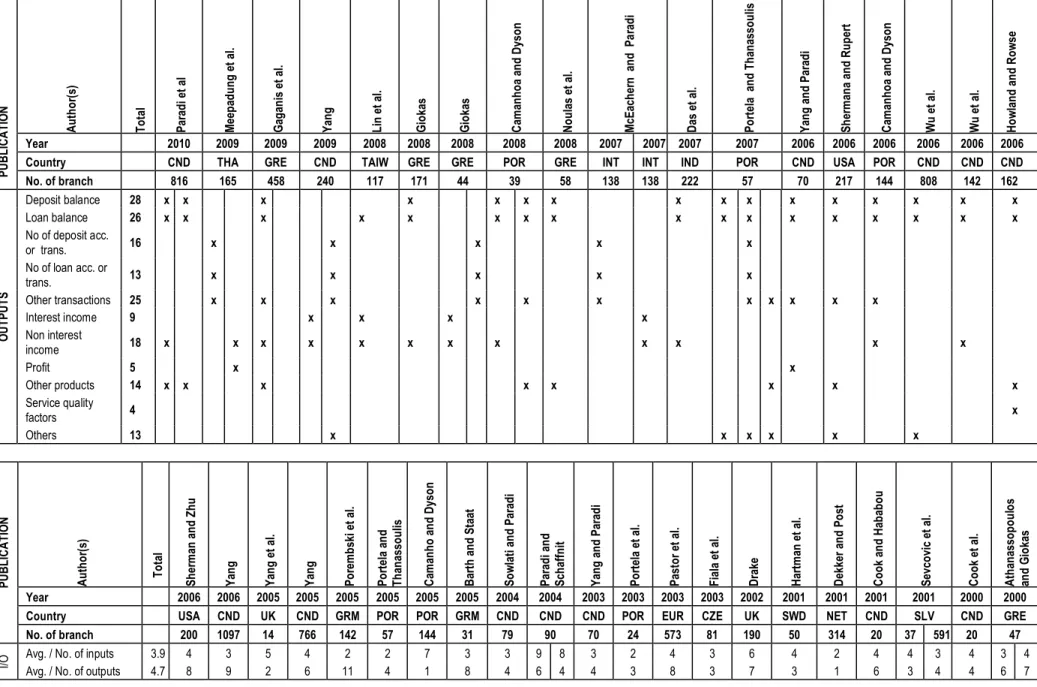
To have a general view and constitute our models and to decide for input and output parameters, a comprehensive literature review has been conducted. 39 articles, published after 2000 and containing more than 49 studies/ approaches were analyzed (Table 1). In 33 studies production/operation approach, in 7 studies profitability approach is used. In 27 studies CCR and in 29 studies BCC model is employed. In 36 studies input oriented and in 12 studies output oriented approaches are considered. Average number of inputs is 3.9 and, de-pending on the accepted approach, the most used inputs are related to employee, other operating expenses, rental area or expenses and other equipments. Outputs have wider range of diversity with an average number of 4.7.
Eken and Kale 891
Table 1. Studies about bank branch performance published after year 2000.
P U B L IC A T IO N A u th o r( s) T o ta l P ar ad i e t al M ee p ad u n g e t al . G ag an is e t al . Y an g L in e t al . G io ka s G io ka s C am an h o a an d D ys o n N o u la s et a l. M cE ac h er n a n d P a ra d i D as e t al . P o rt el a a n d T h an as so u lis Y an g a n d P ar ad i S h er m an a an d R u p er t C am an h o a an d D ys o n W u e t al . W u e t al . H o w la n d a n d R o w se Year 2010 2009 2009 2009 2008 2008 2008 2008 2008 2007 2007 2007 2007 2006 2006 2006 2006 2006 2006
Country CND THA GRE CND TAIW GRE GRE POR GRE INT INT IND POR CND USA POR CND CND CND
No. of branch 816 165 458 240 117 171 44 39 58 138 138 222 57 70 217 144 808 142 162
I/O Avg / No. of Inputs 3.9 6 5 9 9 4 3 4 4 3 2 2 2 4 2 3 3 4 2 3 3 4 2 7 2 4
Avg / No. of Outputs 4.7 7 6 9 2 8 2 9 3 3 2 3 3 4 4 2 2 3 4 7 3 4 7 4 6 3 4
4 A P P R O A C H Production/Operation 33 x x x x x x x x x x x x x x x Intermediation 7 x x x x x x Profitability 7 x x x x Other 6 x x D E A M O D E L CCR 27 x x x x x x x x x x x x BCC 29 x x x x x x x x x x x x x x Other DEA 11 x x x x x Others (FDH or Modified) 8 x x x x O R IE N T A T IO N Input 36 x x x x x x x x x x x x x x x x x x x x Output 12 x x x x x x Non-oreinted 5 x IN P U T S Personnel related 46 x x x x x x x x x x x x x x x x x x x x x x
Nonpersonnal Oper. Exp. 32 x x x x x x x x x x x x x x x x x
Location (area, rent etc) 15 x x x x x
Equipments 13 x x x x x x Loan losses 5 x x x Interest expenses 5 x x x x Input Prices 1 2006 Environmental factors 7 CND x x x Others 8 x x x x x 162 x
Table 1. Contd. P U B L IC A T IO N A u th o r( s) T o ta l P ar ad i e t al M ee p ad u n g e t al . G ag an is e t al . Y an g L in e t al . G io ka s G io ka s C am an h o a an d D ys o n N o u la s et a l. M cE ac h er n a n d P a ra d i D as e t al . P o rt el a a n d T h an as so u lis Y an g a n d P ar ad i S h er m an a an d R u p er t C am an h o a an d D ys o n W u e t al . W u e t al . H o w la n d a n d R o w se Year 2010 2009 2009 2009 2008 2008 2008 2008 2008 2007 2007 2007 2007 2006 2006 2006 2006 2006 2006
Country CND THA GRE CND TAIW GRE GRE POR GRE INT INT IND POR CND USA POR CND CND CND
No. of branch 816 165 458 240 117 171 44 39 58 138 138 222 57 70 217 144 808 142 162 O U T P U T S Deposit balance 28 x x x x x x x x x x x x x x x x Loan balance 26 x x x x x x x x x x x x x x x x x No of deposit acc. or trans. 16 x x x x x No of loan acc. or trans. 13 x x x x x Other transactions 25 x x x x x x x x x x x Interest income 9 x x x x Non interest income 18 x x x x x x x x x x x x Profit 5 x x Other products 14 x x x x x x x x Service quality factors 4 x Others 13 x x x x x x P U B L IC A T IO N A u th o r( s) T o ta l S h er m an a n d Z h u Y an g Y an g e t al . Y an g P o re m b sk i e t al . P o rt el a an d T h an as so u lis C am an h o a n d D ys o n B ar th a n d S ta at S o w la ti a n d P ar ad i P ar ad i a n d S ch af fn it Y an g a n d P ar ad i P o rt el a et a l. P as to r et a l. F ia la e t al . D ra ke H ar tm an e t al . D ek ke r an d P o st C o o k an d H ab ab o u S ev co vi c et a l. C o o k et a l. A th an as so p o u lo s an d G io ka s Year 2006 2006 2005 2005 2005 2005 2005 2005 2004 2004 2003 2003 2003 2003 2002 2001 2001 2001 2001 2000 2000
Country USA CND UK CND GRM POR POR GRM CND CND CND POR EUR CZE UK SWD NET CND SLV CND GRE
No. of branch 200 1097 14 766 142 57 144 31 79 90 70 24 573 81 190 50 314 20 37 591 20 47
I/O Avg. / No. of inputs 3.9 4 3 5 4 2 2 7 3 3 9 8 3 2 4 3 6 4 2 4 4 3 4 3 4
Eken and Kale 893 Table 1. Contd. P U B L IC A T IO N A u th o r( s) To ta l S h er m an a n d Z h u Y an g Y an g e t al . Y an g P o re m b sk i e t al . P o rt el a an d T h an as so u lis C am an h o a n d D ys o n B ar th a n d S ta at S o w la ti a n d P ar ad i P ar ad i a n d S ch af fn it Y an g a n d P ar ad i P o rt el a et a l. P as to r et a l. F ia la e t al . D ra ke H ar tm an e t al . D ek ke r an d P o st C o o k an d H ab ab o u S ev co vi c et a l. C o o k et a l. A th an as so p o u lo s an d G io ka s Year 2006 2006 2005 2005 2005 2005 2005 2005 2004 2004 2003 2003 2003 2003 2002 2001 2001 2001 2001 2000 2000 Country USA CND UK CND GRM POR POR GRM CND CND CND POR EUR CZE UK SWD NET CND SLV CND GRE No. of branch 200 1097 14 766 142 57 144 31 79 90 70 24 573 81 190 50 314 20 37 591 20 47 A P P R O A C H Production/Operation 33 x x x x x x x x x x x x x x x x x x Intermediation 7 x x Profitability 7 x x Other 6 x x x x D E A M O D E L CCR 27 x x x x x x x x x x x x x x x BCC 29 x x x x x x x x x x x x x x x Other DEA 11 x x x x x x Others (FDH or Modified) 8 x x x x O R IE N T A T IO N Input 36 x x x x x x x x x x x x x x x x Output 12 x x x x x x x Non-oriented 5 x x x x IN P U T S Personnel related 46 x x x x x x x x x x x x x x x x x x x x x x x Non-personnal Oper. Exp. 32 x x x x x x x x x x x x x x x Location (area, rent etc) 15 x x x x x x x x x x Equipments 13 x x x x x x x x Loan losses 5 x x Interest expenses 5 x Input prices 1 x Environmental factors 7 x x x x Others 8 x x
P U B L IC A T IO N A u th o r( s) T o ta l S h er m an a n d Z h u Y an g Y an g e t al . Y an g P o re m b sk i e t al . P o rt el a an d T h an as so u lis C am an h o a n d D ys o n B ar th a n d S ta at S o w la ti a n d P ar ad i P ar ad i a n d S ch af fn it Y an g a n d P ar ad i P o rt el a et a l. P as to r et a l. F ia la e t al . D ra ke H ar tm an e t al . D ek ke r an d P o st C o o k an d H ab ab o u S ev co vi c et a l. C o o k et a l. A th an as so p o u lo s an d G io ka s Year 2006 2006 2005 2005 2005 2005 2005 2005 2004 2004 2003 2003 2003 2003 2002 2001 2001 2001 2001 2000 2000
Country USA CND UK CND GRM POR POR GRM CND CND CND POR EUR CZE UK SWD NET CND SLV CND GRE
No. of branch 200 1097 14 766 142 57 144 31 79 90 70 24 573 81 190 50 314 20 37 591 20 47 O U T P U T S Deposit balance 28 x x x x x x x x x x x x Loan balance 26 x x x x x x x x x No of deposit acc. or trans. 16 x x x x x x x x x x x No of loan acc. or trans. 13 x x x x x x x x Other transactions 25 x x x x x x x x x x x x x x Interest Income 9 x x x x x Non-interest income 18 x x x x x x Profit 5 x x x Other products 14 x x x x x x
Service quality factors 4 x x x
Others 13 x x x x x x x
with an average number of 4.7. The most used outputs are value/number of deposits, loans, non-interest income and commissions and account/ transaction numbers. Table 1, naturally, does not reflect about how to implement the model. Specifying inputs and outputs, deciding the model and orientation depend on the purpose of the research.
METHOD AND DATA ANALYSIS
In this study 128 bank branches located in Istanbul City and Thrace region of Turkey are handled. All these branches employ the same inputs and produce the same outputs and operate in a similar environment. For
production approach 3 inputs and 8 outputs, for profitability approach the same 3 inputs and 2 outputs are used. 2007 year-end data of inputs and outputs and descriptive statistics are listed in Table 2. Since non interest income is assumed to be an index, covering all items other than interest bearing products, it is also included in production approach as an output. Management is assumed to have control on all parameters. Service quality and customer satisfaction are two important aspects in banking sector. Since we could not obtain any regular data about service quality and its measurement is not covered by the scope of this study, no service quality parameter is included in our calculations.
First, by considering production approach and using output oriented CCR and BCC models, technical, pure technical and scale efficiency of branches are calculated. By benchmarking efficient and inefficient branches, their references and improvement capabilities are measured.
Branches are grouped according to different size (small, medium and large) and regional properties and their efficiencies are calculated and analysed accordingly. For size classification, a set of criteria such as; weighting time deposits 43%, demand deposit 12%, loans 25%, profit 10%, volume of treasury accounts 5% and ratio of non interest income to operation cost 5%,is used. By applying BCC model and calculating scale efficiency, returns to scale characteristics of branches are also determined. As discussed in Sherman and Zhu (2006) Returns To Scale (RTS) characteristics of a DMU may be different in input and output orientations. All branches on Variable Returns to Scale (VRS) frontier (pure technically efficient) have the same RTS characteristics according to input and output orientation. But the branches that are not on VRS frontier (non efficient or projected branches) may have different RTS characteristics according to input and output orienta-tion. At this point, running BCC model with input and output
Eken and Kale 895
Table 2. Inputs and outputs of production and profitability approaches and descriptive statistics.
Input and output of production and profitability Max Min Average SD Coeff. of Var. Inputs of both approaches Personnel expenses 1,785 168 710 346 0.487 Operating expenses 1,209 69 311 205 0.659 Loan losses 2,608 0 93 267 2.871 Outputs of production approach Demand deposits 165,959 572 8,345 17,608 2.110 Time deposits 455,663 2,538 79,142 73,610 0.930 Demand FX deposits 9,050 12 2,017 1,835 0.910 Time FX deposits 45,728 112 10,096 8,399 0.832 Commercial loans 39,093 90 4,321 5,445 1.260 Consumer loans 39,710 769 9,949 6,555 0.659 No of total transaction 857,195 32,356 226,633 124,185 0.548 Non-interest income 4,430 108 1,060 827 0.780 Outputs of profitability App.
Net interest income 29,520 174 2,485 3,355 1.350
Non Interest Income 4,430 108 1,060 827 0.780
orientations helps us to locate the branches on input-output plane. We can see the RTS consistency in different orientations. The branches which do not operate on most productive scale size and their properties are discussed. Large branches are expected, mostly, to lie on Decreasing Returns to Scale (DRS) region and small branches on Increasing Returns to Scale (IRS) region. A branch should be treated according to RTS characteristics that it posses. The results of efficiency and RTS characteristics imply that there is a relationship between efficiency and size of the branches. This relationship is also analyzed.
Then all the procedures are repeated under profitability approach, with three inputs and two outputs. The results of profitability and production approaches are compared to see the differences and similarities. Next, efficiency scores coming from production and pro-fitability approaches are compared and branches are categorized into four groups based on low low profit, low production-high profit, production-high production-low profit and production-high production-production-high profit efficiency. Together with the analysis of branches, new strategies are proposed for relatively inefficient branches. Because of page constraints, branch efficiency measurements are not presented in this paper. Instead, results of each model are condensed into a different column of Table 3.
EMPIRICAL RESULTS
Measuring technical efficiency in production approach
Efficiency analysis of production approach with CCR model shows that 52 (41%) branches are technically efficient with an average of 0.896 (1st column of Table 3). In spite of high average efficiency, 76 (59%) of 128 branches are not technically efficient. This implies that they should produce more outputs at a given set of input level (or use less inputs to produce the same outputs), compared to their peers. And also, they should produce at right scale to become efficient. Technical efficiency
measures the branches’ overall success at utilizing their inputs by feasible input to output conversion and operating at right returns to scale.
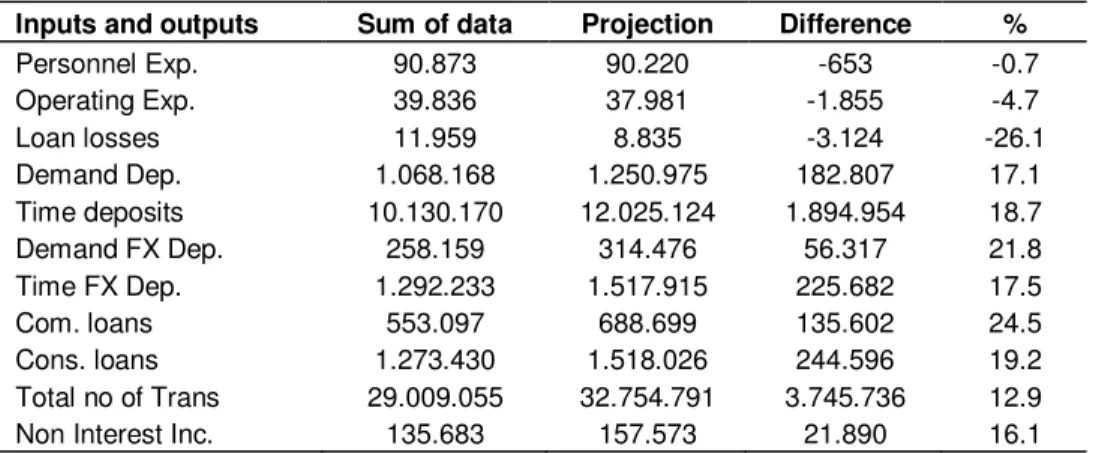
Large branches seem more technically efficient than small branches. Since large branches are mostly located in Istanbul where the population density is high, they have a geographic advantage and their average efficiency figures become higher. Large branches have deposits and credits in greater amounts, which result in more income as well as other income related products. Higher values are transacted with comparatively less personnel and operating costs. Table 4 shows the improvement potentials of inputs and outputs. Output oriented model indicates that outputs can be increased from 12.9 to 24.5% further. Although, model is run in output maximization mode, still 0.7 to 26.1% reduction is proposed for inputs. This implies that even for branches that are projected to efficient frontier, still there is excess usage of inputs.
Measuring pure technical efficiency in production approach
In literature, there is not a consensus on RTS characteristics of branches. Paradi et al. (2004) states that branches have CRS characteristics. In some studies non parametric tests are conducted on results of CCR and BCC models to determine the VRS validity (Giokas, 2008b). In some other studies simply CCR and BCC re-sults are compared. If BCC rere-sults are very close to CCR results, branches are assumed to show CRS property (Wu et al., 2006a, b; Yang, 2005; Yang and Paradi, 2006).
In our study, Kolmogorov–Smirnov test showed that CCR and BCC results come from different distributions,
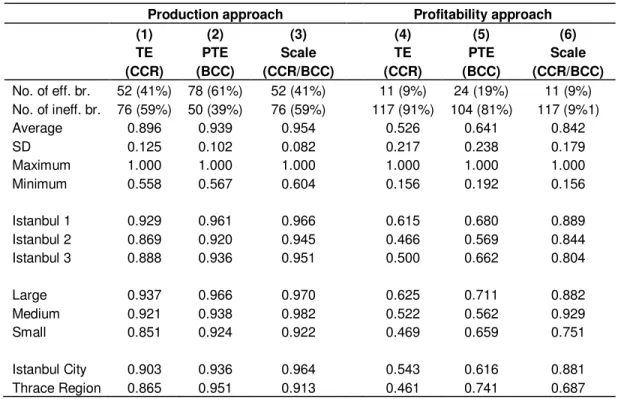
Table 3. Results of production and profitability approaches with different DEA models. Production approach Profitability approach
(1) (2) (3) (4) (5) (6)
TE PTE Scale TE PTE Scale
(CCR) (BCC) (CCR/BCC) (CCR) (BCC) (CCR/BCC) No. of eff. br. 52 (41%) 78 (61%) 52 (41%) 11 (9%) 24 (19%) 11 (9%) No. of ineff. br. 76 (59%) 50 (39%) 76 (59%) 117 (91%) 104 (81%) 117 (9%1) Average 0.896 0.939 0.954 0.526 0.641 0.842 SD 0.125 0.102 0.082 0.217 0.238 0.179 Maximum 1.000 1.000 1.000 1.000 1.000 1.000 Minimum 0.558 0.567 0.604 0.156 0.192 0.156 Istanbul 1 0.929 0.961 0.966 0.615 0.680 0.889 Istanbul 2 0.869 0.920 0.945 0.466 0.569 0.844 Istanbul 3 0.888 0.936 0.951 0.500 0.662 0.804 Large 0.937 0.966 0.970 0.625 0.711 0.882 Medium 0.921 0.938 0.982 0.522 0.562 0.929 Small 0.851 0.924 0.922 0.469 0.659 0.751 Istanbul City 0.903 0.936 0.964 0.543 0.616 0.881 Thrace Region 0.865 0.951 0.913 0.461 0.741 0.687
therefore both models are applicable. CCR model measures the distance of a branch to CRS frontier. Actually this reflects the inefficiency of that branch and measurement is normalized with efficient branch to express the efficiency score between 0 and 1. Efficiency measured with CCR model is defined as technical efficiency and it represents a total efficiency consisting pure technical efficiency and scale efficiency, BCC model, on the other hand, measures the pure technical part of efficiency. By using BCC model, together with CCR, scale efficiency can also be calculated. Pure technical efficiency shows the success of management at input to output “conversion” while scale efficiency reflects the success at working at right scale. Pure technical efficiency values are higher than technical efficiency, as expected. 78 branches become pure technically efficient and the average increases to 0.939 (2nd column of Table 3). Pure technical efficiency shows how much a branch can radically increase its outputs when projected to VRS frontier while still remaining at the same input level. Pure technical efficiency measures the scale excluded part of technical efficiency. Since input and output combination does not refer to efficient frontier, this also implies some managerial deficiencies. To become purely efficient, a branch should evolve its input-output combination in such a way that it falls on to VRS frontier.
Scale efficiency in production approach
Scale efficiency measures how much a branch can
improve its efficiency by being projected from VRS to CRS, that is the ability of further increasing its outputs radically. Scale efficiency reflects the success of a branch whether it operates at the right returns to scale or not. For a branch to become scale efficient it should increase its outputs further to reach the most productive scale size. Mostly small branches appear to have scale inefficiency because of IRS characteristics of small operation size. To be efficient, they should increase their transaction volume. Merging small branches which are close to each other may also be considered. Scale inefficiency in large branches may result from DRS characteristics. To increase scale efficiency, opening new branches in close hinterland of large branches may also be considered. Large branches have 0.970, medium branches have 0.982 and small branches have 0.922 average scale efficiencies (3rd column of Table 3). Although, not listed here, 13 of 15 most inefficient branches are small and the other 2 are large branches. These findings imply that some kind of relationship may exist between branch size and efficiency, and between branch size and RTS.
Branch size and RTS characteristics in production approach
On VRS efficient frontier, 18 branches show IRS, 52 show CRS and 8 show DRS characteristics. IRS bran-ches mostly include small and DRS branbran-ches large ones, as expected. After projecting 6 branches to CRS, 58 will operate at most productive scale size (Table 5). Even after
Eken and Kale 897
Table 4. Sum of improvement potential implied by CCR model.
Inputs and outputs Sum of data Projection Difference %
Personnel Exp. 90.873 90.220 -653 -0.7 Operating Exp. 39.836 37.981 -1.855 -4.7 Loan losses 11.959 8.835 -3.124 -26.1 Demand Dep. 1.068.168 1.250.975 182.807 17.1 Time deposits 10.130.170 12.025.124 1.894.954 18.7 Demand FX Dep. 258.159 314.476 56.317 21.8 Time FX Dep. 1.292.233 1.517.915 225.682 17.5 Com. loans 553.097 688.699 135.602 24.5 Cons. loans 1.273.430 1.518.026 244.596 19.2 Total no of Trans 29.009.055 32.754.791 3.745.736 12.9
Non Interest Inc. 135.683 157.573 21.890 16.1
Table 5. RTS characteristics of branches.
RTS Size Eff. br. Projected br. Total IRS Large 1 4 5 Medium 2 15 17 Small 15 21 36 CRS Large 17 - 17 Medium 19 4 23 Small 16 2 18 DRS Large 7 4 11 Medium 1 - 1 Small - - - Total 78 50 128
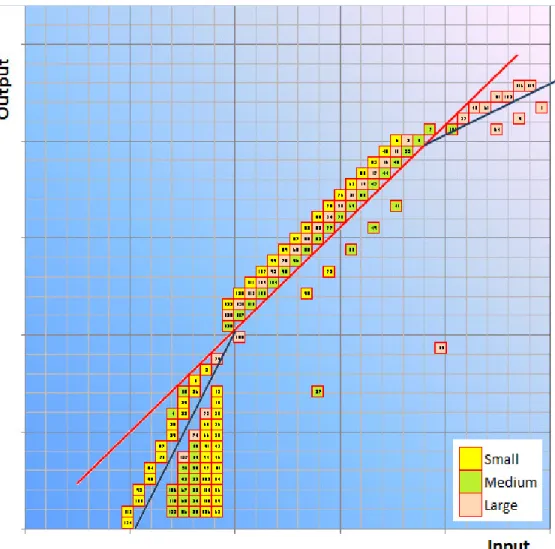
projection to VRS, still 70 branches do not fall on CRS frontier. The RTS properties of a branch guide us about how to handle it. If it is on IRS region, increasing inputs, if it is on DRS region, decreasing inputs may be preferable. Figure 1 shows the RTS region of branches. RTS characteristics of 125 branches are same in both input and output orientation.
Relationship between branch size and efficiency in production approach
To analyze the relationship between branch size and efficiency, since 100% efficient branches cannot be sorted, only scale inefficient 75 branches are considered. Branches are sorted by size from smaller to larger and by efficiency from inefficiency to efficiency (Figure 2). When we consider all 75 branches, Spearman’s rank correlation is calculated as 0.305. This indicates not a strong but slightly positive correlation. However, when we look at Figure 2, as the size increases the scale efficiency increases and after a certain point, as the size continue
to increase efficiency decreases. That is why it seems more feasible to divide branches into two groups. Spearman’s rank correlation is calculated as 0.510 for the first 50 branches and -0.354 for the next 25. Both represent a stronger relation. In the first part as branch size increases efficiency increases, in the second part as branch size increases efficiency decreases. The small branches at one end and large branches at the other end should be separately handled and analyzed. Same analysis is conducted with profitability approach and correlations are calculated as 0.404 (for 117 branches), 0.631 (for 80 branches) and -0.579 (for 37 branches), respectively. The results are almost parallel with the findings of Drake (2002), Camanhoa and Dyson (1999), Porembski et al. (2005) and Lin et al. (2009) that analyzed bank branch efficiency in this manner.
Measuring technical efficiency in profitability approach
Figure 1. RTS region of branches according to input and output orientation.
as 0.526. Pure technical and scale efficiencies are measured as 0.641 and 0.842 respectively (Column 4, 5, 6 in Table 3). According to profitability approach, 117 branches are measured as technically efficient and 104 branches as scale inefficient. Under both production and profitability approaches technical and scale efficiency characteristics of branches, grouped according to different sizes and regions, show similar tendencies. In both analyses, it is apparent that branch size and scale efficiency are related to each other. As size gets larger, scale efficiency increases and after the most productive scale, as size increases efficiency decreases.
Comparing production efficiency with profitability efficiency
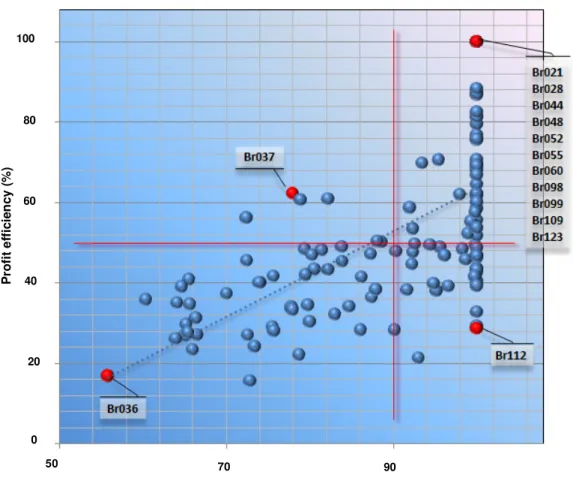
Putting scores on production and profit efficiency scales shows the working characteristics of branches (Figure 3). When separation branches to indicate the low productive-low profitable, productive-low productive-high profitable, high productive-high profitable, high productive-low profitable
efficient branches, it is reasonable to put the separation level to about average efficiency points. Therefore we analyze the production and profitability efficiency of branches whether they are below or above of 90 and 50%, respectively. The correlation between production efficiency and profitability efficiency is calculated as 0.614. A positive interaction between productivity and profitability, at least in general, is reasonable. A productive branch is expected to be profitable also. Branches with low production-low profit efficiency should carefully be investigated and they should be evolved towards high production-high profit efficiency region or should be considered for moving to another location. Depending on the region separation point, 44 branches’ production and profitability efficiencies are below 90 and 50%, respectively. They can be classified as non productive and non profitable. Br036 at bottom-left may represent this group. It is one of the smallest branch and when we deeply analyze its data, we realize that outputs of this branch are really very low.
Branches with low production-high profit efficiency have the potential for more profit and in addition to production
Eken and Kale 899
Figure 2. Branch size order and scale efficiency.
side they should be analyzed for higher profits. They make high profits with low production and they are expected to have high production efficiency also. High profit efficiency mostly results from comparatively advantageous environmental conditions and not necessarily from high management quality. 6 branches’ production efficiency is below 90%, but profit efficiency is equal or above 50%. Br037 is an example of this region. When analyzed, we see that it is a large branch in a comparatively big city. The bank has only one branch in that city and this brings comparatively profitable transactions in addition to high net interest and non-interest income with relatively small business volume.
Branches with high production and high profit efficiency are at the target zone that others should achieve. These branches convert inputs into outputs satisfactorily and make higher profits in comparison to their peers. 47 branches’ production and profit efficiency is above 90 and 50%, respectively. Especially 11 of them (Br021, Br028, Br044, Br048, Br052, Br055, Br060, Br098, Br099, Br109 and Br123) are 100% efficient both in terms of production and profitability. When closely analyzed, 5 of them are really big branches located in the heart of city, with huge amount of transaction and big customers. Of 100% efficient 11 branches, 4 are small and 2 are medium branches.
The number of branches with high production-low profit
efficiency is also relatively low. 31 branches fall into this category. They may accomplish high volumes of non profitable transactions. Typically these branches are characterized with high deposit, credits and transaction volume. But because of low profit margin, either due to high competition or overburdened non-profitable active-ties, their income is not satisfactory. Non-profitability may also results from loan loss provisions. These branches should canalize their intensive ‘junk’ transactions into alternative distribution channels, like internet banking, ATMs, call centres, and concentrate more on value added products. High production and low profit efficiency may also result from intensive competition. One of the biggest branch Br112 typically represents this group. These branches should be specially handled to achieve profitable transactions.
Conclusion
DEA has been used more extensively for measuring the performance of bank branches. It is an important method that should also be utilized as an analysis and decision making tool in branch banking. Its flexibility provides valuable information depending on the analyst’s point of view. DEA shows the way to go for inefficient branches by comparing them with peers. This study specifies a Rank of branch size
S c a le e ff ic ie n c y ( % ) 50 60 70 80 90 100
Figure 3. Comparison of production and profit efficiencies.
serious extent of inefficiency. According to output oriented CCR model, compared with efficient branches, outputs of 79 technically inefficient branches 13 to 25% and at the same time inputs 1 to 26% can be improved further. The sources of inefficiency can also be identified. By using DEA the management can realize the properties of a branch and constitutes the strategies accordingly. Different dimensions of branch characteristics can also be analyzed.
Under both production and profitability approaches efficiency characteristics of branches, which are grouped according to different sizes and regions, have similar tendencies. In both analyses, it is apparent that branch size and scale efficiency are related to each other. As size gets larger, scale efficiency increases and after the most productive scale size, as size increases efficiency decreases. Branches at small and large ends need special attention. Putting production and profit efficiency scores on two scales reveals the performing characteris-tics of branches. Each region needs different handling. Effects of branch segmentation on performance change, the efficiency of different sections within a branch or efficiency of segmented branches by Network DEA and benchmarking the branches of different banks may be
may be the interest of further studies.
REFERENCES
Allen R, Athanassopoulos A., Dyson RG, Thanassoulis E (1997). Weight Restrictions and Value Judgements in Data Envelopment Analysis: Evolution, Development and Future Directions. Ann. Oper. Res. 73(13):13-34.
Avkiran NK (2006). Productivity Analysis in the Service Sector with Data Envelopment Analysis. Third Edition. Australia.
Athanassopoulos AD, Giokas D (2000). The Use of Data Envelopment Analysis in Banking Institutions: Evidence From the Commercial Bank of Greece. Interfaces. 30(March-April 2000):81-95.
Banker RD, Charnes A, Cooper WW (1984). Some Models for Estimating Technical and Scale Inefficiency in Data
Envelopment Analysis. Manage. Sci., 30(9):1078-1092.
Barth W, Staat M (2005). Environmental Variables and Relative Efficiency of Bank Branches: a DEA-Bootstrap Approach. Int. J. Bus. Perform. Manage., X(X):1-13.
Berger AN, Humphrey DB (1997). Efficiency of Financial Institutions: International Survey and Directions for Future Research. The Wharton Financial Institutions Center WP 97-05.
Camanho AS, Dyson RG (1999). Efficiency, Size, Benchmarks and Targets for Bank Branches An Application of Data Envelopment Analysis. J. Oper. Res., 50(9): 903-915
Camanho AS, Dyson RG (2005). Cost Efficiency Measurement with Price Uncertainty: a DEA Application to Bank Branch Assessments. Eur. J. Oper. Res., 161(3):432-446.
P ro fi t e ff ic ie n c y ( % ) Production efficiency (%) 100 50 70 90 0 20 40 60 80
Camanho AS, Dyson RG (2006). Data envelopment analysis and Malmquist indices for measuring group performance. J. Prod. Anal., 26(1):35-49.
Camanho AS, Dyson RG (2008). A Generalisation of the Farrell Cost Efficiency Measure Applicable to Non-fully Competitive Settings. Int. Journal of Management Sci. 36(1):147-162.
Charnes A, Cooper WW, Rhodes E (1978). Measuring the Efficiency of Decision Making Units. Eur. J. Oper. Res., l:2(6):429-444.
Cook WD, Hababou M, Tuenter HJH (2000). Multicomponent Efficiency Measurement and Shared Inputs in Data Envelopment Analysis: An Application to Sales and Service Performance in Bank Branches. J. Prod. Anal., 14(3):209-224.
Cook WD, Hababou M (2001). Sales Performance Measurement in Bank Branches. Omega. 29(4):299-307.
Cook WD, Zhu J (2005). Modeling Performance Measurement: Applications and Implementation Issues in DEA. USA: Springer. Cook WD, Seiford LM (2009). Data Envelopment Analysis (DEA)-Thirty
Years On. Eur. J. Oper. Res., 192(1):1-17
Cooper WW, Seiford LM, Tone K (2007). Data Envelopment Analysis, A Comprehensive Text with Models, Applications, References and DEA-Solver Software. Second Edition. USA:Springer.
Das A, Ray SC, Nag A (2009). Labor-Use Efficiency in Indian Banking: a Branch-Level Analysis. Omega. 37(2):411-425.
Dekker D, Post T (2001). A Quasi-Concave DEA Model with an Application for Bank Branch Performance Evaluation. Eur. J. Oper. Res., 132(2):296-311.
Drake L (2002). An Insight into the Size Efficiency of a UK Bank Branch Network. Manag. Financ., 28(9):24-36.
Emrouznejad A, Parker BR, Tavares G (2008). Evaluation of Research in Efficiency and Productivity: A Survey and Analysis of the First 30 Years of Scholarly Literature in DEA. Sociol. Econ. Plan. Sci., 42(3):151-157
Farrell MJ (1957). The Measurement of Productive Efficiency. J. Royal Stat. Society. 120(Part III):253-281.
Fethi MD, Pasiouras F (2009). Assessing Bank Efficiency and Performance with Operational Research and Artificial Intelligence Techniques: A survey. University of Bath WP 2009.02.
Fiala P, Jablonsky J, Smirlis Y, Despotis DK (2003). DEA With Interval Data: An Application to the Evaluation of Branches of a Czech Bank. Central Eur. J. Oper. Res., 11(3):323-339.
Gaganis C, Liadaki A, Doumpos M, Zopounidis C (2009). Estimating and analyzing the efficiency and productivity of bank branches: Evidence from Greece. Manag. Financ., 35(2):202-218
Giokas DI (2008a). Assessing the Efficiency in Operations of a Large Greek Bank Branch Network Adopting Different Economic Behaviors. Econ. Model., 25(3):559–574.
Giokas DI (2008b). Cost Efficiency Impact of Bank Branch Characteristics and Location an Illustrative Application to Greek Bank Branches. Manag. Financ., 34(3):172-185.
Hartman TE, Storbeck JE, Byrnes P (2001). Allocative Efficiency in Branch Banking. Eur. J. Oper. Res., 134(2):232-242.
Howland M, Rowse J (2006). Measuring Bank Branch Efficiency Using Data Envelopment Analysis: Managerial and Implementation Issues. INFOR. 44(1):49-63.
Lin TT, Lee CC, Chiu TF (2009). Application of DEA in Analyzing a Bank’s Operating Performance. Expert Syst. Appl., 36(5):8883-8891. Manandhar R, Tang JCS (2002). The evaluation of bank branch
performance using data envelopment analysis a framework. J. High Technol. Manage. Res., 13(1):1–17.
McEachern D, Paradi JC (2007). Intra- and Inter-Country Bank Branch Assessment Using DEA. J. Prod. Anal., 27(2):123-136.
Meepadung N, Tang JCS, Khan DB (2009). IT-based banking services: Evaluating operating and profit efficiency at bank branches. J. High Technol. Manage. Res., 20(2):145-152.
Noulas A, Glaveli N, Kiriakopoulos I (2008). Investigating cost efficiency in the branch network of a Greek bank: an empirical study. Manag. Financ., 34(3):160-171.
Oral M and Yolalan R (1990). An Empirical Study on Measuring Operating Efficiency and Profitability of Bank Branches. Eur. J. Oper,. Res., 46(3):282-294.
Eken and Kale 901
Paradi JC, Claire S (2004). Commercial Branch Performance Evaluation and Results Communication in a Canadian Bank - a DEA Approach. Eur. J. Oper. Res., 156(3):719-735.
Paradi JC, Vela S, Yang Z (2004). Assesing Bank and Bank Branch Performance. In Cooper WW, Seiford LM, Zhu J (Ed.). Handbook on Data Envelopment Analysis (pp.349-400). USA: Kluwer Academic Publishers.
Paradi JC, Rouattb S, Zhu H (2010) Two-stage evaluation of bank branch efficiency using data envelopment analysis. Omega. 39(1): 99-109.
Pastor, JT, Lovell CAK, Tulkens H (2003). Evaluating the Financial Performance of Bank Branches. CORE Discussion Paper No: 2003/94.
Porembski M, Breitenstein K, Alpar P (2005). Visualizing efficiency and reference relations in data envelopment analysis with an application to the branches of a German bank. J. Prod. Anal., 23(2):203-221. Portela MCAS, Borges PC, Thanassoulis E (2003). Finding Closest
Targets in Oriented DEA Models: The Case of Convex and Non-Convex Technologies. J. Prod. Anal., 19(2/3):251-69
Portela MCAS, Thanassoulis, E (2007). Comparative Efficiency Analysis of Portuguese Bank Branches. Eur. J. Oper. Res., 177(2):275-1288.
Sarkis J (2007). Preparing Your Data for DEA. In Zhu J, Cook WD (Ed.). Modeling Data Irregularities and Structural Complexities in Data Envelopment Analysis. USA:Springer.
Sevcovic D, Halicka M, Brunovsky P (2001). DEA Analysis for a Large Structured Bank Branch Network. Central Eur. J. Oper. Res., 9:329-342.
Sherman HD, Gold F (1985). Bank Branch Operating Efficiency: Evaluation with Data Envelopment Analysis. J. Bank Financ., 9(2):297-315.
Sherman HD, Zhu J (2006a). Service Productivity Management Improving Service Performance Using Data Envelopment Analysis (DEA). USA:Springer.
Sherman HD, Zhu J (2006b). Benchmarking with quality-adjusted DEA (QDEA) to seek lower-cost high-quality service: Evidence from a US bank application. Ann. Oper. Res., 145(1):301-319.
Sherman HD, Rupert TJ (2006). Do bank mergers have hidden or foregone value? Realized and unrealized operating synergies in one bank merger. Eur. J. Oper. Res., 168(1): 253-268.
Sowlati T, Paradi JC (2004). Establishing the Practical Frontier in Data Envelopment Analysis. Omega. 32(4):261-272
Wu D(D), Yang Z, Liang L (2006a). Efficiency Analysis of Cross-Region Bank Branches Using Fuzzy Data Envelopment Analysis. Appl. Math Comp., 181(1):271-281.
Wu D(D), Yang Z, Liang L (2006b). Using DEA-Neural Network Approach to Evaluate Branch Efficiency of a Large Canadian Bank. Expert Syst. Appl., 31(1):108-115.
Yang Z (2005). DEA Evaluation of Bank Branch Performance. Eng. Manage. Conf. Proceed. IEEE Int., 1:82-85.
Yang Z (2006). Identifying Environmental Factors Affecting Bank Branch Performance Using Data Envelopment Analysis. Service Operations and Logistics and Informatics Proceedings. IEEE International. pp:192-196.
Yang Z (2009). Bank Branch Operating Efficiency A DEA Approach. Proceed. Int. MultiConf. Eng. Comput. Sci., Vol II.
Yang Z, Paradi JC (2006). Cross Firm Bank Branch Benchmarking Using “Handicapped" Data Envelopment Analysis to Adjust for Corporate Strategic Effects. Proceedings of the 39th Hawai Int. Conf. Syst. Sci., 2:34b-34b
Zhu J (2003). Quantitative Models for Performance Evaluation and Benchmarking: Data Envelopment Analysis with Spreadsheets and DEA Excel Solver. USA: Springer.