International Journal of
Intelligent Systems and
Applications in Engineering
Advanced Technology and ScienceISSN:2147-67992147-6799 www.atscience.org/IJISAE Original Research Paper
Breast Cancer Diagnosis by Different Machine Learning Methods Using
Blood Analysis Data
Muhammet Fatih Aslan*
1, Yunus Celik
1, Kadir Sabanci
1, Akif Durdu
2Accepted : 18/11/2018 Published: 31/12/201x DOI: 10.1039/b000000x
Abstract: Today, one of the most common types of cancer is breast cancer. It is crucial to prevent the propagation of malign cells to reduce the rate of cancer induced mortality. Cancer detection must be done as early as possible for this purpose. Machine Learning techniques are used to diagnose or predict the success of treatment in medicine. In this study, four different machine learning algorithms were used to early detection of breast cancer. The aim of this study is to process the results of routine blood analysis with different ML methods and to understand how effective these methods are for detection. Methods used can be listed as Artificial Neural Network (ANN), standard Extreme Learning Machine (ELM), Support Vector Machine (SVM) and K-Nearest Neighbor (k-NN). Dataset used were taken from UCI library. In this dataset age, body mass index (BMI), glucose, insulin, homeostasis model assessment (HOMA), leptin, adiponectin, resistin and chemokine monocyte chemoattractant protein 1 (MCP1) attributes were used. Parameters that have the best accuracy values were found by using four different Machine Learning techniques. For this purpose, hyperparameter optimization method was used. In the end, the results were compared and discussed.
Keywords: Breast cancer, Artificial Neural Network, Extreme Learning Machine, Support Vector Machine, K-Nearest Neighbors,
Hyperparameter Optimization
1. Introduction
Different cancer types have long been a major threat to human life [1]. Among these types, breast cancer has a high mortality rate in women. Unfortunately, this rate is increasing in developed countries day by day [2, 3]. Moreover, breast cancer is the second biggest cause of death all over the world [4]. According to World Health Organization (WHO) data [5], breast cancer has been detected in 25% of women in the United Nations [6]. 16% of all female cancers is breast cancer [5].
Cancer is a sickness that starts in the cell and spreads into the other part of the body [7]. That is the reason why early detection is crucial to prevent before it spreads. Early diagnosis of breast cancer is the most important and difficult part of breast imaging [8]. The works for early detection of breast cancer are not new but the current works are not capable enough for early detection so, in addition to current works, scientist are searching for new methods [9]. Specially Computer-Aided Detection (CAD) systems play a crucial role in early detection [10].
Machine Learning (ML) techniques are used in the CAD system applications. ML [11] is an Artificial Intelligence (AI) topic that enables the machines to learn a special task by experience. In recent years, ML methods have become widespread in predicting and detecting applications in order to make strong decisions in recent years. For example, ML methods can be used to determine whether a cancer is benign or malign [9].
2. Related Works
There are many works exist for the detection of breast cancer using ML techniques in the literature. In this part, some of these works were shown. The performance comparison of Support Vector Machine (SVM), K-Nearest Neighbor (k-NN), Decision Tree (C4.5) and Naive Bayes (NB) Machine Learning (ML) techniques were shown [12]. Wisconsin Diagnosis Breast Cancer (WDBC) dataset [13] was used for this work. The best result was obtained with SVM technique as 97.13%. The paper with [14] reference number includes a work that K-Means and SVM algorithms were used as a hybrid for the purpose of detection of a tumour. A classification with a high accuracy rate was performed as a result of 10 times cross-validation. In this work, the WDBC dataset [13] was used. 97.38% accuracy was achieved. The paper [15] shows the success of SVM and Artificial Neural Network (ANN) techniques together. WDBC dataset was also used in this paper. Accuracy was obtained as 97.14% with SVM and 96.71% with ANN. According to these results, SVM gives better results than ANN. Another paper [16] it was also shown that SVM has better performance for the detection of breast cancer. On the other hand, the performance of the SVM depends on the kernel function. In this paper, the performance of different types of kernel functions were compared. In the paper [17], k-NN algorithm was optimized for a faster and more reliable classification. 94.1% accuracy was obtained. The paper [18] is about the usage of different ML techniques for breast cancer. The research is about the usage of ANN, SVM, Decision Tree (DT) and k-NN techniques in breast cancer diagnosis. In the paper [19] DT, Bayesian Belief Network, and SVM techniques were compared. In the last paper [20], breast cancer was detected using ANN classification. The work focuses on the optimal activation function that minimizes the classification error by using fewer blocks.
_______________________________________________________________________________________________________________________________________________________________________________________________________________________________________________________________________________________________________________________________ 1Department of Electrical-Electronic Engineering, Karamanoğlu
Mehmetbey University,Karaman,-70100, Turkey
2Department of Electrical-Electronic Engineering, Konya Technical
University,Konya,-42000, Turkey,
3. Material and Methods
In this section, dataset and ML methods used were presented. 3.1. Data Understanding
When related works were analysed, it is clear that there are several different techniques for the detection of breast cancer and detection problem still exist. There are several types of the dataset for the detection of breast cancer. In this paper, Breast Cancer Coimbra dataset [22] taken from UCI [21] ML Repository was used. This dataset includes features that can be collected in routine blood analysis. These features are age (years), BMI (kg/m2), Glucose (mg/dL), Insulin (µU/mL), HOMA, Leptin (ng/mL), Adiponectin (µg/mL), Resistin (ng/mL) and MCP1(pg/dL). According to these input features, target data can be classified as healthy or unhealthy. These features were measured from 64 patients with breast cancer and 52 healthy people [22,23]. This dataset differs from others in terms of the features it contains.
3.2. Artificial Neural Network (ANN)
The structure of the ANN is quite similar to biological neural networks [24]. An ANN composed of three layers as an input layer, hidden layer, and an output layer. The neurons in each layer are connected to each other with a specific weight. These weights are updated themselves iteratively until they are close enough to target values. When the weights are tuned, the system can be expressed as trained. After this phase, the testing process can be performed [25].
3.3. Extreme Learning Machine (ELM)
ELM is a method invented by Huang and friends [26]. It is actually having the same structure with ANN. The difference is that while ANN has more than one hidden layer, standard ELM should have only one hidden layer. Moreover, Unlike ANN, there are more than 1000 hidden layer neurons in a standard ELM [27]. ELM offers advantages over other ML methods in terms of speed. Because ELM completes training with a single iteration [28]. Weights are assigned randomly and according to target values, β values are calculated. Moore-Penrose generalized inverse matrix method is used for the calculation [29].
3.4. Support Vector Machine (SVM)
SVM is one of the best advised ML methods in terms of speed and accuracy [30]. SVM forms optimal hyperplanes in a multidimensional plane and in this way classifies multi-class property data [31]. The SVM contains calculations for the creation of this plane. If the properties can be classified as linear, the plane can be created by simple calculations. The kernel trick is used for non-linear features. With kernel trick, features can be converted to
a higher-level and can be separated linearly [32]. 3.5. K-Nearest Neighbors (k-NN)
With the help of k-NN, data in the feature space are classified according to distance. The distances can be calculated with different methods. In order to classify the data, the decision is made by looking at the distance from k numbered neighbor. Data is assigned to the nearest class [33]. Since there is no training phase, understanding and implementation of the method are quite easy [34].
4. Application and Results
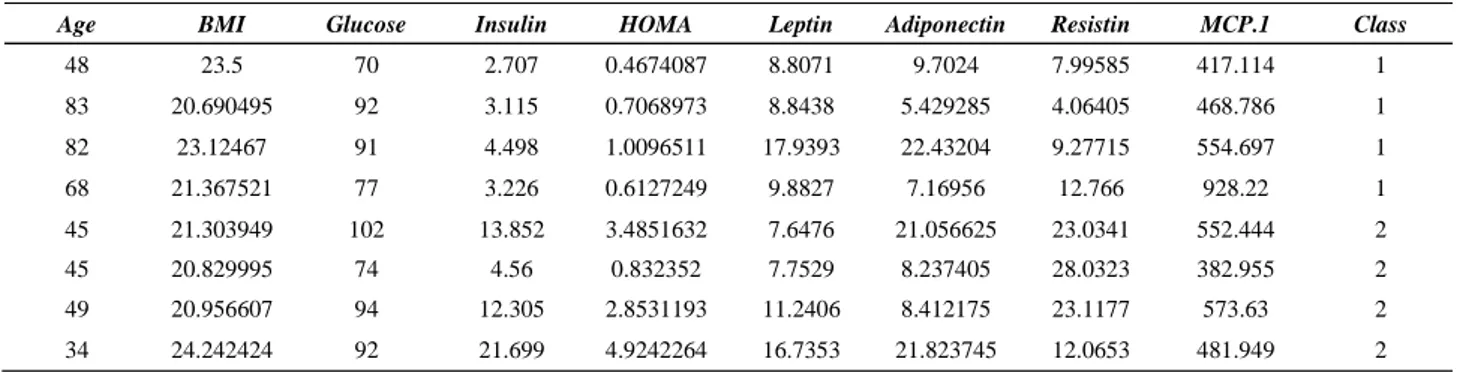
In this study, the dataset was taken from the UCI library [21] and blood analysis data taken from the paper [22] were used. There are 116 samples in total. Some of these data are shown in Table 1. Target values indicate that the person is healthy or unhealthy. Considering the input values, max and min of these values are quite different from each other. Normalization must first be applied to normalize the distribution and increase the success rate.
Feature Scaling method is used for normalization. The formula for this method is shown in (1).
𝑥′ = 𝑥 − 𝑥𝑚𝑖𝑛
𝑥𝑚𝑎𝑥− 𝑥𝑚𝑖𝑛 (1)
After normalization using (1), training and test data were generated randomly from the data. 80% percent of the whole data were used in the test phase and 20% percent were used in the training phase. After separation of training and test data, results were obtained for each ML method.
An interface was created in MATLAB GUI environment for classification with ANN (see Fig. 1). In ANN, there are a number of hyperparameters that affect the accuracy of the system. The important parameters can be listed as Number of Hidden Layer Neuron, Epoch Number, Learning Rate and Momentum Coefficient. These values must be set by trial and error to obtain the most optimal result of ANN. For this reason, at the interface, a certain range of these parameters can be adjusted by the user. The graphs in the interface give Root Mean Square Error (RMSE) values according to the changing parameter values. The results of the RMSE values are plotted according to the changed parameter and the parameters which give the minimum error were recorded. After that, training and test process was managed by using the best parameters. As a result, the average test accuracy rate is 79.4304%, average training time 0.4282 second and average RMSE value was obtained as 0.3954. Comparison of these values with ELM is shown in Table 2.
Table 1. Some data used for breast cancer detection
Age BMI Glucose Insulin HOMA Leptin Adiponectin Resistin MCP.1 Class
48 23.5 70 2.707 0.4674087 8.8071 9.7024 7.99585 417.114 1 83 20.690495 92 3.115 0.7068973 8.8438 5.429285 4.06405 468.786 1 82 23.12467 91 4.498 1.0096511 17.9393 22.43204 9.27715 554.697 1 68 21.367521 77 3.226 0.6127249 9.8827 7.16956 12.766 928.22 1 45 21.303949 102 13.852 3.4851632 7.6476 21.056625 23.0341 552.444 2 45 20.829995 74 4.56 0.832352 7.7529 8.237405 28.0323 382.955 2 49 20.956607 94 12.305 2.8531193 11.2406 8.412175 23.1177 573.63 2 34 24.242424 92 21.699 4.9242264 16.7353 21.823745 12.0653 481.949 2
Fig. 1. Designed ANN interface and results
An interface was created in the MATLAB GUI environment for standard ELM classification (see Fig. 2). In standard ELM, the hyperparameter that affects the accuracy of the system is the number of hidden layer neuron. The number of hidden layer neurons is changed within a certain range to achieve the most optimal result with ELM. This range can be determined by the user. RMSE values are plotted according to the changed parameter. The best number of hidden neuron layers was obtained as 1800 (see Fig. 2). As a result, the average test accuracy rate is 80%, average training time is 0.0075 second and average RMSE value was obtained as 0.4755. Comparison of these values with ANN is shown in Table 2.
Fig. 2. Designed ELM interface and results
Table 2 shows that the accuracy values of ANN and standard ELM are close to each other. But ELM is much faster than ANN. When number of training samples is too high, the use of standard ELM is much more advantageous in terms of time.
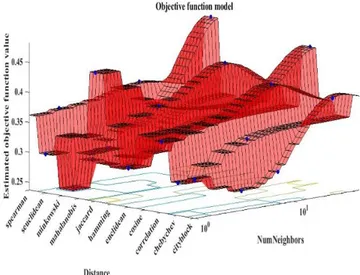
Hyperparametric optimization method is also used for classification with k-NN. These parameters can be thought of as the number of neighbors and distance type for k-NN. The resulting Hyperparameter optimization in MATLAB environment is shown in Fig. 3. Optimum parameter values are determined according to the graph. Euclidean distance was used as a distance type. The number of neighbors was chosen as two. Average accuracy rate was obtained as 77.5%. Using the best parameters, the training data was classified at 0.15781 sec.
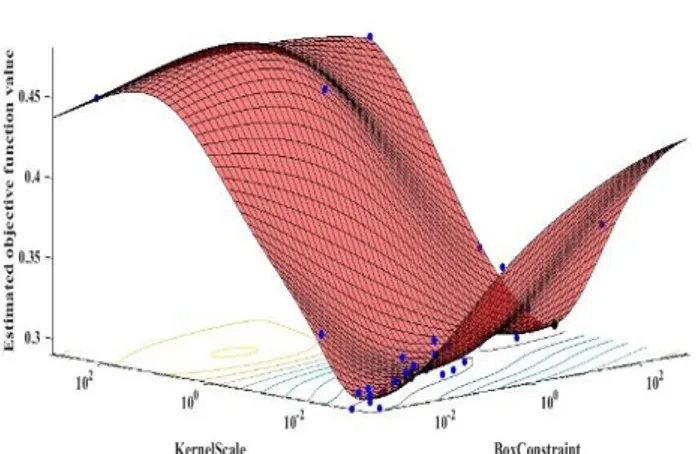
Fig. 3. Hyperparameter Optimization for k-NN algorithm Hyperparameter optimization is also used for classification with SVM. Hyperparameters of SVM can be thought as regularization constant (box Constraint (C)) and kernel scale for SVM. The soft margin method has been taken into account in the classification by SVM. The resulting Hyperparameter optimization in MATLAB environment is shown in Fig. 4. Optimum parameter values are determined according to this graph. Optimal kernel scale value found 0.0287. Optimum C value was obtained as 0.4869. As a Table 2. Comparison of ANN and ELM results for 10 data
ELM ANN
Data Number
Train Test Train Test
Acc. Rate Train Time Acc. Rate RMSE Acc. Rate Train Time Acc. Rate RMSE
1 83.8710 0.0073 78.2609 0.4802 76.3441 0.4620 78.2610 0.3618 2 83.8710 0.0136 82.6087 0.4706 70.9677 0.3797 78.2610 0.3952 3 83.8710 0.0060 82.6087 0.4631 80.6452 0.3864 73.9130 0.3858 4 83.8710 0.0079 73.9130 0.4863 75.2688 0.5253 69.5652 0.4961 5 83.8710 0.0060 78.2610 0.4817 74.1935 0.3666 82.6087 0.3820 6 83.8710 0.0063 82.6087 0.4814 83.8710 0.4406 82.6087 0.3932 7 84.9462 0.0069 78.2610 0.4634 82.7957 0.4107 89.9565 0.3527 8 84.9462 0.0072 82.6087 0.4820 80.6452 0.4761 82.6087 0.3733 9 83.8710 0.0068 82.6087 0.4701 74.1935 0.4105 73.913 0.4108 10 81.7204 0.0073 78.2610 0.4759 78.4946 0.4244 82.6087 0.4034 Average 83.8710 0.0075 80.00 0.4755 77.7419 0.4282 79.4304 0.3954
result, average accuracy rate was obtained as 73.5%. Using the best parameters, the training data was classified at 0.1866 sec.
Fig. 4. Hyperparameter Optimization for SVM algorithm
5. Conclusion and Discussion
In this study, Breast Cancer Coimbra dataset [22] taken from UCI [21] was used. This dataset is different from other datasets in terms of feature type. This dataset includes age, BMI, glucose, insulin, HOMA, leptin, adiponectin, resistin and MCP1 features that can be collected in routine blood analysis. The significance of these data in breast cancer detection was investigated by ML methods. Analysis was performed with four different ML methods. Interfaces for ANN and ELM have been developed. In addition, the hyperparameter values giving the least errors for ANN, ELM, k-NN and SVM methods are determined using Hyperparameter optimization technique. Accuracy rates and training times were obtained according to these values. Calculated accuracy values and training time are shown in Table 3. The k-NN method does not actually contain the training phase. The value in Table 3 represents the calculation period of the training data.
Table 3. Comparison of ML algorithms
ML
Algorithms ANN ELM k-NN SVM
Acc. Rate
(%) 79.4304 80 77.5 73.5 Train
Time (sec) 0.4282 0.0075 0.15781 0.1866
When the values in Table 3 are examined, the highest accuracy rate and the lowest training period are provided by standard ELM. According to these results, the use of standard ELM is more advantageous in terms of time when there is a high number of samples. The importance of this work is pretty high because of the usage of the different type of data. In addition, this study is also important because four different ML methods are compared. As a result of the study, the obtained accuracy rate cannot be regarded as very high. However, this study investigated the utility of such data with ML methods in breast cancer detection. In addition, this study may support the further work in this field.
References
[1] J. Tang, R. M. Rangayyan, J. Xu, I. El Naqa, and Y. Yang, “Computer-aided detection and diagnosis of breast cancer with mammography: recent advances,” IEEE Transactions on Information Technology in Biomedicine, vol. 13, no. 2, pp. 236-251,
2009.
[2] Z. Ahmad, A. Khurshid, A. Qureshi, R. Idress, N. Asghar, and N. Kayani, “Breast carcinoma grading, estimation of tumor size, axillary lymph node status, staging, and nottingham prognostic index scoring on mastectomy specimens,” Indian Journal of Pathology and Microbiology, vol. 52, no. 4, pp. 477, 2009. [3] U. R. Acharya, E. Y.-K. Ng, J.-H. Tan, and S. V. Sree,
“Thermography based breast cancer detection using texture features and support vector machine,” Journal of medical systems, vol. 36, no. 3, pp. 1503-1510, 2012.
[4] K. Ganesan, U. R. Acharya, C. K. Chua, L. C. Min, K. T. Abraham, and K.-H. Ng, “Computer-aided breast cancer detection using mammograms: a review,” IEEE Reviews in biomedical engineering, vol. 6, pp. 77-98, 2013.
[5] WHO. “Breast cancer: prevention and control,” http://www.who.int/cancer/detection/breastcancer/en/index1.html. [6] D. Bazazeh, and R. Shubair, “Comparative study of machine
learning algorithms for breast cancer detection and diagnosis.” 5th International Conference on Electronic Devices, Systems and Applications (ICEDSA), pp. 1-4, 2016.
[7] M. Hejmadi, Introduction to cancer biology, 2 ed.: Bookboon, 2009. [8] I. Schreer, and J. Lüttges, “Breast cancer: early detection,” Radiologic-Pathologic Correlations from Head to Toe, pp. 767-784: Springer, 2005.
[9] B. K. Gayathri, and P. Raajan, “A survey of breast cancer detection based on image segmentation techniques.” IEEE International Conference on Computing Technologies and Intelligent Data Engineering (ICCTIDE'16), pp. 1-5, 2016.
[10] P. Král, and L. Lenc, “LBP features for breast cancer detection.” IEEE International Conference on Image Processing (ICIP), pp. 2643-2647, 2016.
[11] P. Louridas and C. Ebert, “Machine Learning,” IEEE Software, vol. 33, no. 5, pp. 110-115, 2016.
[12] H. Asri, H. Mousannif, H. Al Moatassime, and T. Noel, “Using machine learning algorithms for breast cancer risk prediction and diagnosis,” Procedia Computer Science, vol. 83, pp. 1064-1069, 2016.
[13] K. P. Bennett, and J. A. Blue, “A support vector machine approach to decision trees.” IEEE International Joint Conference on Neural Networks Proceedings. IEEE World Congress on Computational Intelligence, pp. 2396-2401, 1998.
[14] B. Zheng, S. W. Yoon, and S. S. Lam, “Breast cancer diagnosis based on feature extraction using a hybrid of K-means and support vector machine algorithms,” Expert Systems with Applications, vol. 41, no. 4, pp. 1476-1482, 2014.
[15] R. Alyami, J. Alhajjaj, B. Alnajrani, I. Elaalami, A. Alqahtani, N. Aldhafferi, T. O. Owolabi, and S. O. Olatunji, “Investigating the effect of Correlation based Feature Selection on breast cancer diagnosis using Artificial Neural Network and Support Vector Machines.” IEEE International Conference on Informatics, Health & Technology (ICIHT), pp. 1-7, 2017.
[16] M. Hussain, S. K. Wajid, A. Elzaart, and M. Berbar, “A comparison of SVM kernel functions for breast cancer detection.” IEEE Eighth International Conference Computer Graphics, Imaging and Visualization, pp. 145-150, 2011
[17] W. Cherif, “Optimization of K-NN algorithm by clustering and reliability coefficients: application to breast-cancer diagnosis,” Procedia Computer Science, vol. 127, pp. 293-299, 2018. [18] W. Yue, Z. Wang, H. Chen, A. Payne, and X. Liu, “Machine
Learning with Applications in Breast Cancer Diagnosis and Prognosis,” Designs, vol. 2, no. 2, pp. 13, 2018.
[19] P. Suryachandra, and P. V. S. Reddy, “Comparison of machine learning algorithms for breast cancer.” IEEE International
Conference on Inventive Computation Technologies (ICICT), pp. 1-6, 2016.
[20] H. Jouni, M. Issa, A. Harb, G. Jacquemod, and Y. Leduc, “Neural Network architecture for breast cancer detection and classification.” IEEE International Multidisciplinary Conference on Engineering Technology (IMCET), pp. 37-41, 2016.
[21] UCI. “Machine Learning Repository,” https://archive.ics.uci.edu/ml/index.php.
[22] M. Patrício, J. Pereira, J. Crisóstomo, P. Matafome, M. Gomes, R. Seiça, and F. Caramelo, “Using Resistin, glucose, age and BMI to predict the presence of breast cancer,” BMC cancer, vol. 18, no. 1, pp. 29, 2018.
[23] J. Crisóstomo, P. Matafome, D. Santos-Silva, A. L. Gomes, M. Gomes, M. Patrício, L. Letra, A. B. Sarmento-Ribeiro, L. Santos and R. Seiça, “Hyperresistinemia and metabolic dysregulation: a risky crosstalk in obese breast cancer,” International Journal of Basic and Clinical Endocrinology, vol. 53, no. 2, pp. 433-442, 2016. [24] P. Kshirsagar, and N. Rathod, “Artificial neural network,”
International Journal of Computer Applications, 2012.
[25] N. Gupta, “Artificial neural network,” Network and Complex Systems, vol. 3, no. 1, pp. 24-28, 2013.
[26] G.-B. Huang, Q.-Y. Zhu, and C.-K. Siew, “Extreme learning machine: a new learning scheme of feedforward neural networks.” IEEE International Joint Conference on Neural Networks, pp. 985-990, 2004.
[27] Y. Yang, and Q. M. J. Wu, “Extreme Learning Machine With Subnetwork Hidden Nodes for Regression and Classification,” IEEE Transactions on Cybernetics, vol. 46, no. 12, pp. 2885-2898, 2016. [28] S. Ding, H. Zhao, Y. Zhang, X. Xu, and R. Nie, “Extreme learning
machine: algorithm, theory and applications,” Artificial Intelligence Review, vol. 44, no. 1, pp. 103-115, 2015.
[29] N.-Y. Liang, G.-B. Huang, P. Saratchandran, and N. Sundararajan, “A fast and accurate online sequential learning algorithm for feedforward networks,” IEEE Transactions on neural networks, vol. 17, no. 6, pp. 1411-1423, 2006.
[30] V. N. Mandhala, V. Sujatha, and B. R. Devi, “Scene classification using support vector machines.” IEEE International Conference on Advanced Communications, Control and Computing Technologies, pp. 1807-1810, 2014.
[31] M. E. Mavroforakis, and S. Theodoridis, "Support Vector Machine (SVM) classification through geometry.", IEEE 13th European Signal Processing Conference, pp. 1-4, 2005.
[32] W.-C. Lai, P.-H. Huang, Y.-J. Lee, and A. Chiang, “A distributed ensemble scheme for nonlinear support vector machine,” IEEE Tenth International Conference on Intelligent Sensors, Sensor Networks and Information Processing (ISSNIP), pp. 1-6, 2015. [33] N. Suguna, and K. Thanushkodi, “An improved k-nearest neighbor
classification using genetic algorithm,” International Journal of Computer Science Issues, vol. 7, no. 2, pp. 18-21, 2010.
[34] J. Kim¹, B.-S. Kim, and S. Savarese, “Comparing image classification methods: K-nearest-neighbor and support-vector-machines,” Proceedings of the 6th WSEAS international conference on Computer Engineering and Applications, and Proceedings of the 2012 American conference on Applied Mathematics, vol. 1001, pp. 48109-2122, 2012.