1
Slot Milling of Titanium Alloy with Hexagonal Boron Nitride and
Minimum Quantity Lubrication and Multi-Objective Process
Optimization for Energy Efficiency
Khaled Ali Osman1, Volkan Yılmaz2, Hakkı Özgür Ünver3, Ulvi Şeker4, S. Engin KILIÇ5 1Atilim University, 06836 Ankara, Turkey, [email protected] 2 Technical Education Faculty, Gazi University, Besevler, Ankara, 06500, Turkey [email protected]
3Department of Mechanical Engineering, TOBB University of Economics and Technology, 06520 Ankara, Turkey [email protected]
4Technical Education Faculty, Gazi University, Besevler, Ankara, 06570, Turkey, [email protected]
5Atilim University, 06830, Ankara, Turkey, [email protected]
Declaration of Interest: none Abstract
The implementation of sustainable manufacturing techniques to make machining processes more eco-friendly is a challenging topic that has attracted significant attention from the industrial sector for many years. As one of the dominant manufacturing processes, machining can have a considerable impact in terms of ecology, society, and economics. In certain areas, this impact is a result of using certain cutting fluids, especially during the machining of difficult-to-cut alloys such as titanium, where a large amount of cutting fluid is wasted to ease the cutting process. In such scenarios, identifying suitable machining conditions to supply cutting fluids using eco-friendly techniques is currently a major focus of academic and industrial sector research. In this study, effects of minimum quantity lubrication with different concentrations of hexagonal boron nitride nanoparticles on the surface roughness and cutting force of slot-milled titanium alloy is investigated using analysis of variance and response surface methodology. The results reveal that all responses are sensitive to changes in the feed per tooth, cutting depth, and cutting fluid flow rate. The regression functions generated were combined with particle swarm optimization to in order to improve energy-efficiency, as well. Possible sectorial scenarios were generated for wider industrial adoption. Additionally, it was proven that utilizing minimum quantity lubrication with hexagonal boron nitride nanoparticles can reduce both cutting force and surface roughness, which makes it to be a promising
alternative as a nanoparticle augmented minimum quantity lubrication method for machining titanium alloys.
Keywords Titanium alloy; Milling; Minimum Quantity Lubrication; hexagonal boron nitride nanoparticles; Particle Swarm Optimization.
2
1. Introduction
The idea and indicators of sustainable production is well defined at macro level, but there is a lack of implementation of environmentally benign manufacturing
technologies at shop floor layer (Veleva et al., 2001, Pusavec et al, 2010). Main objectives in the shop floor for machining industry are 1) Limit the amount of cooling-lubrication fluids used in processes 2) Reduce energy use by machine tools, 3) Substitute hazardous materials in coolants by non-toxic additives (Krajinik et al. 2016).
The sustainability drivers at shop floor level and increasing cost pressures have led to consideration of environmentally friendly technologies in cooling of machining process (Wienert et al. 2004). The minimum quantity lubrication (MQL) has been proven as a reliable substitute for conventional cooling methods, because it complies with the requirements of sustainability and it has great potential to reduce the coolant waste (Sharma et al. 2016). MQL is also known as near-dry machining (Erdel, 1999), micro-lubrication (McClure et al., 2004), or green machining. Conventional cooling utilizes approximately 200 to 3,000 l/min of cutting fluid, whereas MQL utilizes only 5 - 500 ml/h (Dhar et al., 2006). A reduction in cutting fluid quantity leads to
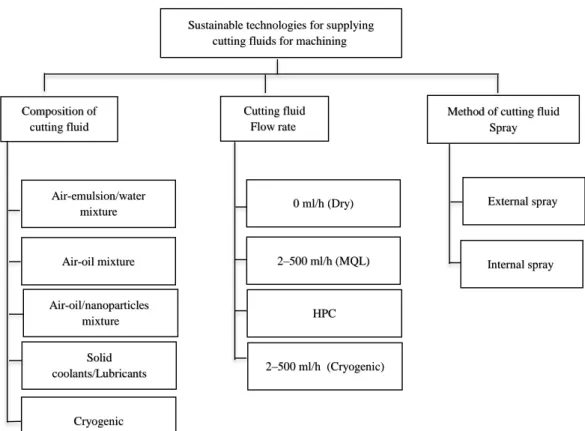
economic and environmental benefits, as well as a reduction of health hazards during various machining processes. Fig. 1 presents a classification of sustainable cutting fluid supply technologies.
3
Fig. 1. Classification of sustainable cutting fluid supply technologies
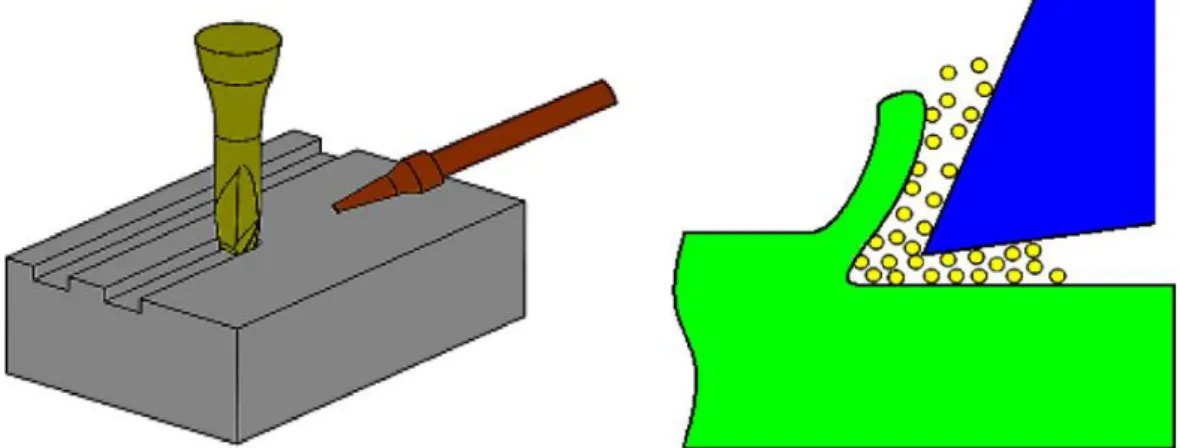
To investigate MQL performance in various machining processes, many experimental studies have been conducted. Fig. 2 presents a schematic illustration of MQL
lubrication. Rahim et al. (2013) investigated MQL performance during the turning process using an uncoated carbide insert. They reported that as opposed to dry cutting, MQL yielded less cutting temperature and cutting force, and better chip thickness. Sharma and Sidhu (2014) explored the effects of MQL during the turning of AISI D2 steel with a tungsten carbide cutting insert and concluded that MQL can improve surface integrity to a certain extent and reduce cutting temperature by 50%. Li and Lin (2012) applied MQL in a milling process with various cutting speeds and found that MQL improves cutting tool life and reduces surface roughness. Lawal et al. (2013) studied on assessment of different lubrication techniques, including high-pressure coolant, cryogenic cooling, air/vapor/gas coolant, and MQL. They concluded that MQL with vegetable oil stands out among other cooling techniques and yields superior machining performance. Therefore, their results demonstrated an excellent
Sustainable technologies for supplying cutting fluids for machining
Method of cutting fluid Spray External spray Internal spray Air-emulsion/water mixture Cutting fluid Flow rate Air-oil mixture Cryogenic Solid coolants/Lubricants Composition of cutting fluid 2–500 ml/h (MQL) 0 ml/h (Dry) HPC 2–500 ml/h (Cryogenic) Air-oil/nanoparticles mixture
4
performance of MQL compared to dry cutting and conventional lubrication in different cutting processes based on a reliable systematic approach.
Fig. 2. A schematic illustration of MQL (Ucun et al., 2013).
While machining with MQL, heat generated in the process is largely eliminated by the convection of compressed air with a smaller benefit from the evaporation of cutting oil (Su et al., 2006). Because the cooling capacity of this technique depends on
airflow, its implementation in place of conventional cooling is a complex challenge in many machining processes (Najiha et al., 2016). Several works have reported that MQL does not provide a significant reduction in heat in areas where many thermal problems occur. (Tai et al., 2012; Stephenson et al., 2014).
This fact limited wider industrial adoption of MQL by machining industry and
required more research for improvement of the heat capacity and lubricating effects of MQL. This can be achieved through the use of fluids with high thermal conductivity, such as nanofluids (Chon and Kihm, 2005; Bhattacharya et al., 2004). Nanofluids have several desirable characteristics, including better heat transfer performance. These characteristics also improve the heat transfer performance of the base fluids (Eastman et al., 1996; Liu et al., 2006; Mintsa et al., 2009). Application of
nanoparticles with cutting fluid as a coolant are still in the early stage. There are many different forms of nanomaterials, such as particles, rods, tubes, sheets, and fibers. Nanomaterials can be made of metals, oxides, nonmetals, carbides of metals, and nitrides of metals (e.g., TiO2, Al2O3, SiO2, CuO, single- and multi-walled carbon
5
Several researchers have noted that nanofluids show promising performance as potential replacements for conventional lubrication. Chatha et al. (2016) studied the influence of drilling with Al2O3 nanofluid of AL6063 under different cooling
conditions (e.g., dry, flooded, MQL, and MQL with nanofluid) on surface quality and tool. Their experimental results indicated that drilling under MQL with nanofluid yields a reduction in cutting force. Sharma et al. (2015) utilized carbon nanotubes with MQL during the turning of AISID2 steel. Study concluded that MQL with carbon nanotubes yields better results for temperature and surface quality. Najiha et al. (2015) applied TiO2 nanofluids with MQL to the end milling of Al6061 to
investigate the effects of machining parameters on flank wear patterns. They reported that 2.5% TiO2 added to MQL appears to be a feasible composition in terms of tool
damage. Rapeti et al. (2017) investigated the performance of nanofluids when turning AISI1040 steel with varying levels of MoS2. They reported that machining using a nanofluid with 0.5% MoS2 content yielded best results. They also compared the performance nanofluids containing single and combined Al2O3 and GnP, when
turning AISI 1040 steel under MQL. Study concluded that Al2O3 + GnP reduces
surface roughness and cutting force by 20.28% and 9.94%, respectively. A similar result was obtained by Rahmati et al. (2013) when applying MoS2 during the end milling of AL6061-T6, with an improvement in surface quality at 0.5 wt%.
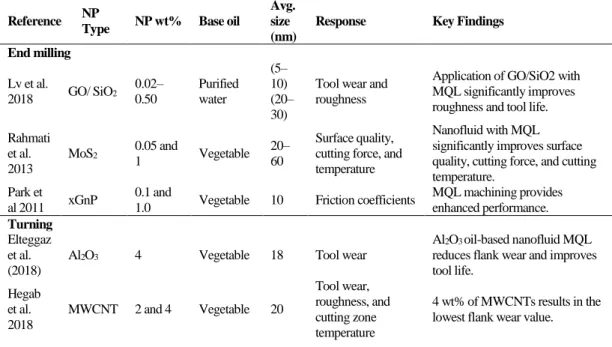
Table 1 Summary of previous studies on nanofluids in various machining processes
Reference NP
Type NP wt% Base oil
Avg. size (nm)
Response Key Findings
End milling Lv et al. 2018 GO/ SiO2 0.02– 0.50 Purified water (5– 10) (20– 30)
Tool wear and roughness
Application of GO/SiO2 with MQL significantly improves roughness and tool life. Rahmati et al. 2013 MoS2 0.05 and 1 Vegetable 20– 60 Surface quality, cutting force, and temperature
Nanofluid with MQL significantly improves surface quality, cutting force, and cutting temperature.
Park et
al 2011 xGnP
0.1 and
1.0 Vegetable 10 Friction coefficients
MQL machining provides enhanced performance. Turning Elteggaz et al. (2018)
Al2O3 4 Vegetable 18 Tool wear
Al2O3 oil-based nanofluid MQL reduces flank wear and improves tool life. Hegab et al. 2018 MWCNT 2 and 4 Vegetable 20 Tool wear, roughness, and cutting zone temperature 4 wt% of MWCNTs results in the lowest flank wear value.
6 Rahmeti et al. (2015) nMoS2 4 Vegetable 18 Cutting force, temperature, tool wear, roughness
Coconut oil + 0.5% nMoS2 yields less cutting force, temperature, tool wear, and better roughness. Drilling
Chatla et
al. 2016 Al2O3 1.5 vol% Soybean 20
Cutting force, tool wear, and roughness
Vegetable oil combined with NPs yields good results in terms of reducing friction and wear.
Furthermore, Lv et al. (2018) utilized GO/SiO2 with MQL during four-ball and milling tests. Their results revealed that nanofluids used for MQL reduce the friction during machining. Eltaggaz et al. (2018) reported that the best tool life is obtained during turning with a cutting velocity of 120 m/min and feed of 0.2 mm/rev using a combination of MQL + Al2O3 NPs. Park et al. (2011) investigated MQL + xGnP on
friction coefficients during the milling of AISI1045 steel and found that MQL machining provides enhanced performance. Hegab et al. (2018) investigated the influence of using various concentrations of MWCNT with MQL during titanium alloy turning. It was found that 2 wt% of MWCNT nanofluid reduces power load and flank wear. Table 1 compares remarkable previous studies on nanofluids in various machining processes with their experimental conditions and outputs.
1.1
Background for optimizing MQL techniques using nanoparticles
Recently, a major focus of the machining field has been identifying the proper
machining parameters for various materials under MQL using nanofluids. To achieve this goal, researchers analyze and optimize machining processes to determine optimal combinations of parameters.
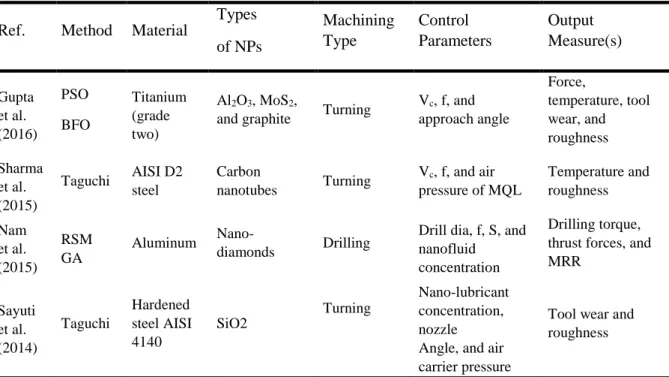
Traditional optimization methods such as the Taguchi or response surface method have been successful in many machining processes. These and other traditional methods have been used to identify local optimal solutions but they had low accuracy. Evolutionary techniques have also been implemented in certain machining processes such as genetic algorithms, artificial bee colonies, and particle swarm optimization and these achieve more accurate results (Table 2). Sharma et al. (2015) worked the turning of AISI D2 steel by using nanotubes with MQL based on the Taguchi method. Nam et al. (2015) focused on the optimization of micro-drilling under MQL using
7
nanodiamonds based on the response surface method and genetic algorithm. Their goal was to minimize torque and forces while maximizing material removal rate. It was demonstrated that a drill diameter of 0.5 mm with spindle speed of 59,000 RPM and nanofluid volumetric concentrations of approximately 2% is optimal. Gupta et al. (2016) used Al2O3, MoS2, and graphite for the turning of titanium alloys under MQL
using response surface method. Parametric optimization was performed using particle swarm optimization and bacterial foraging optimization. The results indicated that the best machining conditions were at cutting velocity of 215 m/min, feed of 0.10
mm/rev, and approach angle of 83°.
Although there are many studies on MQL in literature, there is a lack investigation on how to improve limited heat transfer capacity of MQL, which inhibits its wider industry adoption (Chon and Kihm, 2005; Bhattacharya et al., 2004). Although recent studies on nanoparticle added MQL shows promising results in this endeavor (Sharma et al. 2016), there are still several nanomaterials that demonstrated advanced heat transfer capability in other fields, and yet to be experimented with MQL.
Furthermore, for precision machining widely used by aviation, defense, and household goods industries, the enhancement of MQL with nanoparticles will
possibly lead to increase in energy consumption since surface roughness and specific cutting energy are often conflicting objectives (Gutowskiet al. 2006, Moradnazhad &
Table 2 Optimization studies on MQL with nanofluids
Ref. Method Material
Types of NPs Machining Type Control Parameters Output Measure(s) Gupta et al. (2016) PSO BFO Titanium (grade two) Al2O3, MoS2,
and graphite Turning
Vc, f, and approach angle Force, temperature, tool wear, and roughness Sharma et al. (2015) Taguchi AISI D2 steel Carbon nanotubes Turning Vc, f, and air pressure of MQL Temperature and roughness Nam et al. (2015) RSM GA Aluminum Nano-diamonds Drilling
Drill dia, f, S, and nanofluid
concentration
Drilling torque, thrust forces, and MRR Sayuti et al. (2014) Taguchi Hardened steel AISI 4140 SiO2 Turning Nano-lubricant concentration, nozzle Angle, and air carrier pressure
Tool wear and roughness
8
Unver 2016, Serin et al. 2019). Therefore, as novel contributions of this study to the literature, first we investigated the improvement potential of MQL with hexagonal boron nitride (hBN) which proved superior heat transfer capacity (Ilhan et al. 2016), on milling of Ti–6Al–4V material. Ti–6Al–4V made parts often demands high precision by aforementioned industries.
Lastly, we employed an evolutionary multi optimization technique in order to demonstrate this increasingly popular nanoparticle’s achievable minimum surface roughness and its trade-off with specific cutting energy for MQL application. We hope that the results of this study brings attention to academic community and industry that although the use of advanced nanoparticles such as hBN in MQL can yield to better results in surface quality, its trade-off with energy should be considered and investigated further in order to pursue holistic sustainability goals.
9
2. Experimental setup for slot milling under MQL with hBN
All of our experiments were carried out using a 3-axis CNC machine tool with
maximum spindle revolution of 8000 rpm. The work piece used for slot milling was a titanium alloy block Ti-6Al-4V with 50 × 50 × 100 mm dimensions. (Figure 3). During the experiments, six slots were milled along the work piece on each surface under various cooling conditions.
Fig. 3. Milling setup with MQL
Central Composite design (CCD), which is a popular class of designs used for fitting second-order models in Response Surface Method (RSM). It is widely used as they are efficient in terms of runs required (Montgomery and Runger 2018). In this study, CCD was implemented for designing the experiments with five factors, each having five levels, leading to total of 33 randomized runs. Use of five levels with CCD gives an advantage with larger than three factors, enabling reduction of total runs and testing some boundary values as well. The process factors and levels established by CCD are listed in Table 3.
Machining tests were conducted using coated cementite carbide (Al-Cr-Ni) cutting tool with 10-mm diameter. The cutting tool related factors are within the recommend limits of the tool manufacturer. All other experimental conditions are given in Table 4.
Direction of Feed
Work piece
Nozzle Cutting tool holder
10
Table 4 Experimental conditions
Machining Operation Slot Milling Work Piece Material Ti-6Al-4V
Cutting Tool Coated Cementite Carbide (coated Al-Cr-Ni), 10 mm dia.
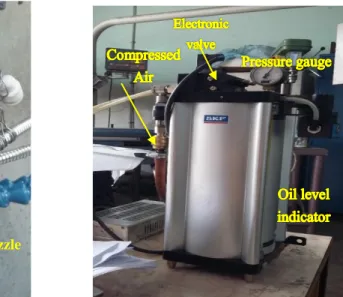
Cooling Technique MQL with hBN additive
MQL Technique
Cutting fluid type (Fetty acid ester) Nozzle angle fixed
Compressed air pressure (3 bar) hBN nanoparticles Average size 80–100 (nm)
Table 5 Design of experiments for MQL with hBN
Exp. No Vc (m/min) f (mm/tooth) ap (mm) Q (ml/h) NP’s (%) Responses Fc (N) Ra (µm) SEC (J/mm3) 1 65 0.035 2.3165 29.5 12.5 197.8 0.468 1.916 2 65 0.035 1.5 29.5 0.2525 220.4 0.454 3.297 3 65 0.035 1.5 29.5 12.5 151.4 0.357 2.265 4 56.835 0.035 1.5 29.5 12.5 170.9 0.266 2.557 5 73.165 0.035 1.5 29.5 12.5 107.8 0.365 1.613 6 65 0.035 1.5 40.1145 12.5 136.7 0.294 2.045 7 65 0.035 1.5 18.8855 12.5 222.2 0.411 3.324 8 65 0.010505 1.5 29.5 12.5 78.3 0.265 3.905 9 65 0.059495 1.5 29.5 12.5 120.9 0.511 1.068 10 65 0.035 1.5 29.5 24.7475 115.1 0.294 1.722 11 65 0.035 0.6835 29.5 12.5 110.5 0.337 3.628 12 70 0.02 2 23 20 170.9 0.254 3.356 13 60 0.02 1 23 20 166 0.306 6.519 14 60 0.02 2 36 20 136.7 0.231 2.684 15 70 0.02 2 36 5 144 0.219 2.828 16 70 0.02 1 23 5 129.4 0.322 0.051 17 70 0.05 1 23 20 146.5 0.395 2.301 18 60 0.02 2 23 5 227.9 0.301 4.475 19 65 0.035 1.5 29.5 12.5 158.7 0.329 2.374 20 60 0.05 2 23 20 244.1 0.534 1.917 21 65 0.035 1.5 29.5 12.5 151.4 0.361 2.265
Table 3 Process factors and levels using CCD
Factor Values Vc (m/min) 56.835 60 65 70 73.165 f (mm/tooth) 0.010505 0.02 0.035 0.05 0.059495 ap (mm) 0.6835 1 1.5 2 2.3165 Q (ml/h) 18.8855 23 29.5 36 40.1145 NP % 0.2525 5 12.5 20 24.7475 Coding −1.633 −1 0 1 1.633
11 22 70 0.05 2 36 20 246.6 0.472 1.937 23 70 0.02 1 36 20 129.4 0.267 5.082 24 65 0.035 1.5 29.5 12.5 159.2 0.401 2.382 25 60 0.05 1 23 5 229.5 0.485 3.605 26 60 0.02 1 36 5 97.66 0.234 3.835 27 70 0.05 2 23 5 285.6 0.571 2.243 28 60 0.05 1 36 20 119.6 0.329 1.879 29 65 0.035 1.5 29.5 12.5 166 0.359 2.480 30 65 0.035 1.5 29.5 12.5 159.2 0.367 2.382 31 60 0.05 2 36 5 222.2 0.445 1.745 32 70 0.05 1 36 5 97.66 0.531 1.534 33 65 0.035 1.5 29.5 12.5 164.7 0.371 2.464 2.1 Preparation of hBN nanofluid
This study investigated the possibility for improving the performance of MQL using hBN. Nanoparticles were mixed with a base fluid to create a nanofluid. A 2-step method was used to prepare the nanofluid with concentrations of 0.2525%, 5%, 12.5%, 20%, and 24.7475% in the base cutting fluid (fatty acid ester) using a
mechanical mixer. It was observed that all the mixtures remained stable for days (Fig. 4)
12
The average hBN particle size provided by the manufacturer was approximately 80 to 100 nm. In Table 6 densities of both base fluid and nanoparticle are given.
The amount of hBN required for preparing the nanofluids was calculated using the mixture formula in Equation (1). The weight of nanoparticles required for preparing 100 ml of hBN nanofluid is calculated the following formula,
% volume concentration = 𝑊ℎ𝐵𝑁 𝜌ℎ𝐵𝑁 𝑊ℎ𝐵𝑁 𝜌ℎ𝐵𝑁 + 𝑊𝑏𝑓 𝜌𝑏𝑓 , (1)
where 𝑾𝒉𝑩𝑵 is the weight of the nanoparticles, 𝝆𝒉𝑩𝑵is the density of the
nanoparticles, 𝑾𝒃𝒇 is the weight of the fluid, and 𝝆𝒃𝒇 is the density of the base fluid.
2.2.
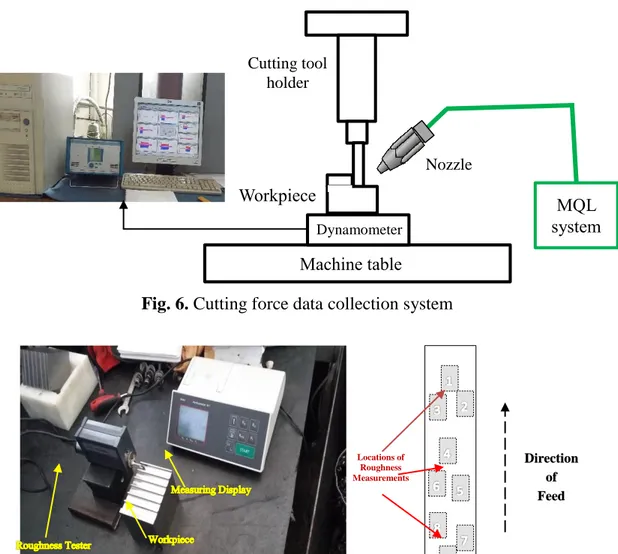
Cutting force and surface roughness measurement
To measure machining forces during slot milling, blocks of Ti-6Al-4V were mounted on top of a three-axis dynamometer (KISTLER 9257-B). The setup for cutting force measurement (see Figs. 5 and 6) and a charge amplifier were connected to a PC for data collection during experiments. To measure the cutting force components (Fx, Fy,
Fz) and for computational analysis of signal trends during the slot milling
experiments, DynoWareTM software was used. Measurements of surface roughness (see Figs. 6 and 7) were performed using a Mahr Perthometer M1. The surface roughness was measured along the machining direction. All measurements represent the averages of 3 values measured at the tool entry, center, and exit area of each slot for constructing a statistical regression model.
Table 6 Density of base fluid andNPs
Cutting fluid (fatty acid ester) 0.92 g.cm−3
13
Fig. 5. Sample cutting force measurement
Fig. 6. Cutting force data collection system
Fig. 7. Locations of roughness measurements
F x [N] Cy c l e No .: 1 M e a n = -1 0 7 .4 e 0 M i n = -1 9 0 .3 e 0 M a x = -1 6 . 3 7 e 0 In te g ra l = -1 . 1 5 8 e 3 F y [N] Cy c l e No .: 1 M e a n = 5 3 .1 4 e 0 M i n = -1 4 .8 4 e 0 M a x = 1 2 6 .0 e 0 In te g ra l = 5 7 2 .7 e 0 F z [N] Cy c l e No .: 1 M e a n = 3 .1 5 5 e 0 M i n = -3 9 .8 2 e 0 M a x = 4 3 .5 1 e 0 In te g ra l = 3 4 .0 1 e 0 5 10 15 20 25 30 35 40 -300 -250 -200 -150 -100 -50 0 50 100 150 200 Time [s]
deney 1g v.65 f:0.035 a:1.5 mql:1 tur
Cycle No.: 1 Filter ing on Fx [N ] Fy [N ] Fz [N ] Direction of Feed Locations of Roughness Measurements Workpiece Dynamometer Machine table MQL system Nozzle Cutting tool holder
14
3. Results and discussion
3.1
Analysis of variance (Ra and Fc)
Statistical analysis of the data was carried out in the form of variance analysis using the Minitab 17TMsoftware. To analyze the impact of each control parameter on the responses, analysis of variance (ANOVA) test was performed (Fig. 8). A confidence level of 95% (P-value < 0.005) was adopted. In Table 7, one can see that based on the P-values, all control parameters have statistically significant effect on the cutting force except for cutting speed. Based on F-Values, the order of influence is as feed, depth of cut, nanoparticle concentration and volumetric flow rate. Table 8 reveals similar results for surface roughness. However, based on F-Values, the order of influence is as feed, volumetric flow rate, nanoparticle concentration and depth of cut. As it can be viewed in both Tables 7 and 8, the contribution of the Model(R-sq) as calculated by Minitab 17TM indicates that the model accuracy for cutting force is 94.90%, while that for roughness is 95.13%. Also note that, quadratic and cross-interactions are not included in the ANOVA tables in order to keep them brief to reveal influence of only main parameters.
Fig. 8. Impact of control parameters on (a) cutting force and (b) surface roughness
under MQL with hBN
Table 7 ANOVA for cutting force
Source DF Adj SS Adj MS F-Value P-Value Contribution Model 21 67453.5 3212.1 9.75 0.00 94.90% Linear 5 57408.7 11481.7 34.86 0.00 80.77% Vc (m/min) 1 168.7 168.7 0.51 0.49 0.24% f (mm/tooth) 1 40386.3 40386.3 122.61 0.00 56.82% ap (mm) 1 12593 12593 38.23 0.00 17.72% Q (ml/h) 1 1785.7 1785.7 5.42 0.04 2.51% NP concentration (%) 1 2474.9 2474.9 7.51 0.02 3.48% a b
15
S 18.1487
R-sq 94.90%
R-sq(adj) 85.17%
Table 8 ANOVA for surface roughness
Source DF Adj SS Adj MS F-Value P-Value Contribution Model 21.000 0.282 0.013 10.240 0.000 95.13% Linear 5.000 0.239 0.048 36.510 0.000 80.78% Vc (m/min) 1.000 0.005 0.005 3.840 0.076 1.70 % f (mm/tooth) 1.000 0.193 0.193 147.41 0.000 65.23% ap (mm) 1.000 0.006 0.006 4.950 0.048 2.19% Q (ml/h) 1.000 0.019 0.019 14.250 0.003 6.31% NP concentration (%) 1.000 0.016 0.016 12.090 0.005 5.35% S 0.03619 R-sq 95.13% R-sq(adj) 85.84% 3.2.
Response surface analysis of cutting force and surface roughness
The regressions, fitted by Minitab 17TMas a result of RSM for surface roughness and cutting force are given in Equations (2) and (3), respectively. A second-order
regression is used to express the models as all control factors have five levels.
Regression model for surface roughness (2)
Surface Roughness (Ra) = −1.86 + 0.0832 Vc − 10.08 f+ 0.032 ap − 0.0375 Q + 0.0128 (NP%) 0.000728 Vc × Vc + 39.9 f × f + 0.0577 ap × ap − 0.000102 Q × Q + 0.000066 (NP%) × (NP%) + 0.155 Vc × f − 0.00390 Vc × ap + 0.000642 Vc × Q − 0.000317 Vc × (NP%) + 3.38 f × ap + 0.0154 f × Q − 0.1578 f × (NP%) − 0.00281 ap × Q + 0.00383 ap × (NP%) + 0.000077 Q × (NP%)
Regression model for cutting force (3)
Cutting Force (N) = −1016 + 23.5 Vc + 8043 f − 152 ap + 17.9 Q + 11.82 (NP%) − 0.163 Vc × Vc – 32835 f × f + 35.5 ap × ap − 0.039 Q × Q + 0.0164 (NP%) × (NP%) − 5.7 Vc × f + 2.56 Vc × ap − 0.145 Vc × Q − 0.174 Vc × (NP%) + 1008 f × ap − 111.6 f × Q − 55.4 f × (NP%) − 2.96 ap × Q − 1.63 ap × (NP%) + 0.0681 Q × (NP%)
16
The cutting force values obtained during slot milling under MQL + NP conditions reveal that the maximum value of cutting force was 285.6 (N) and the minimum value was 78.3 (N), as shown in Table 5.
Fig. 10 presents 3D surface plots of the cutting force. One can see that increasing feed and depth of cut values result in increase of cutting force. However, the influence of cutting force does not exist, as it is nearly horizontal. Additionally, as flowrate and nanoparticle concentration increase the cutting force is reduced. This finding supports the ANOVA results for cutting force as shown in Table 7.
17
Fig. 10. Response plots for cutting force
Experimental results indicate that surface roughness is affected by the control parameters used during the slot milling process. It was found that as feed per tooth increases, surface quality deteriorates. This outcome agrees with the results of previous studies (Sun et al., 2006). The lowest and highest roughness values under MQL + NP conditions were 0.219 μm and 0.571 μm, respectively.
To observe the effects of control parameters on roughness under MQL + NP
18
as well. It can clearly be seen from the plots that surface roughness increases with increased feed, and depth of cut, however it reduces with increased flow rate and nanoparticle concentration.
19
3.3.
Influence of hBN concentration and MQL flow rate
To achieve a better understanding of the effectiveness of adding hBN to cutting fluid during MQL, cutting force and surface roughness were compared under fixed
machining parameters (Vc = 65 m/min, f = 0.035 mm/tooth, ap =1.5 mm and Q = 29.5
ml/h) with various hBN concentration values (0.25%, 12.5%, and 24.75%). Fig. 15 reveals that an increasing concentration of hBN in cutting fluid leads to a decrease in cutting force and roughness. Notably, MQL with a concentration of hBN of 24.75% results in large reductions of 19.8% for cutting force and 35.24% for surface
roughness. The lowest reductions are 17.81% for cutting force and 27.53% for roughness with nanoparticle concentration of 24.75%.
These results clearly prove that surface quality can be improved drastically while reducing cutting force as well, by adding hBN nanoparticles.
Fig. 15. Influence of hBN NP concentration on cutting force and surface roughness
0 0.1 0.2 0.3 0.4 0.5 0.25% 12.50% 24.75% Su rf ace Rou gh n es s (µm) NP Concentration (%) 0 50 100 150 200 250 NPs = 0.2525% NPs = 12.5% Nps = 24.747% C u ttin g Fo rce ( N) NP Concentration (%)
20
In the same context, comparisons were performed to clarify the effects of various fluid flow rates to cutting force and surface roughness under the same milling
conditions above, with similar values of hBN concentration. In Fig. 16, a trend can be observed in which an increasing flow rate of cutting fluid leads of a decrease in both cutting force and surface roughness as well. When milling with a flow rate of 40.11 ml/h, cutting force and roughness are reduced by 42.55% and 28.47%, respectively, compared to a flow rate of 18.885 ml/h.
Fig. 16. Influence of MQL flow rate on cutting force and surface roughness
0 50 100 150 200 250 300 Q = 18.8855 (ml/h) Q = 29.5 (ml/h) Q = 40.1145 (ml/h) C ut ti ng f or ce ( N )
Flow rate of cutting fluid (ml/h)
0 0.05 0.1 0.15 0.2 0.25 0.3 0.35 0.4 0.45 Q = 18.8855 (ml/h) Q = 29.5 (ml/h) Q = 40.1145 (ml/h) Su rf ace R ou gh nes s (µm )
21
4. Multi-objective optimization using PSO for energy efficiency
Approximately 15% to 35% of energy consumed by a CNC Machine tool is used directly in cutting process, whereas the rest is used for auxiliary and idling functions such as machine cooling, coolant systems, pumps, tool change and PC/control systems (Gutowski et al. 2006). Just idling energy can be as large as 60% with advanced, high precision machine tools with multi-processing capability (Moradnazhad and Unver 2017).
Optimization of energy consumption often requires multi-objective approach, since sole objective of energy reduction will conflict with other operational objective such as material removal rate, surface quality (Lu et al. 2016, Serin et al. 2019) and production economics (Li Congbo et al 2017). As MQL augmented by hBN both reduces surface roughness and cutting force which effects overall energy efficiency, hereon it is critical to use a multi objective approach to investigate the trade-off between surface quality and energy efficiency. Hence, it would be possible to generate manufacturing scenarios for industries which demands high precision but also aims for boarder sustainability goals, including waste reduction and energy efficiency.
In this study, multi-objective particle swarm optimization (MOPSO) was selected because it is relatively easy to implement for solving problems featuring multiple objectives and nonlinearity. PSO is inspired from the social behaviors observed in animal swarms. In PSO, every solution is called a particle. Particles fly through the search space to find a global optimal solution. Particles update their velocities based on their previous experience within the search space. Three parametersare responsible for updating the velocities of particles, namely social, cognitive, and inertia
parameters. The social parameter accounts for finding the global best (gbest) position for a particle, meaning it accelerates particles to reach the best position. The cognitive parameter moves particles toward the personal best (pbest) solution, which is best position found up to any given iteration. By comparing the pbest and gbest positions, the gbest position can be updated iteratively. Equation (1) is adopted to determine when gbest should replace pbest and Equations (4) and (5) are used to compute the next position of the ith particle.
22
𝑣𝑖𝑘+1= 𝑤. 𝑣𝑖𝑘+ 𝑐1. 𝑅1. (𝑝𝑏𝑒𝑠𝑡𝑖 − 𝑥𝑖𝑘) + 𝑐2. 𝑅2. (𝑔𝑏𝑒𝑠𝑡 − 𝑥𝑖𝑘) (4)
𝑥𝑖𝑘+1 = 𝑥𝑖𝑘+ 𝑣𝑖𝑘+1, (5)
where K is the iteration number, vki is the velocity of the ith particle, w is inertia
weight, c1 and c2 are the learning rates, and R1 and R2 are two random numbers in the range [0, 1].
As the problem was modeled as MOPSO with 2 objective functions which were outputs of the RSM regression; f1(x) for surface roughness given in Equation (2) and f2(x) as specific cutting energy (SEC), computed with Equation (7), by using cutting force given in Equation (3) , Hence multi objective problem with its constraints can be defined as follows:
Minimizing {f1(x), f2(x)}, such that (6) 56.835 ≤ Vc ≤ 73.165
0.0105 ≤ f ≤ 0.05949 0.6835 ≤ ap ≤ 2.3165 18.8855 ≤ Q ≤ 40.1145 0.2525 ≤NPs ≤ 24.7475
SEC is calculated using cutting force using Equation (7), as given below.
𝑆𝐸𝐶 = 𝐹𝑐 𝑉𝑐
𝑓 × 𝑎𝑝 × 𝑎𝑒, where ae is the cutting width. (7)
This problem was solved using the MOPSO algorithm implemented in MATLAB. Following execution of the MOPSO algorithm, the Pareto frontier converged to a set of solutions in the multi-objective domain. All possible solutions were plotted in a variable domain representing the optimal level of each parameter. Simulations were performed using a particle swarm population of 250 and maximum number of
23
each iteration, the particles were plotted in a 2D objective space for observation. This procedure was repeated until a clear Pareto frontier formed. Table 9 lists the
parameters used for MOPSO. The developed MOPSO algorithm are presented in Fig. 17. The final non-dominated Pareto optimal curve and solution space are presented in Fig. 18.
Fig. 17. Flow chart for the MOPSO algorithm Table 9 MOPSO Parameters
Number of Parameters 5 Number of Iterations 200
Population Size 500
Inertia weight (w) 0.9 Personal Learning Coeff.(c1) 2.5 Global Learning Coeff (c2) 1.5
Xmin [56.8 0.0105 0.684 18.885 0.2525 ] Xmax [73.2 0.0594 2.316 40.115 24.7475]
For each particle Update V Next Iteration Next particle PSO Initialization If (x) < f(gBest) gBest =x If (x) < f(pBest) pBest =x Update x Evaluate f(x) Satisfy Termination Criterion Solution is gBest N Y
24
To validate the MOPSO algorithm results, three experiments were carried out using three distinct locations on the Pareto curve, which identifies possible manufacturing strategies for distinct industries, as such; Scenario 1) High Precision, Scenario 2) Overall Sustainability, Scenario 3) High Energy efficiency. The errors between the MOPSO results and experimental values were calculated using Equation (8). The results of the validation experiments and the calculated errors are listed in Table 10.
𝑃𝑒𝑟𝑐𝑒𝑛𝑡𝑎𝑔𝑒 𝑒𝑟𝑟𝑜𝑟 = |Experimental value − MOPSO results
Experimental value | × 100 (8)
Fig. 18. Pareto optimal solution set resulted by MOPSO Solution space
Pareto curve
2
1 3
25
Table 10 Comparison of MOPSO and experimental results
MOPSO optimal values Surface roughness (µm)
Error (%) SEC (J/mm3) Error (%) Vc (m/min) f (mm/tooth) ap (mm) Q (ml/h) NPs (%) PSO result Exp. result PSO result Exp. result Sn1 56.8 0.0105 2.2 40.1 12.15 0.13 0.13 2.87 7.134 6.99 1.93 Sn2 73.165 0.0105 1.9 18.8 0.252 0.24 0.23 3.79 3.946 3.91 0.87 Sn3 73.165 0.0105 0.81 18.8 0.252 0.37 0.37 2.37 1.154 1.17 2.03 5. Conclusions
This study explored the performance of slot milling of a Ti-6Al-4V under MQL with various concentrations of hBN nanoparticles and investigated the influence of
machining parameters on surface quality and cutting forces. The ANOVA and RSM were utilized to analyze the influence of machining parameters on responses.
Furthermore, the RSM regression results and MOPSO were combined to further improve energy-efficiency of the process. The results of this study can be summarized as follows:
1. A total of 33 randomized runs are performed for slot milling Ti–6Al–4V, based on central composite design using cutting velocity, feed, depth of cut, flowrate and nanoparticle concentration as control factors.
2. ANOVA results revealed that feed is the most influential factor on both cutting force and surface roughness, as directly proportional. Furthermore, it was identified that both cutting force and surface roughness increases as depth of cut is increased, and it decreases if flowrate and nanoparticle concentration is increased.
3. MQL combined with hBN nanoparticles proved to be an effective solution and an alternative approach to improving cooling conditions during the machining of Ti–6Al–4V in terms of reducing surface roughness and cutting force compared to plain MQL. Increasing the flow rate of cutting fluid to 40.1145 ml/h when
milling under MQL + NP conditions led the least cutting force and increasing nanoparticle concentration to 24.75% led to best surface roughness.
4. In order to achieve boarder sustainability, MOPSO were applied to further improve energy efficiency of the MQL + NP milling process. A Pareto frontier was generated which signifies the trade-off between surface quality and energy consumption. Using the frontier, 3 scenarios were selection for verification. With
26
maximum 3.79% error, the experimental verification proved that developed RSM regressions and MOPSO results are acceptable.
5. Verified scenarios could be different machining strategies for various industries rely on machining of Ti–6Al–4V. Scenario 1) High Precision, is critical for aviation and defense industry, which use titanium alloy parts in critical components such as engines, that requires high precision and surface quality. Energy efficiency is secondary interest for such firms. Scenario 2) Overall Sustainability, would be preferable for household goods industry, such as appliance manufacturers. These companies, such as Arçelik A.Ş. in Turkey (Uluer et al. 2016), relentlessly work for improving their overall sustainability scorecards in terms of both reduction of waste and boosting energy efficiency in their factory operations and many of their products require reasonable surface precision of parts, as well. Scenario 3) High Energy efficiency can be utilized for industries where energy efficiency and associated costs are critical for survival. These would be first or second tier suppliers of automotive industry, that produce non-critical parts and very cost sensitive in business nature.
5.1 Implications on theory and practice for sustainability
In order to enhance thermal properties of fluids, nanoparticles have been investigated by many scholars since last decade. Ozerinc et al. (2010) summarized experimental studies of thermal conductivity enhancement of particle types such as Al2O3, SiO2,
SiC, TiO2, Al2Cu, DWCNT, MWCNT (without any note of hBN). The main reason is
that suspended particles increase the surface area and the heat capacity of the fluid. Among all the particle types, maximum enhancement was achieved by MWCNT with 79%. Sharma et al. (2016) reviewed use of similar nanoparticles with various base fluids during tuning, drilling, milling and grinding, and concluded that nanoparticle addition to cutting fluid reduces the cutting force, surface roughness and cutting zone temperature and tool wear.
Hexagonal Boron Nitride is one of the least utilized nanoparticles for thermal enhancement, yet. As a recent study, Ilhan et al. (2016) investigated heat transfer enhancement and viscosity change of hBN nanofluids and concluded that hBN shows a remarkable thermal conductivity increase for dilute suspensions. Our study
contributes to research on hBN applications by using it with MQL for machining of difficult-to-cut alloys. Our investigation on effects of output measures agreed with
27
similar nanoparticle enhanced MQL machining research, where cutting forces and surface roughness is reduced with increasing particle concentration and flowrate. To achieve overall sustainability, for many industrial firms, reduction of waste such as coolants is required but not sufficient. The efforts to make MQL more enhanced with nanoparticles, may lead to its wider adoption by manufacturing industry. However, achieving good surface quality still require further optimization of cutting parameters such as feed and depth of cut. While these parameters must be lowered to achieve better surface quality, energy efficiency of the operation will be impacted. Hence, it is imperative to keep energy efficiency under control, based on operational objectives of the company, whether on or not advanced techniques are used for coolant reduction. In order to fulfill this multi-objective problem, a novel MOPSO algorithm was
developed. The output Pareto curve indicated several regions which can be adopted by different industries, in order to achieve sufficient surface quality per part
requirements, without sacrificing energy efficiency. However, other barriers, for reaching overall sustainability exists by industry. Preparation of nanoparticle suspension is still time consuming and costly, furthermore stability of the nanofluid may not be good enough for industrial settings. These issues need to be worked out for wider industrial adoption. More comparative academic studies of hBN against other nanoparticles should also be performed in machining, to prove it superiority. Particularly for Turkey, potential application areas of hBN could be very beneficial from economic standpoint, as Turkey supplies 59% of worldwide Boron demand (https://www.enerji.gov.tr/tr-TR/Sayfalar/Bor). As Turkey continues to expand its manufacturing footprint in many industries, future research can be fruitful on hBN, with more detailed property and parameter effect analysis such as particle size or base fluid under MQL for a variety of other material removal processes.
28
References
Bhattacharya, P.S.S.K., Saha, S.K., Yadav, A., Phelan, P.E., Prasher, R.S., 2004. Brownian dynamics simulation to determine the effective thermal conductivity of nanofluids. J. Appl. Phys. 95 (11), 6492–6494.
Chon, C., Kihm, K., 2005. Thermal conductivity enhancement of nanofluids by Brownian motion. J. Heat. Transf. 127 (8), 810.
Chatha, S.S., Pal, A., Singh, T., 2016. Performance evaluation of aluminum 6063 drilling under the influence of nanofluid minimum quantity lubrication. J. Clean. Prod. 137, 537–545.
Dhar, N.R., Kamuzzaman, M., Ahmed, M., 2006. Effect of minimum quantity lubrication (MQL) on tool wear and surface roughness in turning AISI-4340 steel. J. Mater. Process. Technol. 172 (2), 299–304.
Eastman, J.A., Choi, US., Thompson, L.J., Lee, S.,1996. Enhanced thermal conductivity through the development of nanofluids. Mater. Res. Soc. Symp. Pro. 457, 3–11.
Eltaggaz, A., Hegab, H., Deiab, I., Kishawy, H.A., 2018. Hybrid nano-fluid-minimum quantity lubrication strategy for machining austempered ductile iron (ADI). Int. J. on Interac. Des. Manuf. (IJIDeM). 12 (4),1273–1281.
Erdel, B.P., 1999. Environmental issues in machining. SME Mach. Technol. 10 (4) Gupta, M.K., Sood, P.K., Singh, G., Sharma, V.S., 2017. Sustainable machining of aerospace material–Ti (grade-2) alloy: Modeling and optimization. J. Clean. Prod. 147, 614–627.
Gupta, M.K., Sood, P., Sharma, V.S., 2016. Optimization of machining parameters and cutting fluids during nano-fluid based minimum quantity lubrication turning of titanium alloy by using evolutionary techniques. J. Clean. Prod. 135, 1276–1288. Gutowski, T., Dahmus, J., Thiriez, A., 2006. Electrical energy requirements of manufacturing processes. 13th CIRP Int. Conference on Life Cycle Engineering, Leuven.
Moradnazhad, M., Unver, H.O., 2017. Energy efficiency of machining operations: A review. Proceedings of the Institution of Mechanical Engineers, Part B: Journal of Engineering Manufacture. 231(11),1871-1889.
Moradnazhad, M., Unver, H.O., 2017. Energy consumption characteristics of turn-mill machining. Int. J. Adv. Manuf. Technol. 91, 1991–2016, doi:10.1007/s00170-016-9868-6
29
Serin, G., Ozbayoglu, M.O., Unver, H.O., 2019. Integrated energy-efficient machining of rotary impellers and multi-objective optimization. Materials and Manufacturing Processes. DOI: 10.1080/10426914.2019.1605177
Hua Li, L., Chen, Y., Cheng, B. M., Lin, M.Y., Chou, S.L., Peng, Y.C., 2012.
Photoluminescence of boron nitride nano sheets exfoliated by ball milling. App. Phys. Let. 100 (26), 261108.
Hegab, H., Umer, U., Deiab, I., Kishawy, H., 2018. Performance evaluation of Ti– 6Al–4V machining using nano-cutting fluids under minimum quantity lubrication. J. Adv. Manuf. Technol. 95 (9), 4229-4241.
Ilhan, B., Kurt, M., Erturk, H., 2016. Experimental investigation of heat transfer enhancement and viscosity change of hBN nanofluids. Experimental Thermal and Fluid Science. 77, 272-283.
Joshi K.K, Kumar R, Anurag, 2018. An Experimental Investigations in Turning of Incoloy 800 in Dry, MQL and Flood Cooling Conditions. Procedia Manuf. 20, 350– 357.
Krajinik, P., et al. 2016.Transitioning to sustainable production – Part 3: developments and possibilities for integration of nanotechnology into material processing technologies. J. Clean. Prod. 112, 1156-1164.
Lawal, S.A., Choudhury I.A., Nukman, Y., 2013. A critical assessment of lubrication techniques in machining processes: a case for minimum quantity lubrication using vegetable oil-based lubricant. J. Clean. Prod. 41, 210–221
Li, M., Yu, T., Zhang, R., Yang, L., Li, H., Wang, W., 2018. MQL milling of TC4 alloy by dispersing graphene into vegetable oil-based cutting fluid. Int. J. Adv. Manuf. Technol. 99 (5–8), 1735–1753.
Liu M.-S., Lin M.C.-C., Huang I.-T., Wang C.-C., 2006. Enhancement of thermal conductivity with CuO for nanofluids. Chem. Eng. Technol. 29(1),72–77.
Lu, C., Gao, L., Li, X., Chen, P., 2016.Energy-efficient multi-pass turning operation using multi-objective backtracking search algorithm. J. Clean. Prod. 137, 1516–1531. Li, C., Chen, X., Tang, Y., Li, L., 2017. Selection of optimum parameters in multi-pass face milling for maximum energy efficiency and minimum production cost. J. Clean. Prod. 140, 1805-1818.
Lv, T., Huang, S., Hu, X., Ma, Y., Xu, X., 2018. Tribological and machining
characteristics of a minimum quantity lubrication (MQL) technology using GO/SiO 2 hybrid nanoparticle water-based lubricants as cutting fluids. Int. J. Adv. Manuf. Technol. 96(5-8), 2931-2942.
McClure, T.F., Adams, R., Gugger, M.D., 2001. Comparison of Flood vs. Micro Lubrication on Machining Performance. Available at:
30
Mintsa, H.A., Roy, G., Nguyen, C.T., Doucet, D., 2009. New temperature dependent thermal conductivity data for water-based nanofluids. Int. J. Therm. Sci. 48 (2), 363– 371.
Montgomery, D.C., Runger, G.C., 2018. Applied Statistics and Probability for Engineers. 7th Ed., Wiley.
Najiha, M.S., Rahman, M.M., Kadirgama, K., 2016. Performance of water-based TiO2 nanofluid during the minimum quantity lubrication machining of aluminium alloy, AA6061-T6. J. Clean. Prod. 135, 1623–1636.
Nam, J.S., Kim, D.H., Chung, H., Lee, S.W., 2015. Optimization of environmentally benign micro-drilling process with nanofluid minimum quantity lubrication using response surface methodology and genetic algorithm. J. Clean. Prod. 102, 428–436. Okada, M., Hosokawa, A., Asakawa, N., Ueda, T., 2014. End milling of stainless steel and titanium alloy in an oil mist environment. J. Adv. Manuf. Technol. 74 (9–12), 1255–1266.
Ozerinc, S., Kakac, S., Yazicioglu, A.G., 2010. Enhanced thermal conductivity of nanofluids: a state-of-the-art review, Microfluid Nanofluid. 8: 145-170.
Park, K.H., Ewald, B., Kwon, P.Y., 2011. Effect of nano-enhanced lubricant in minimum quantity lubrication balling milling. J. Tribol. 133 (1–8), 031803.
Pusavec, F., Krajinik, P., Kopac, J. 2010.Transitioning to sustainable production – Part 1: application on machining technologies. J. Clean. Prod. 18, 174-184.
Rapeti, P., Pasam, V. K., Gurram, K. M. R., Revuru, R. S., 2018. Performance evaluation of vegetable oil-based nano cutting fluids in machining using grey relational analysis-A step towards sustainable manufacturing. J. Clean. Prod. 172, 2862–2875.
Rahim, E.A., Dorairaju, H., Asmuin, N., Mantari, M.H.A.R., 2015. Determination of Mist Flow 15 Characteristic for MQL Technique Using Particle Image Velocimetry (PIV) and Computer 16 Fluid Dynamics (CFD). Appl. Mech. Mater. 773, 403–407. Republic of Turkey Ministry of Energy and Natural Resources, Information Center, (T.C. Enerji ve Tabii Kaynaklar Bakanlığı, Bilgi Merkezi), “Bor, yeryüzünde toprak, kayalar ve suda yaygın olarak bulunan bir elementtir.”,
https://www.enerji.gov.tr/tr-TR/Sayfalar/Bor, Accessed at 12/12/2019
Rotella, G., Dillon Jr., O.W., Umbrello, D., Settineri, L., Jawahir, I.S., 2014. The effects of cooling conditions on surface integrity in machining of Ti6Al4V alloy. Int. J. Adv. Manuf. Technol. 71 (1–4), 47–55.
Rahmati, B., Sarhan, A.A.D., Sayuti, M., 2013. Morphology of surface generated by end milling AL6061-T6 using molybdenum disulfide (MoS2) nanolubrication in end milling machining. J. Clean. Prod. 66, 685–691.
31
Sahu N.K., Andhare A.B., 2018. Multiobjective Optimization for improving
Machinability of Ti-6Al-4V using RSM and Advanced algorithms. J. Comput. Des. Eng. 6 (1), 1–12.
Sharma, J., Singh, B.S. 2014. Investigation of Effects of Dry and Near Dry Machining on AISI D2 Steel using Vegetable Oil. J. Clean Prod., 66, 619–623.
Sharma, P., Sidhu, B.S., Sharma, J., 2015. Investigation of effects of nanofluids on turning of AISI D2 steel using minimum quantity lubrication. J. Clean Prod. 108, 72– 79.
Sharma, A.K., Tiwari, A.K., Dixit, A.R. 2016. Effects of Minimum Quantity Lubrication in machining processes using conventional and nanofluid based cutting fluids: A comprehensive review. J. Clean Prod. 127, 1-18.
Singh, R.K., Dixit, A.R., Mandal, A., Sharma, A.K., 2017. Emerging application of nanoparticle-enriched cutting fluid in metal removal processes: a review. J. Braz. Soc. Mech. Sci. & Eng. 39 (11), 4677–4717.
Stephenson, D.A., Skerlos, S.J., King, A.S., Supekar, S.D., 2014. Rough turning inconel 750 with supercritical CO2-based minimum quantity lubrication. J. Mater. Process. Technol. 214 (3), 673–680.
Su, Y., He, N., Li, L., Li, X.L., 2006. An experimental investigation of effects of cooling/lubrication conditions on tool wear in high-speed end milling of Ti-6Al-4V. Wear. 261 (7–8), 760–766.
Sun J., Wong Y.S., Rahman M., Wang Z.G., Neo K.S, Tan C.H., Onozuka H., 2006. Effects of coolant supply methods and cutting conditions on tool life in end milling titanium alloy. Mach. Sci. Technol. 10 (3), 355–370.
Sayuti, M., Sarhan, A.A., Salem, F., 2014. Novel uses of SiO2 nano-lubrication system in hard turning process of hardened steel AISI4140 for less tool wear, surface roughness and oil consumption. J. Clean. Prod. 67, 265–276.
Tai, B.L., Stephenson, D.A., Shih, A.J., 2012. An inverse heat transfer method for determining workpiece temperature in minimum quantity lubrication deep hole drilling. J Manuf. Sci. E-T ASME. 134 (2), 021006.
Ucun, İ., Aslantas, K., Bedir, F., 2013. An experimental investigation of the effect of coating material on tool wear in micro milling of Inconel 718 super alloy. Wear. 300 (1–2), 8–19.
Uluer, M.U., Unver, H.O., Gok, G., Unver, N.F., Kilic, S.E. 2016.A framework for energy reduction in manufacturing process chains(E-MPC) and a case study from the Turkish household appliance industry. J. Clean. Prod. 112, 3342-3360.
Yazid M.Z.A., CheHaron C.H., Ghani J.A., Ibrahim G.A., Said A.Y.M., 2011. Surface integrity of Inconel 718 when finish turning with PVD coated carbide tool under MQL. Procedia Eng. 19, 396–401.
32
Veleva, V., Ellenbecker, M. 2001.Indicators of sustainable production: framework and methodology. J. Clean. Prod. 9, 519-549.
Weinert, K., Inasaki, I., Sutherland, J.W., Wakabayashi, T., 2004. Dry machining and minimum quantity lubrication. CIRP Annals, 53(2), 551-537.