INSTITUTE OF HEALTH SCIENCE
A COMPARISON OF IMMEDIATE EFFECTS OF PASSIVE
STRETCHING EXERCISES AND MANUAL THERAPY
TECHNIQUES FOR REDUCING STIFFNESS ON MUSCLE AND
TENDON UNIT OF QUADRICEPS FEMORIS MUSCLE
Haris BEGOVIC
Program of Physical Therapy and Rehabilitation Philosophy of Doctoral (PhD) Thesis
ANKARA 2014
HACETTEPE UNIVERSITY INSTITUTE OF HEALTH SCIENCE
A COMPARISON OF IMMEDIATE EFFECTS OF PASSIVE
STRETCHING EXERCISES AND MANUAL THERAPY
TECHNIQUES FOR REDUCING STIFFNESS ON MUSCLE AND
TENDON UNIT OF QUADRICEPS FEMORIS MUSCLE
Haris BEGOVIC
Program of Physical Therapy and Rehabilitation Philosophy of Doctoral (PhD) Thesis
ADVISOR OF THE THESIS Prof. Dr. Filiz CAN ( PT, PhD, Full Prof.)
ANKARA 2014
ACKNOWLEDGEMENT
I thank to my advisor, Prof. Dr. Filiz CAN, who has given great effort for designing the hypothesis, methodology and all other parts of the thesis. Her scientific and moral supports have encouraged me to work hardly throughout of my PhD studentship period. She has always encouraged me to go deeply into basic medical sciences to strengthen physiotherapy both scientifically and clinically.
My special thanks to Prof. Dr. Necla OZTÜRK for her scientific, technical and moral support. She was always next to me during my laboratory research and been the saver in my most difficult moments. She taught me how much is important to understand muscle dynamics through biophysical rules and she enabled me to establish a strong connection between biophysics and physiotherapy.
My second special thanks should go to the Associate Professor Suha Yağcıoğlu. I managed to work on the laboratory due to his enabling to all equipments working actively.
Lastly, I would like to thank to my friend, mechanical engineer Riza Emre Ergun, who has manufactured the testing device for my research and, also to my family for their moral support.
ABSTRACT
HARIS BEGOVIC, A COMPARISON OF IMMEDIATE EFFECTS OF
PASSIVE STRETCHING EXERCISES AND MANUAL THERAPY
TECHNIQUES FOR REDUCING STIFFNESS ON MUSCLE AND TENDON UNIT OF QUADRICEPS FEMORIS MUSCLE, DOCTORAL THESIS IN THE PROGRAM OF PHYSIOTHERAPY AND REHABILITATION, ANKARA, 2014. Stretching exercises and manual therapy techniques are commonly used in order to reduce stiffness of muscle and tendon. It is suggested that muscle dynamics consisting of excitation-contraction coupling, electromechanical delay and muscle fiber vibration and force output may be altered using these thechniques. Time delays between onset of electromyographic (EMG), mechanomyography (MMG) and Force (FORCE) have been using to assess the changes in the dynamics of muscle after various techniques. The aim of this study was to investigate acute changes in the electro-mechanical properties of quadriceps femoris muscle and tendon after passive streching and manual therapy techniques. A total of 56 healthy subjects aged between 20-35 years old ( have been divided into 4 groups as passive stretching, manual therapy, passive stretching + manual therapy and control group. Subjects in the interventional groups had only one treatment session and they have been assessed immediately after the session. There was no application for the control group. The delays between EMG and MMG signals and, Force-Output of quadriceps femoris during voluntary isometric contraction at three different knee flexion angles, 15°,30° and 45° were simultaneously measured on a device originally derived for positioning lower extremities and a custom made amplifier for signal detection. Signal records have been taken from Rectus Femoris (RF) and Vastus Medialis (VM) muscle fibers. For RF muscle, time delay between EMG-MMG and MMG-Force increased after stretching at 15° knee flexion, while time delay between EMG-Force (electromechanical delay) increased after manual therapy at 15° and 30° knee flexion. Manual therapy + stretching has lengthened the time delay between all onsets of EMG, MMG and Force output in isometric contraction at 15° knee flexion, while time delay between EMG-MMG and EMG-Force has incresed at 30° and 45° knee flexion. For VM muscle, time delay between EMG-Force increased at 15° and 45° knee flexion after stretching. Manual therapy has increased time delay between EMG-Force only at 15° knee flexion. Manual therapy + stretching has lengthened all time delays between EMG, MMG and Force at 15° knee flexion while time delay between EMG-MMG increased only at 30° knee flexion. Comparison of the all application groups revealed that the application of manual therapy has better effects than stretching or manual therapy + stretching when they were tested at 15° of knee flexion for both RF and VM muscles. Stretching was more efficient to reduce stiffness at muscle fiber level for RF muscle during force generation in 15° of knee flexion, whereas manual therapy had beneficial effects to increase time of overall process starting by EMG signal till the generation of force output at both 15° and 30° of knee flexion. For VM muscle, both stretching and manual therapy were efficient to increase time delay of overall process between EMG and Force at 15° of knee flexion. Combination of manual therapy + stretching has increased time delay of overall process in EMG signals in accordance with force output at 15° of knee flexion. Such increase in time delay between EMG signals and force output began to gradually decrease at 30° and 45° of knee flexion for both RF and VM muscles.
Key Words: Electromyography, mechanomyography, Quadriceps tendon, tendon stifness, rectus femoris, vastus medialis, stretching, manual therapy, friction massage
ÖZET
HARİS BEGOVİC, QUADRİCEPS KASININ SERTLİĞİNİ AZALTMADA KULLANILAN PASIF GERME VE MANUEL TEDAVI YÖNTEMLERİNİN
KAS VE TENDON ÜZERİNE OLAN ETKİLERİNİN
KARŞILAŞTIRILMASI, DOKTORA TEZİ, FİZİK TEDAVİ VE
REHABİLİTASYON PROGRAMI, ANKARA, 2014. Germe egzersizleri ve manuel tedavi teknikleri, kas ve tendon sertliğini azaltmak için yaygın olarak kullanılmaktadır. Bu tekniklerin kullanılmasıyla, kas dinamiklerini oluşturan uyarılma-kasılma çifti, elektromekanik gecikme, kas liflerinin vibrasyonu ve güç çıkışının değiştirilebileceği öne sürülmüştür. EMG ve EMG-Güç (EMG-Force) arasındaki zamansal gecikmeler, çeşitli tekniklerden sonraki kas dinamiklerinde ortaya çıkan değişiklikleri değerlendirmek için kullanılır. Bu çalışmanın amacı, manuel tedavi ve pasif germe sonrası Quadriceps kası ve Quadriceps tendonunun elektro-mekaniksel özelliğinde ortaya çıkacak akut değişiklikleri incelemektir. Yaşları 20-35 arasındaki toplam 56 sağlıklı birey, pasif germe, manuel tedavi, pasif germe+ manuel tedavi ve kontrol grubu olmak üzere 4 gruba ayrılmıştır. Uygulama gruplarındaki bireyler tek bir tedavi seansı almışlar ve seanstan hemen sonra değerlendirilmişlerdir. Kontrol grubundaki bireylere bir uygulama yapılmamıştır. 15°, 30° ve 45° olmak üzere 3 farklı diz fleksiyon açısında yapılan istemli izometrik kontraksiyonlar sırasında Quadriceps femoris kasının güç çıkışı(Force output) ve Elektromyografik(EMG) ve mekanomyografik (MMG) sinyalleri arasındaki gecikmeler, alt ekstremiteyi pozisyonlamak için özel olarak tasarlanmış bir cihaz ve bir amplikatörler vasıtasıyla eşzamanlı olarak ölçülmüştür. Sinyal kayıtları, Rectus Femoris (RF) ve Vastus Medialis (VM) kaslarından alınmıştır. Rectus femoris kası için EMG- MMG ve MMG-Force arasındaki zamansal gecikme, germe egzersizlerinden sonra ve 15° de artarken, EMG-Force (elektromekanik gecikme) arasındaki gecikme manuel tedaviden sonra 15° ile 30° diz fleksiyonunda artmıştır. Manuel tedavi + germe, 15° diz fleksiyonunda tüm sinyaller arasındaki (EMG-MMG-Force) zamansal gecikmeleri uzatırken, 30° ve 45°’lik diz fleksiyonlarında sadece EMG-MMG ve EMG-Force sinyallerindeki zamansal gecikmelerde artış olmuştur. VM kası için EMG-Force arasındaki zamansal gecikme, germe egzersizlerinden sonra 15° ve 45° diz fleksiyonunda artmıştır. Manuel tedavi uygulaması, EMG-Force arasındaki gecikmeyi, sadece 15° diz fleksiyonunda artırmıştır. Manual tedavi + germenin, 15° diz fleksiyonunda EMG, MMG and Force sinyalleri arasındaki zamansal gecikmeyi uzatırken, 30° diz fleksiyonunda sadece EMG-MMG arasındaki zamansal gecikmeyi uzatmıştır. Tüm uygulama grupları birbirleri ile karşılaştırıldığında, 15° diz fleksiyonunda, hem RF hem de VM kasları için manuel tedavi uygulamasının, manuel tedavi+ pasif germe uygulamasına göre daha etkili olduğu ortaya konulmuştur. 15° diz fleksiyonundaki güç yayılımı sırasında, RF kasının kas fibrili düzeyindeki sertliğini azaltmak için germenin daha etkili olduğu bulunurken, hem 15° hem de 30°’lik diz fleksiyonunda güç çıkışının yayılımına kadar EMG sinyalleri tarafından başlatılan tüm sürecin zamanını artırmak için manuel tedavinin daha yararlı etkilere sahip olduğu bulunmuştur. VM kası için hem germe hem de manuel tedavi, 15° lik diz fleksiyonunda EMG ve güç arasındaki tüm süreçlerdeki zamansal gecikmeyi artırmada etkili olmuştur. Manuel tedavi ve germe kombinasyonu, 15° diz fleksiyonunda güç çıkışı ile uyumlu olarak EMG sinyallerindeki tüm zamansal süreçlerin artış zamanını artırmıştır. Hem RF, hem de VM kası için EMG sinyalleri ve güç çıkışı arasında gecikme zamanındaki bu artış, 30° and 45°’lik diz fleksiyonunda dereceli olarak azalmaya başlamıştır.
Anahtar kelimeler: Elektromiyografi, mekanomiyografi, Quadriceps tendonu, tendon sertliği, rectus femoris, vastus medialis, germe, manuel tedavi, friksiyon masajı
TABLE OF CONTENTS
Page
ACKNOWLEDGEMENT iv
ABSTRACT v
ÖZET vi
TABLE OF CONTENTS vii
ABBREVIATIONS ix
LIST OF FIGURES x
LIST OF TABLES xii
1. INTRODUCTION 1
2. GENERAL KNOWLEDGE 5
2.1. Muscles of the lower limb 8
2.2. Anatomic structure and architecture of Quadriceps Femoris muscle 8
2.3. Form and architecture of tendons 9
2.4. Tendon functions 11
2.5. The Hill musle model of muscle and tendon 14
2.5.1. Contractile components (CC) 14
2.5.2. Series elastic component (SEC) : tendon 16
2.5.3. Parallel elastic component (PEC) 17
2.6. CC – SEC Interactions during an isometric twitch 18
2.7. Skeletal muscle mechanics 19
2.7.1. Isometric contraction 19
2.8. Concentric Contractions (Isotonic Shortening) 19
2.9. Eccentric ontraction (isotonic lengthening) 20
2.10. The active length - tension mechanics 20
2.11. The passive length-tension relationship 20
2.12. Force-velocity relationship describes isotonic muscle contraction 21
2.13 Tendon Stiffness 21
2.14. Relationship between tendon stiffness and sarcomere length 21
2.15. The mechanism underlying the surfce electromyography 23
2.15.1. Assessment of neuromuscular responses using surface EMG 23
2.15.3. Excitability of muscle membranes 24
2.15.4. The action potential 25
2.15.5. The “raw” EMG signal 25
2.15.6. Factors influencing the EMG signal 26
2.15.7. Temporal measurement of “reflexive activation” 26
2.15.8. Linear envelope detection 26
2.15.9. Determining the EMG onset 26
2.15.10. Electromechanical delay (EMD) 27
2.16. The Mechanisms Underlying The Surface Mechanomyography (MMG) 28
2.17. Measurement of Force 29
2.18. Manual therapy (transverse friction massage) and stretching exercises 31
2.19. Stretchıng Exercıses 31
3. METHODS AND MATERIALS 33
3.1. Subjects 34
3.2. Inclusion/Exclusion Criteria 34
3.3. Statement of informed consent 34
3.4. Study Design 34
3.5. Clinical assessment 35
3.6. Laboratory Assessment 38
3.6.1. Force detection 39
3.6.2. EMG and MMG recording 40
3.6.3. Data collection procedure 42
3.6.4. Physical therapy intervention 44
3.7. Data Analysis 46 3.8 Statistical Analysis 47 4. RESULTS 48 5. DISCUSSION 79 CONCLUSIONS 96 REFERENCES 99
ABBREVIATIONS
CC contractile components
EMD electromechanical delay
EMG electromyography
FA force – activation
FV force – velocity
FL force – length
FΔL force vs length curve
GTO golgi tendon organ
LC load cell
MTU muscle tendon unit
MTJ myotendinous junction
MMG mechanomyography
MUAPs muscle unit action potentials MAS musculoarticular stiffness PEC paralel elastic components PCSA physiological cross sectional area
QF quadriceps femoris muscle
ROM range of motion
RTD rate of torque development
RF rectus femoris
SEC series elastic components
SA stimulation – activation
VL vastus lateralis
VM vastus medialis
VI vastus intermedius
VMO vastus medialis obliqus
LIST OF FIGURES
Page 2.1. Structural hierarchy of skeletal muscle. (from Thomas A. Einhorn.
Orthopaedic Basic Science. 2006-200. AAOS) (34) 5
2.2. Shematic presentation of the tendon. (from Thomas A. Einhorn.
Orthopaedic Basic Science. 2006-2007.AAOS) (34) 10
2.3. A shematic load-elongation curve (stres-strain) for tendon. Indicating three distinct regions of response to tensile loading.(from Thomas A. Einhorn.
Orthopaedic Basic Science. 2006-2007.AAOS) 13
2.4. The three-component Hill muscle model consists of a contractile component (CC), series elastic component (SEC), and parallel elastic component (PEC). (from D.Gordon E.Robertson. Research methods in
muscle biomechanics) 14
2.5. The SEC FΔL relationship. (from D.Gordon E.Robertson. Research
methods in muscle biomechanics) (46) 17
2.6. CC-SEC dynamic interaction during isometric twitch. (from D.Gordon
E.Robertson. Research methods in muscle biomechanics) 18
2.7. Shematic sarcomere length-tension relations to illustrate theoretical changes in a muscles operating range wth changes in the stiffness of the in-series tendon. Assuming all other conditions remained constant, a reduction in tendon stiffness would result in greater sarcomere shortening and a left shift of the sarcomere length-tension relation (A), whereas an increase in tendon stiffness would result in less sarcomere shortenng and a right shift of the sarcomere length-tension relation (B). (from N.D. Reeves.
Adaptation of the tendon to mechanical usage.) 22
2.8. Example of Raw EMG signal 25
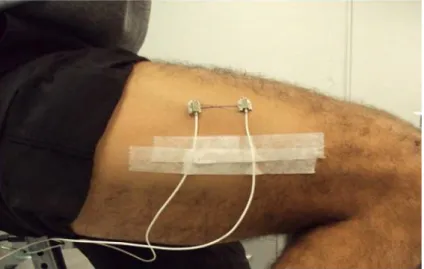
2.9. Example of the proximal and distal accelerometer placement on the vastus
lateralis muscle. 28
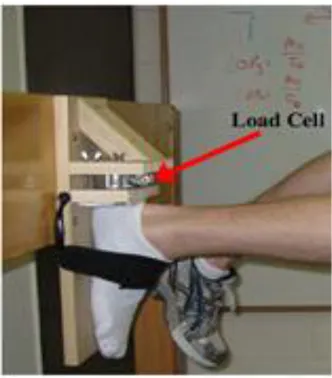
2.10. Example for the measurement of hamstring force with load cell placed on
the back side of calcaneus. 30
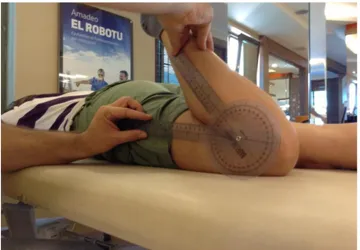
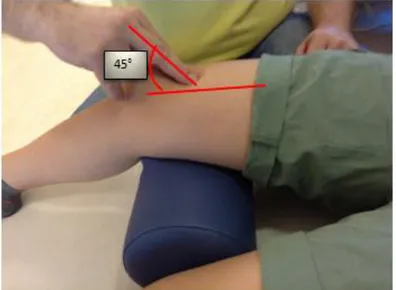
3.2. Measurement of the knee angle wıth the standart goniometer on the tested
side 36
3.3. Goniometric measurement of the active and passive knee flexion range of
motion 36
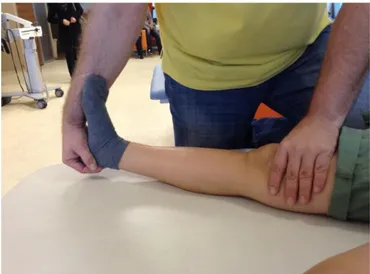
3.4. Measurement of the active and passive range of motion of the knee
dorsiflexion and plantarflexion 37
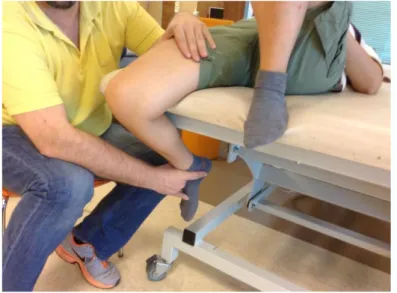
3.5. Assessment of the shortness or tightness of the gastrcnemius muscle is
supine positon. 37
3.6. Overlook of the laboratory testing system 38
3.7. CAS-S model Load Cell. 39
3.8. 16-Bit USB-1608G Data acquisition card 40
3.9. Placement of the EMG electrodes and accelerometers on Rectus Femoris
and Vastus Medialis muscles. 41
3.10. Accelerometer used in the experiments 41
3.11. Designed Simulink operating program in MATLAB 43
3.12. Experimental setup. 44
3.13. Application of passive static stretching exercise for the RM muscle 44 3.14. Application of the transverse friction massage on the quadriceps tendon 45
3.15. Application of the patellar mobilization 45
LIST OF TABLES
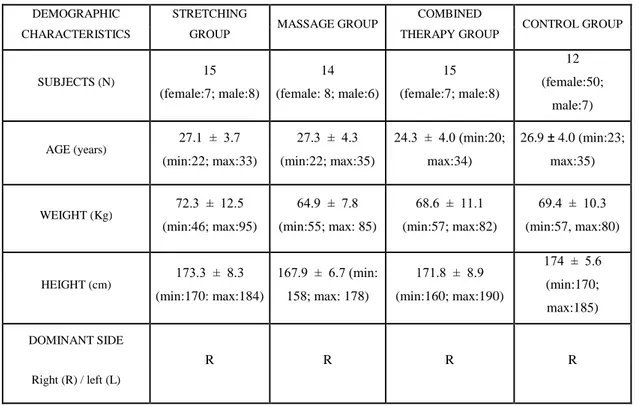
Page 4.1. The physical characteristics of the groups taken from demographic
measurements of the subjects. 48
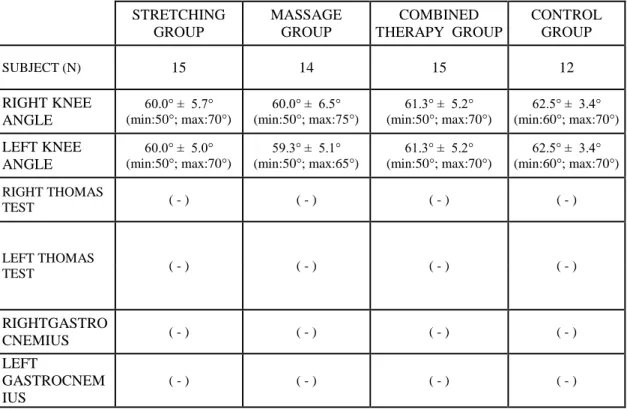
4.2. Goniometric measurements of the active and passive range of motion of
right and left knee joints. 49
4.3. Goniometric measurements of the active and passive range of motion of
right and left ankle joints 50
4.4. Measurements of right and left knee angle in Thomas test position for assessing the tightness of rectus femoris (by Standard goniometer) and muscle tigthness test for iliopsoas and gastrocnemius muscles (expressed
as negative or positive) 51
4.5. Comparative analysis between PRE and POST intervention measurements for the knee flexion ROM measured actively and passively
on the right (dominant) side within the groups. 52
4.6. Comparison of PRE and POST measurement values of Δt [EMG-MMG, Δt [EMG-FORCE] and Δt [MMG-FORCE] onsets for Rectus Femoris
muscle within the control group. 55
4.7. Comparison of first and second measurement values of the time delays 56 4.8. Comparison of PRE and POST values of Δt MMG], Δt
[EMG-FORCE] and Δt [MMG-[EMG-FORCE] time delays for Rectus Femoris muscle
within the stretching group. 57
4.9. Comparsion of PRE and POST intervention values of Δt [EMG-MMG], Δt [EMG-FORCE] and Δt [MMG-FORCE] onsets for Rectus Femoris
muscle within the manual therapy group. 58
4.10. Comparison of PRE and POST intervention values of Δt [EMG-MMG], Δt [EMG-FORCE] and Δt [MMG-FORCE] onsets for Rectus Femoris
muscle within combined therapy group. 59
4.11. Comparison of averages between Δt [EMG-MMG], Δt [EMG – FORCE] and Δt [MMG – FORCE] of POST measurements between control and intervention groups at 15° of knee flexion for RF muscle. 60
4.12. Comparsion of averages between Δt [EMG-MMG], Δt [EMG – FORCE] and Δt [MMG – FORCE] of POST measurements between the control and the intervention groups at 30° of knee flexion for RF muscle. 61 4.13. Comparison of averages between Δt [EMG-MMG], Δt [EMG – FORCE]
and Δt [MMG – FORCE] of POST measurements between control and intervention groups at 45° of knee flexion for RF muscle. 62 4.14. Comparison of first and second measurement values Δt [EMG-MMG], Δt
[EMG – FORCE] and Δt [MMG – FORCE] onsets for Vastus Medialis
for the control group. 63
4.15. Two-way ANOVA between PRE and POST measurements of the time delay Δt [EMG-MMG], Δt [EMG – FORCE] and Δt [MMG – FORCE]
in the Control Group for VM muscle. 64
4.16. Comparsions pf PRE and POST intervention values of Δt [EMG-MMG], Δt [EMG – FORCE] and Δt [MMG – FORCE] onsets for Vastus
Medialis muscle of the stretching group. 65
4.17. Comparison of PRE and POST measurement values of Δt [EMG-MMG], Δt [EMG – FORCE] and Δt [MMG – FORCE] for Vastus Medialis
muscle in the manual therapy group. 66
4.18 Averages and standard deviations analyzed with 1 way ANOVA for Δt [EMG-MMG], Δt [EMG – FORCE] and Δt [MMG – FORCE] onsets measured as PRE and POST for Vastus Medialis muscle within the
combined therapy group. 67
4.19. Comparison of averages between Δt [EMG-MMG], Δt [EMG – FORCE] and Δt [MMG – FORCE] of POST measurements between control and intervention groups at 15° of knee flexion for VM muscle. 68 4.20. Comparison of averages between Δt [EMG-MMG], Δt [EMG – FORCE]
and Δt [MMG – FORCE] of POST measurements between control and intervention groups at 30° of knee flexion for VM muscle. 69 4.21. Comparison of averages between Δt [EMG-MMG], Δt [EMG – FORCE]
and Δt [MMG – FORCE] of POST measurements between control and intervention groups at 45° of knee flexion for VM muscle. 70
4.22. Averages of the Δt [EMG-MMG], Δt [EMG – FORCE] and Δt [MMG – FORCE] described as a percentage change and compared between groups with respect to each other for RF muscle at 15° of knee flexion. 71 4.23 Averages of the Δt [EMG-MMG], Δt [EMG – FORCE] and Δt [MMG –
FORCE] described as a percentage change and compared between groups in respect to each other for RF muscle at 30° of knee flexion. 72 4.24. Averages of the Δt [EMG-MMG], Δt [EMG – FORCE] and Δt [MMG –
FORCE] described as a percentage change and compared between groups in respect to each other for RF muscle at 45° of knee flexion. 73 4.25. Averages of the Δt [EMG-MMG], Δt [EMG – FORCE] and Δt [MMG –
FORCE] described as a percentage change and compared between groups with respect to each other for VM muscle at 15° of knee flexion. 74 4.26. Averages of the Δt [EMG-MMG], Δt [EMG – FORCE] and Δt [MMG –
FORCE] described as a percentage change and compared between groups in respect to each other for VM muscle at 30° of knee flexion. 75 4.27. Averages of the Δt [EMG-MMG], Δt [EMG – FORCE] and Δt [MMG –
FORCE] described as a percentage change and compared between groups with respect to each other for VM muscle at 30° of knee flexion. 76
1. INTRODUCTION
Both stretching and massage techniques have been using frequently by orthopaedic and sport physical therapists in an attempt to acutely increase range of motion and to decrease muscle stiffness (1). Many orthopaedic problems such as patellofemoral pain syndrome resulted by patellar malalignment or degenerative knee joint are affected by quadriceps inflexibility caused by increased stiffness (2). In order to increase quadriceps flexibility, static stretching exercises, musculotendinous junction massage (transvers friction massage) and patellar mobilization techniques are commonly used in clinical practice. Each one of these techniques have different effects along the way on decreasing stiffness in muscles. Static stretching exercises have been investigated under different conditions using different methodologies (3, 4, 5, 6, 7, 8, 9, 10, 11). It has been shown that cyclic and static stretching did not produce any change on muscle-tendon unit (MTU) viscoelastic properties (5). Three weeks of static stretching program has not reveal any changes in tendon stiffness (8). Passive muscle stiffness is defined as the length-tension relationship of passive muscle or slope of the linear portion in the passive torque-angle curve when it is passively stretched (12). Passive muscle stiffness properties has been investigated in some studies (7,8,9) showing that MTU stiffness following repeated stretches was not due to changes in the tendon but rather to an increased compliance of the proximal muscular portion of the MTU (7). One of these studies showed that effect of static stretching was lasting at least for 10 minutes after its application and prolonged effect of stretching was more influential on reducing muscle stiffness rather than tendon stiffness (8). So, there are controversial results about effects of stretching and part of MTU (either muscle or tendon) being affected by stretching.
Various massage techniques like petrissage, tapotement, effleurage and friction massage have already been investigated (13, 14, 15, 16). In one of the study, there has been observed signals changes of the electromyographic (EMG) and mechanomyographic (MMG) amplitude and reduced force production when knee joint has been tested at 60°/s velocity in cybex machine after massage treatment (14). However they could not find any alteration in muscle power (16). Some authors have found reduction of α-motoneuron excitability (17) and increased muscle activity when they initiated massage therapy with deep pressure massage (18). Transverse
friction massage is a commonly used technique by physical therapists to relieve pain and to prevent adhesions in soft tissues. When effects of transverse friction massage on distal portion of myotendinous junction (MTJ) of hamstring muscle have been investigated, it was found increased hip range of motion (ROM) in flexion. This represents as an indication of increased hamstring flexibility, increased muscle compliance and decreased muscle stiffness (15). Continuous application of massage of the MTJ could theoretically activate the inhibitory action of the Golgi Tendon Organs (GTO) or lead to a presynaptic inhibition of the I a sensory fibers from the muscle spindles of the activated muscle (19). Massaging for MTJ of distal portion of hamstring muscle was delivered without additional stretching and its effect on stiffness and flexibility was verified by measuring ROM of hip flexion in one of the study in the literature. However, they did not have any control group in their study and they had no chance to compare the efficacy of the massage. They recomended a future study which the one must include control group to determine combined effects of massage and static stretching in addition to duration of the technique. In the literature, there is a few study measuring musculo-articular stiffness (MAS) using simultaneous recording of EMG, MMG, FORCE and Ultrasonography (20, 21, 22, 23). Simultaneous measurements of EMG, MMG and FORCE may provide insight into the relationship between the mechanical and electrical events associated with a contracting skeletal muscle (24, 25). Stiffness of the tendon is a primer modulator of the musculoarticular stiffness (MAS) at low loads. Muscle stiffness is primarly a function of the numbers of attached cross-bridges between muscle fibers and it increases as isometric muscle torque increases (26). In this situation, simultaneous measurement of EMG and MMG with FORCE can be used to monitor the dissociation between the electrical and mechanical aspects of muscle function (27). MMG records lateral oscillations or grosslateral movements of the muscle fibers at the beginning and at the end of the muscle actions which will be generated by nonsimultaneous activation of the muscle fibers (28). Increase in muscle tension results with increase in intramuscular fluid pressure (IMFP), thus preventing oscillations of the muscle fibers leading to decrease in MMG amplitude. (24) The MMG amplitude is influenced by many factors like muscle stiffness, muscle tension, length, mass of muscle, intramuscular pressure, the viscosity of surrounding tissue, and the motor unit firing frequency (29). In one of the study, a significant correlation
was observed between increased muscle-tendon tension and electromechanical delay (EMD) (30). Reduced electromechanical delay shows increase in muscle and tendon stiffness (30), while increased electromechanical delay shows decrease in muscle-tendon stiffness (31, 22). Thus, time delay between EMG-MMG ( time index of local motion prior to the elongation of the passive series elastic components), EMG-FORCE ( electromechanical delay as a time elapse between onset of action potential and force production) and MMG-FORCE (duration of overall events after cross-bridge formation) would be of high importance to observe muscle dynamics changes and behaviors after some physical therapy interventions like exercise, stretching, manual therapy or massage. However, there is no studies in the literature which shows clearly the effects of physical therapy interventions such as stretching or manual therapy techniques on the MTU assessed by time delay recording EMG, MMG and Force. If we could measure all these biomechanical responce of MTU after physical therapy interventions, we would know more details in all muscle dynamics changes and behaviours. This would give us beneficial results for clinical practice and to compare their acute or late effects. Despite there are many individuals suffering from Quadriceps muscle and tendon stiffness in the clinics, there is stil lack of knowlodge on efficacy of stretching and manual therapy and, their comperable effects in terms of muscle dynamics.
On these basis, the aims of the present study were to assess time delays between EMG, MMG and FORCE in three different interventional groups, which are: passive stretching, manual therapy ( transverse friction massage and patellar mobilization), and combined therapy consisted of passive stretching and manual therapy ( transverse friction massage and patellar mobilization). The results obtained from all these groups were compared with the results obtained from the control group which was non-interventional group but with the same testing procedure as in the interventional groups. The final aim of this study was to find out the most effective intervention to reduce muscle and tendon stiffness.
The hypothesises of this study were that when manual therapy, stretching and manual therapy + stretching applied there will be increase in time delays between EMG, MMG and Force onsets indicating changes in the muscle dynamics which happen during stiffness changes of muscle and tendon of Quadriceps Femoris (QF) muscle.
Hypothesis 1: Passive stretching increases time delay between EMG, MMG and Force.
Hypothesis 2: Manual therapy ( transverse friction massage + patellar mobilizatin) increases time delay between EMG, MMG and Force.
Hypothesis 3: Combined therapy consisted of passive stretching + manual therapy ( transverce friction and patellar mobilization) increases time delay between EMG, MMG and Force.
Hypothesis 4. Combined therapy consisted of passive stretching + manual therapy ( transverce friction and patellar mobilization) has better effects on the increasing time delay comparing with the each intervention alone.
2. GENERAL KNOWLEDGE
Muscle are attached to bone via tendons, which compromise densely packed connective tissue. Tendons, similar to muscles, are devided into fibriles, fibers, fiber bundles, and fascicles. However, the tendon function as a whole of withstand high tensile forces. A tendon consists of 55% to 70% water. In all, 60 to 85% of the dry weight of the tendon is composed of collagen. (32)
Muscle is that tissue type which most completely expresses cell contractility. It is a composite structure consisting of muscle cells or fibers, and the connective tissue network that transmits the pull of the muscle cells. The sarcomere, the basic contractile unit that makes up most of the muscle cells, is composed of actin and myosin. These contractile proteins are arranged in specific pattern, which gives muscle tissue characteristic striated apparance. Sarcomeres are further arranged in paralel to form myofibrils (muscle fiber sor cells), which in turn are arranged in bundles to form fascicles and finally a whole muscle. Other qualities of the muscle structure, particularly the contents of the sarcoplasm, cause muscle fibers to be classified as red ( fast-twitch), white (slow twitch), or intermediate fibers. These characteristics affect not only the contractile properties of the muscle fiber but also its response to exercise and immobilization (33, 34) (Fig. 2.1)
Figure 2.1. Structural hierarchy of skeletal muscle. (from Thomas A. Einhorn. Orthopaedic Basic Science. 2006-200. AAOS) (34)
Two layers of connective tissue cover the muscles: a thick outer layer called fascia, and a thinner layer called the epimysium. Lying underneath the epimysium are boundles of tissue called the fasciculi. Each fasciculus is covered by a connective tissue layer call the perimysium. The fasciculi, then are broken down into cells called muscle fibers. Again, a layer of connective tissue called the endomysium surrounds each of these muscle fibers. The three layers of connective tissue: epimysium, perimysium and endomisyum play an important part in contraction of the muscle and provide access for blood vessels and nerves to reach the interior of the muscle. (32)
Each muscle is composed of a great number of subunits, muscle fibers, that are arranged in paralell and normally extend from one tendon to another. Muscle fibers are cable-like structures composed of tightly packed sub-units myofibrils, that fill-lup most of the volume of the fibers. The myofibrils are composed of sarcomeres arranged in series. The sarcomeres, defined as the basic units of the myofibrils, are responsible for force generation and shorthening of myofibrils. The basic unit is formed by two contractile proteins, or myofilaments, the myosin (thick) and actin (thin) filaments. Actin filaments are anchored at each end to the Z-disks. When a muscle is in a relaxed state there is some overlap between the myosin and actin filaments (35).
With the advent of electron microscopy in the early 1950s, the exact arrangement of the actin and myosin filaments within the sarcomere was discovered. By comparing micrographs of muscle in the relaxed and the contracted state, H.E.Huxley and co-workers in 1954 developed the ‘’sliding filament’’ theory, which immediately gained widespread acceptence. The manner in which this sliding occurs has been the subject of much study. When the muscle is relaxed, the lateral projections of the myosin filaments lie close to theirparent filament, whereas in contraction they project to contact the adjacent actin strands. In contracted muscle the actin filaments slide, in relation to the myosin, toward the center of the sarcomere, bringing the attached Z bands closer together and thus shortening the whole contractile unit. This and many other observations indicate that muscle contraction may be caused by the successive making and braking of cross-connections between thick myosin and thin actin filaments in a cyclical fashion, pulling the actin between the myosin toward the sarcomere center. If contraction is continued, actin filaments may overlap each other in the middle of the A band, and
the Z bands may meet the ends of the myosin filaments. As the length of he sarcomere changes, so does the amount of overlap between the actin and the myosin. Since the numbers of possible cross links between the two depend on the amount of overlap, it might be expected that a muscle would generate different lengths without being allowed to shorten (1).
The three types of muscle contraction – isotonic, isometric and accentric can be correlated with the behavior of the fine structure of the contractile mechanism of actin and myosin. In isotonic contraction, in which a muscle shortens under a constant load to perform positive external work, actin and myosin cross-bridges are active in causing mutual sliding of the filaments. In isometric contraction, cross-bridges are made and broken repeatedly to maintain a constant muscle length under an external load. In eccentric contraction, a muscle generates tension while it is being actively lengthened by an external load. The precise behavior of the filaments has not been estabilished in this type of contraction, but it is probable that cross-bridges are active in the usual manner while the actin and myosin are sliding apart (36).
The last factor to be considered in the basic understanding of muscle structure and function is its innervation. Efferent, or motor, nerves supply each muscle via numerous axons. One axon may supply one or many muscle fibers by means of branching. The ratio of muscle fibers to axons in a muscle determines the fineness of the motion capabilities of that muscle. A single motor neuron and its axons together with all the muscle fibers it innervates is called a motor unit. When stimulated, the fibers belonging to a single motor unit contract either completely or not at all – the ‘’all or none’’ law. The force of contraction can vary because of circumstances as well, such as the physiologic state of the fibers and the length-tension relationship. Within any one motor unit all the fibers can be either red or white but not both.
An excitatory impulse generated naturally in the central nervous system or artificially by an electrical signal generator creates a so-called action potential (specific electrical field) at the relevant muscle fibers. The tensile force developed by a single fiber in response to a single action potential invading the motor endplates is called a twitch. As the frequency of the stimulating impulses increases, twitches begin to overlap. At frequencies above a certain limit, single twitches can no longer be discriminated and tetanic contraction develops. The frequency limit, where tetanic contraction or tetanic force generation occurs, varies among different fibers and
individual motor units. This limit is normally observed in the range between 10 and 100 Hz. The higher the frequency of stimulation of the muscle fibers, the greater is the force produced in the muscle as a whole (35).
2.1. Muscles of the lower limb
Each muscle is unique in terms of its architecture, taken as functional groups (for example, hamstrings, quadriceps, dorsiflexors, plantar flexors). In terms of architecture, the typical properties of the various groups can be articulated.
2.2. Anatomic structure and architecture of Quadriceps Femoris muscle
Quadriceps femoris muscles are characterized by their relative high pennation angles, large Physiological Cross Sectional Areas (PCSA), and short fibers. In terms of design, these muscles appears suited for the generation of large forces (because force is proportional to PCSA). The hamstrings, on the outer hand, by virtue of their relative long fibers and intermediate PCSAs, appear to be designed for large excursions (because excursions are proportional to fiber length) (34).
The quadriceps femoris (QF) has two separate muscles, the two-joint rectus femoris (RF) and one-joint vastus muscles that attach via tendon to the patella, and are innervated by branches from the femoral nerve. The vastus muscles, or vasti, comprise three compartments: Vastus lateralis (VL), Vastus medialis (VM), and Vastus intermedius (VI). The RF muscle is typically described as a simple bipennate muscle, but detailed analyses have revealed a more complex structure. The proximal one-third of RF is unipennate while the distal muscle is radially bipennate. The fibers originate from an internal tendon and attach to the apponeurosis of insertion that surrounds the muscle belly. (37). The vastus medialis obliquus (VMO) and vastus lateralis obliquus (VLO) originate from septa along side the femur and approach the patella from direction that deviate from anatomic axis of the femur. The vastus medalis obliquus has a mean orientation that deviates 47° ± 5° medially from the femoral axis, and the vastus lateralis obliquus has a mean orientation that deviates 35° ± 4° laterally from the axis (38).
There is a major aponeurosis structure, the proximal extension of the quadriceps tendon, attached to RF that also extends inside the vastus muscles.
Because all of the four knee extensor muscles transmit force via this connective tissue, it is likely to have a role in normal and abnormal knee mechanics (37).
Rectus femoris initiates extension of the knee, but contributions from the vasts medialis and lateralis become important only during the latter part of knee extension. Each component of the quadriceps have independent functioning and selective strengthening of each component is emphasized during rehabilitation. Selective strengthening of vastus medialis increases dynamic medial support of the patella. Vastus lateralis provides direct lateral pull on the extensor mechanism (39).
2.3. Form and architecture of tendons
Tendons exhibit nonlinear viscoelastic behaviour in response to deformations or stresses, but most contribute somehow to the rather amazing resistance to fatique damage that tendons display.
The load carrying ability of tendons, resulting from their unique structural organization, is a hallmark requirement of those normal structures. It is of great importance that analogous to bones, both tendons and ligaments adjust their mechanical properties in response to their load history. Several studies have shown that with joint immobility (load deprivation), ligament properties deteriorate quickly and exponentially (they become less stiff and strong within a few weeks of immobility).
Some different morphological aspects and functional responses between suprapatellar and infrapatellar connective tissues have been described: the collagen density is statistically higher in quadriceps tendon compared to patellar ligament, and the maximum force in human quadriceps tendon exceeds that in patellar ligament by ratio of about 8:5 (40).
Frequently, tendons are classified as sheathed or synovial-covered tendons (such as the long flexors of the fingers) and unsheathed or paratenon-covered tendons (such as the Achilles tendon). These two tendon types have differences in their soft-tissue envelope and vascularity.
Figure 2.2. Shematic presentation of the tendon. (from Thomas A. Einhorn. Orthopaedic Basic Science. 2006-2007.AAOS) (34)
Tendon are formed primarily of collagen fibrils, which are evident ultrastructurally. These molecules form fibers that are visible on light microscopy. A collection of fibers forms a fiber bundle, a group of fiber bundles forms a fascicle, and fascicles are surrounded by a loose connective tissue network called the endotenon and the entire tendon is enveloped by a similar and contiguous (with the endotenon) structure called the epitenon. In addition to binding the tendon subunits together, both the epitenon and endotenon subunits together, both the epitenon and endotenon support blood vessels, lymphatics and nerves. Most tendons such as the Achilles tendon, patellar tendon, and flexor tendons of the finger contain multiple fascicles that spiral along the length of the tendon. This permits adjecent fascicles and fiber bundles to slide relative to one another along the longitudinal length of the tendon. (Fig. 2.2)
Although collagen is the primary component of tendon, respresenting 70% to 80% of the dry weight of tendon, it should be remembered that this respresents only the dry weight of tendon, and water is still the primary constitutent of tendons. Water accounts for 50% to 60% of the wet weight of a tendon and this component may be critical during normal and pathologic tendon structure.
Tendons consists mainly of Type I collagen (95%) with a small amount of Type III collagen (< 5%) normally present. There are also minor quantities of other collagen types (type V and VI collagen) (41).
The junction between tendon and bone may take two forms – fibrous or fibrocartilaginous. Fibrous insertions or indirect insertions (such as pes anserinus) are found in the methaphysis and diaphysis of long bones whereas fibrocartiloginous insertions or direct insertions (such as rotator cuff) are typical of tendon insertions into the epiphyses and apophyses of bone. In a fibrous insertion, the collagen fibers of the tendon insert into the periosteum during growth and development and directly into bone at maturation. Conversely, in a fibrocartiloginous insertion, there is a gradual transition from tendon to bone that is characteristically composed of four zones:
1. Tendon,
2. Uncalcified fibrocartilage, 3. Calcified fibrocartilage, 4. Bone.
This gradual transition dissipates load at the insertion site and ensures that the collagen fibers in the tendon bend gradually with joint motions.
Tendons are considered to have a rich nevre supply and are typically innervated by the nevre(s) in its associated muscle(s) in addition to local cutaneous and other nerves. Nerve end-organs including Golgi organs, Pacinian corpuscles, and Ruffini ending generally lie adjacent to the myotendinous junstion whereas free nevre ending are typically adjecent to the bone-tendon junction (32,34).
2.4. Tendon functions
Tendons have mostly mechanical functions. These functions of the tendon can be described as seen below:
1. The primary and most obvious function of tendons is to transmit force generated from muscle to bone
2. Tendons can center the action of several muscles into a single line of pull. 3. They can distribute the contractile force of one muscle to several bones.
4. Tendons allow muscles to be at a distance to their insertion.
5. They allow muscle pull to travel through narrow areas of the body and allow the direction of pull to be changed in conjunction with a pulley
6. They provide static and dynamic stabilization of the joints and they act as passive viscoelastic stabilizers to the joint when they are not active (passive tone)
7. Most of the tendons store elastic energy during locomotion by cyclically lengthening and shortening
Of particular importance of tendon is their nonlinear anisotropic biomechanical behaviour. Tendons are much less extensible than muscle, so tendon is stiffer than the muscle in high- speed traction (42). Under low loading conditions, tendons are relatively compliant. With increasing tensile loads, tendons become increasingly stiff until they reach a range where they exhibit nearly linear stiffness. At this point, elastic elongation is occuring as a result of slippage of the fibers; tearing then occurs through molecular slippage (increased gap between adjacent molecules). Beyond that range, tendons then continue to absorb energy up to the point of their tensile failure. This initial low-load, nonlinear behavior as called the ˝toe region” is caused, in part, by the recruitment of ‘’ crimped’’ collagen fibers, as well as the viscoelastic behaviors and interactions of collagen and other matrix materials. (Fig 2.3)
Figure 2.3. A shematic load-elongation curve (stres-strain) for tendon. Indicating three distinct regions of response to tensile loading.(from Thomas A. Einhorn. Orthopaedic Basic Science. 2006-2007.AAOS)
Material properties of tendon are represented by a stress-strain curve and are biomechanical characteristics of the tendon substance itself. These properties are therefore normalized to the cross-sectional area of the tendon and its original length. Stress is defined as force per unit area (usually Newton/mm² in soft-tissue testing) whereas strain is defined as the change in length divided by its original length. A stress-strain curve will look similar to a load elongation curve except that its values have been normalized to the dimensions of the tendon being tested. From the stres-strain curve the elastic modulus (slope of the curve), the tensile strength (stress at failure), the ultimate strain (strain at failure), and the strain energy density (area under the curve) can be calculated. In human tendons, the elastic modulus has been measured from 1,200 to 1,800 MPa, the ultimate tensile strength from 50 to 105 MPa, and the ultimate strain from 9% to 35%.
Tendons are viscoelastic, meaning they posses time-dependent and history-dependent properties. Therefore their mechanical behaviors depend on the manner, in which they have been loaded (loading rate, loading limits, loading history) and on their environments (such as temparature and water content). This behavior can be represented by several properties including load relaxation, creep, and hysteresis (34).
2.5. The Hill musle model of muscle and tendon
Many models coexist with Hill’s Model like Huxley Model, Huxley and Simmons Crossbridge Model, the Morgan Intersarcomere Dynamics Model, and Zahalak’s Distribution Moment Model. The Hill model is powerful and appropriate for describing muscle mechanics for the purposes of modeling and understanding most voluntary human movements.
The basic Hill model consists of the contractile component (CC), the series elastic component (SEC), and the paralel elastic component (PEC). The model represents muscle behavior rather than structure and each component has its mechanical characteristics (43,44) (Fig 2.4).
Figure 2.4. The three-component Hill muscle model consists of a contractile component (CC), series elastic component (SEC), and parallel elastic component (PEC). (from D.Gordon E.Robertson. Research methods in muscle biomechanics)
2.5.1. Contractile components (CC)
In the Hill model, the CC is the ‘’active’’ element that turns nervous signals into force. The magnitude of the CC force produced depends on its mechanical characteristics, which can be expressed in four separate relationships:
1. Stimulation – activation (SA) 2. Force – activation (FA) 3. Force – velocity (FV) 4. Force – length (FL) (34)
2.5.1.1. Stimulation – activation, SA (excitation – contraction coupling process)
The first of the CC’s mechanical properties concerns how the nervous system signal (stimulation) is related to the muscle’s intrinsic force capability or potential (activation). Physiologically, this property reflects the excitation-contraction coupling process, in which α-motor neuron action potentials (APs) trigger motor unit action potentials (MUAPs) that travel along muscle fibers. These MUAPs are carried inward through the transverse tubule system to the sarcoplasmic reticulum, where they cause the release of calcium ions into individual sarcomeres. This portion of the excitation contraction coupling sequence can be considered the stimulation, because it is independent of the actual force production mechanism in the sarcomere at the level of the crossbridges, which link the thick and thin filaments containing the contractile proteins myosin and actin, respectively. The actin-myosin complex responds to the calcium ion influx by changing from its resting state (no cross-bridge attachment and no force potential) to an activated state in which force production can occur. This is the activation part of the stimulation-activation process. Stimulation represents the input to the process and the activation represents the response, or output (45).
When a motor unit is initially activated, there is a time delay between the onset of the neural AP and the activation at the crossbridge level. This time delay has two components, the first of which is the transit time for the MUAP to travel from the myoneural junction to the sarcoplasmic reticulum. The second component is the length of time for the calcium ions to be released from the sarcoplasmic reticulum and become attached to the thin filaments, a process that, when completed, removes the inhibition from crossbridge attachment imposed by the troponin-tropomyosin complex. When the force response from the motor unit is no longer necessary, the α motor neuron stops sending impulses. However, for a brief period, there is still a supply of calcium ions within the sarcomeres, allowing the crossbridges to remain activated even in the absence of stimulation. The duration of this deactivation process is longer than the activation process, and it is dictated by the time it takes fort he sarcoplasmic reticulum to reabsorb the free calci um ions within the sarcomeres (34,45, 46).
2.5.1.2. Force – activation
Force – activation is a state in which force can be produced, rather than an actual force level. The force – activation relation is direct and linear (e.g. 10, 20, or 50% activation represents 10, 20 and 50% force, respectively.
2.5.1.3. Force – velocity (FV)
Influence of CC velocity on force production.
2.5.1.4. Force – length (FL)
The basic shape of the FL relation illustrates that isometric force production is greatest at intermediate CC lengths and declines as the CC is either lengthened or shortened.
2.5.2. Series elastic component (SEC) : tendon
Any force the contractile component (CC) produces, is expressed across the series elastic components (SEC). One obvious contributor to the SEC elasticity is the tendon that joins the muscle fibers to the skeleton. In this perspective tendon is considered passive connective tissue.
Other structures contributing to the elasticity;
a. Aponeurosis or inner tendon which connects tendon to muscle fibers b. Connective elements within the muscle fibers (e.g. Z – lines)
SEC elasticity results from all elastic elements in tendon with the active force –generating elements in the muscle. Recents studies indicate that the aponeurosis contribute to a large extent to the series elasticity.
2.5.2.1. SEC elastic behavior
In physics, the elasticity of a material is usually quantified by its stiffness, (k), calculated as the change in applied force divided by the resulting change in the length of the material.
Increased SEC extension results with increase in the slope of (force-length curve) FΔL. Increased slope of the FΔL means increase in the stiffness (46). (Fig 2.5)
Figure 2.5. The SEC FΔL relationship. (from D.Gordon E.Robertson. Research methods in muscle biomechanics) (46)
2.5.3. Parallel elastic component (PEC)
Muscle display elastic behavior even if the CC is inactive and producing no force. If an external force is applied across an inactive, passive muscle, it resists, but stretches to a longer length. This is not a response of the SEC, because no force is being produced by the inactive CC. Instead, this inactive elastic response is produced by structures that are ‘in parallel’ to the CC. The paralel elastic component (PEC) is usually correlated with the fascia that surrounds the outside of the muscle and separates muscle fibers into distinct compartments. Like the SEC, the FΔL relationship of the PEC is highly nonlinear in nature, with increasing stiffness as the muscle lengthens.
The PEC elasticity is considered a passive response, yet it can play a role during active force production too. In an active isometric force situation, the measured force response is a combination of the active CC force and the passive PEC force associated with the isometric length of the muscle, depicts the FL relations of the active CC, the passive PEC, and the summed CC and PEC responses. At shorter lengths, the PEC is not streched and, thus the muscle force response will be entirely caused by the active CC. As the muscle is placed at longer lengths, the PEC is stretched and its force response is added to the active CC response. The exact
shape of the summed response across the range of muscle lengths depends on the relative overlap of the CC and PEC response (34, 45).
2.6. CC – SEC Interactions during an isometric twitch
Given stimulative pulse of few milliseconds cause a peak twitch force in time of 20 to 50 ms. This discrepency in time course results from CC and SEC dynamics interaction and the interplay of their mechanical properties.
Given stimulus---CC becomes active via (SA, FA, FV, and FL)--FΔL changes at SEC
If total muscle length is kept constant (shortened CC + lengthened SEC), it is isometric contraction. With decreasing stimulation, the force continually falls, meaning that the SEC is recoiling (shortening) and the CC is therefore lengthening.
During isometric contraction, the actual force produced by the CC is less than its capability.
During isometric contraction, the CC shortens at the same high velocity, as the CC and SEC velocities must offset each other to keep the total muscle in an isometric state. (46,47) (Fig 2.6).
Figure 2.6. CC-SEC dynamic interaction during isometric twitch. (from D.Gordon E.Robertson. Research methods in muscle biomechanics)
Biomechanical effects of various massage techniques are believed to be achieved by increasing muscle-tendon compliance by mobilising and elongating muscle tendon unit. Various massage techniques which produce mechancal effects on tendon compliance mean that compliance of SEC is being changed. Its change is going to effect also muscle mechanics affecting contractile components. Passive and active stiffness properties are going to be changed and it is important to investigate how are affected muscle’s electromechanical characteristics after massage itself and combined with stretching exercises (48).
2.7. Skeletal muscle mechanics
There are two main ways in which a muscle may work naturally. It may contract and produce no movement, called isometric contraction, or it may produce movement during contraction, called isotonic contraction. There are two types of isotonic contractions, concentric contraction and ecentric contraction.
2.7.1. Isometric contraction
When a muscle works isometrically, it keeps constant its muscular length and slightly lengthens its non-contractile components and in doing so, no movement occurs at any of the joints over which that muscle passes. It is easiest and in fact usual for an induced isometric contraction to be performed when a muscle is resting at the innermost part of its range, i.e. with the muscle attachments approximated, but with practice the skill can be developed so that it is possible isometrically to contract a muscle or muscle group at any part of the range. Isometric contraction can be taught to a muscle by the application of a manual resistance which is exactly equal to the contraction which the muscle produces (49).
2.8. Concentric Contractions (Isotonic Shortening)
When a muscle is activated and required to lift a load that is less than the maximum tetanic tension it can generate, the muscle begins to shorten. Contractions that permit the muscle to shorten are known as concentric contractions. In concentric contractions, the force generated by the muscle is always less than the muscle’s maximum force (P₀). As the load the muscle is required to lift decreases, contraction
velocity increases. This occurs until the muscle finally reaches its maximum contraction velocity, V max.
2.9. Eccentric ontraction (isotonic lengthening)
As the load on the muscle increases, it finally reaches a point where the external force on the muscle is greater than the force that the muscle can generate. Even though the muscle may be fully activated, it is forced to lengthen because of the high external load. There are two main characteristics regarding eccentric contractions. First, the absolute tensions achieved are very high relative to the muscle’s maximum tetanic tension-generating capacity; second, the absolute tension is relatively independent of lengthening velocity. These characteristics suggest that skeletal muscles are very resistant to lengthening, a property necessary for many normal movement paterns.
2.10. The active length - tension mechanics
It has been known that the force developed by a muscle during isometric contraction (when the muscle is not allowed to shorten) varies with its starting length. The isometric length-tension curve is generated by maximally stimulating a skeletal muscle at a variety of discrete lengths and measuring the tension generated at each length. The length tension relationship reflects the fact that tension generation in skeletal muscle is a direct function of the magnitude of overlap between the actin and mysoin. (46)
2.11. The passive length-tension relationship
The tension is generated if a muscle is stretched to various lengths without stimulation. Near the optimal length, passive tension is almost zero. However, as the muscle is stretched to longer lengths, passive tension increases dramatically. These relatively long lengths can be attined physiologically, and therefore, passive tension can play a role in providing, resistive force even in the absence of muscle activation. (46)
2.12. Force-velocity relationship describes isotonic muscle contraction
Unlike the length-tension relationship, the force-velocity relationship does not have a precise, anatomically identifiable basis. The force-velocity relationship describes the force generated by a muscle as a function of velocity under conditions of constant load (isotonic condition). It can also be stated in the reverse, such that the velocity of muscle contraction is dependent on the force resisting the muscle. (46)
2.13 Tendon Stiffness
Stiffness is a property of the tendon which is principally associated with the unit’s ability to transfer forces. A stiffer tendon being able to transfer muscle forces to the bone more rapidly than a less stiff (or more compliant) tendon. (50)
Tendons are spring-like structures and their tensile stiffness is adaptable to the mechanical environment they operate in, increasing in response to chronic loading and decreasing with chronic unloading. Findings from the in vivo studies are mixed as to whether these adaptations are due to changes in the tendon’s cross-sectional area, material properties or both. The increase in stiffness may be explained by increases in tendon size and/or Young’s modulus (stiffness = Young’s modulus tendon cross-sectional area/tendon length), and the later may be due to tendon microstructural changes, including an icreased collagen fibril diamater, an increased fibril packing, an increased collagen cross-linking, and a reduced collagen crimping.
A compliant tendon will allow, relatively slow transmission of forces from muscle to bone, thereby exhibiting the tendon as a ‘’viscoelastic damper’’ (51).
2.14. Relationship between tendon stiffness and sarcomere length
Most human muscles (including the gastrocnemius muscle) act on the ascending limb of the sarcomere length-tension relation, thus more fibre shortening would shift the muscles’ operating range to the left, away from the optimal region, causing a reduction in force. (Fig 2.7). However, the number of sarcomeres in-series will also influence this theoretical effect and may vary between young and older adults. The more compliant tendon of older adults may result in a slower
transmission of contractile forces to the skeleton, which will be seen as a slower rate of torque development at the level of the whole joint system.
The increased tendon stiffness found after the resistance training intervention might be expected to increase the velocity of force transmission. The increased tendon stiffness post-intervention may also have implications for the muscle’s operating range. It might be speculated that the muscle fibers woud shorten less, causing a shift towards the optimal sarcomere operating range (assuming the muscle acts on the ascending limb) (Fig 2.7) (52).
Figure 2.7. Shematic sarcomere length-tension relations to illustrate theoretical changes in a muscles operating range wth changes in the stiffness of the in-series tendon. Assuming all other conditions remained constant, a reduction in tendon stiffness would result in greater sarcomere shortening and a left shift of the sarcomere length-tension relation (A), whereas an increase in tendon stiffness would result in less sarcomere shortenng and a right shift of the sarcomere length-tension relation (B). (from N.D. Reeves. Adaptation of the tendon to mechanical usage.)
Reduction in tendon stiffness - greater sarcomere shortening - left-shift of the sarcomere length-tension relation
Increase in tendon stiffness - less sarcomere shortening - right shift of the sarcomere length-tension relation.
One of the studies showed that there is a strain variation along the tendon aponeurosis. This finding of nonhomogenous behavior has important implications for muscle function. Muscle fibers attached to more extensible aponeurotic regions would shorten more upon contraction than fibers attached to less extensible aponeurotic regions. The extra shortening will result in shifting the force-length relation of muscle-tendon unit to the right, which will result in a force enhancement in units operating in the descending limb of the force-length relation and in a force reduction in units operating in the ascending limb of the force-length relation (53).
It was found that the patellar tendon is significantly stiffer in adults, compared to children (54). The increase in stiffness can be attributed to a relative increase in both cross-sectional area of the tendon and an increased Young’s modulus in females, while increased Young’s modulus only in males (51). Tendon mechanical properties have a key role in the time course of torque development. In fact, tendon stiffness affects the time required to stretch the series elastic components (SEC) and will therefore affect both the electromechanical delay (EMD) and the rate of torque development (RTD) (55).
Electromechanical delay is interpreted in terms of changes in musculo-tendinous stiffness and it is a measure of the time delay or time elapse between muscle activation and muscle force production . The EMD is considered to be influenced by several structures and mechanisms, including the time course of:
1-The propagation of the action potential over the muscle membrane 2-The excitation-contraction coupling process
3-The stretching of the series elastic component (SEC) by the contractile components (56).
2.15. The mechanism underlying the surfce electromyography
2.15.1. Assessment of neuromuscular responses using surface EMG
Surface EMG has been used extensively in biomechanical applications to describe and quantify a muscle or muscle group’s activity or performance about the knee.
Surface EMG can assist the clinician or researcher in determining when a muscle is activated, the timing of that activation in relation to a stimulus or event, and its sequential firing with other muscles.
Unlike the classical neurological EMG, where an artificial muscle response due to external electrical stimulation is analyzed in static conditions, the focus of kinesiological EMG can be described as the study of the neurmuscular activation of muscles within postural tasks, functional movements, work conditions and treatment / training regimes.
2.15.2. The motor unit
The smallest functional unit to describe the neural control of the muscular contraction process is called a Motor Unit. It is defined as the cell body and dendrites of a motor neuron, the multiple branches of its axon, and the muscle fibers that innervates it.
2.15.3. Excitability of muscle membranes
The excitability of muscle fibers through neural control represents a major factor in muscle physiology. This phenomenon can be explained by a model of a semi-permeable membrane describing the electrical properties of the sarcolemma. An ionic equilibrium between the inner and outer spaces cell forms a resting potential at the muscle fiber membrane (approximately -80 to -90 mV when it is not contracted). This difference in potential which is maintained by physiological processes (ion pump) results in a negative intracellular charge compared to the external surface. The activation of an alpha-motor anterior horn cell (induced by the central nervous system or reflex) results in the conduction of the excitation along the motor nevre. After the release of transmitter substances at the motor endplates, an endplate potential is formed at the muscle fiber innervated by this motor unit. The diffusion characteristics of the muscle fiber membrane are briefly modified and Na+ ions flow in. This causes a membrane depolarization which is immediately restored by backward of ions within the active ion pump mechanism, the repolarization (57).
2.15.4. The action potential
If a certain threshold level is exceeded within the Na+ influx, the deloparization of the membrane causes an Action Potential to quickly change from -80 Mv up to +30 Mv. It is monopolar electrical burst that is immediately restored by the repolarization phase and followed by an After Hyperpolarization period of the membrane. Starting from the motor end plates, the action potential spreads along the muscle fiber in both directions and inside the muscle fiber through a tubular system.
This excitation leads to the release of calcium ions in the intra-cellular space. Linked chemical processes (Electro-mechanical Coupling) finally produce a shortening of the contractile elements of the muscle cell.
The EMG signal is based upon action potentials at the muscle fiber membrane resulting from the depolarization and repolarization processes as described above (58).
2.15.5. The “raw” EMG signal
An unfiltered (exception: amplifier bandpass) and unprocessed signal detecting the superposed Muscle Unit Action Potentials (MUAPs) is called a raw EMG Signal. (Fig 2.8)